

Predicting sepsis in-hospital mortality with machine learning: a multi-center study using clinical and inflammatory biomarkers
- PMID: 38448999
- PMCID: PMC10918942
- DOI: 10.1186/s40001-024-01756-0
Predicting sepsis in-hospital mortality with machine learning: a multi-center study using clinical and inflammatory biomarkers
Abstract
Background: This study aimed to develop and validate an interpretable machine-learning model that utilizes clinical features and inflammatory biomarkers to predict the risk of in-hospital mortality in critically ill patients suffering from sepsis.
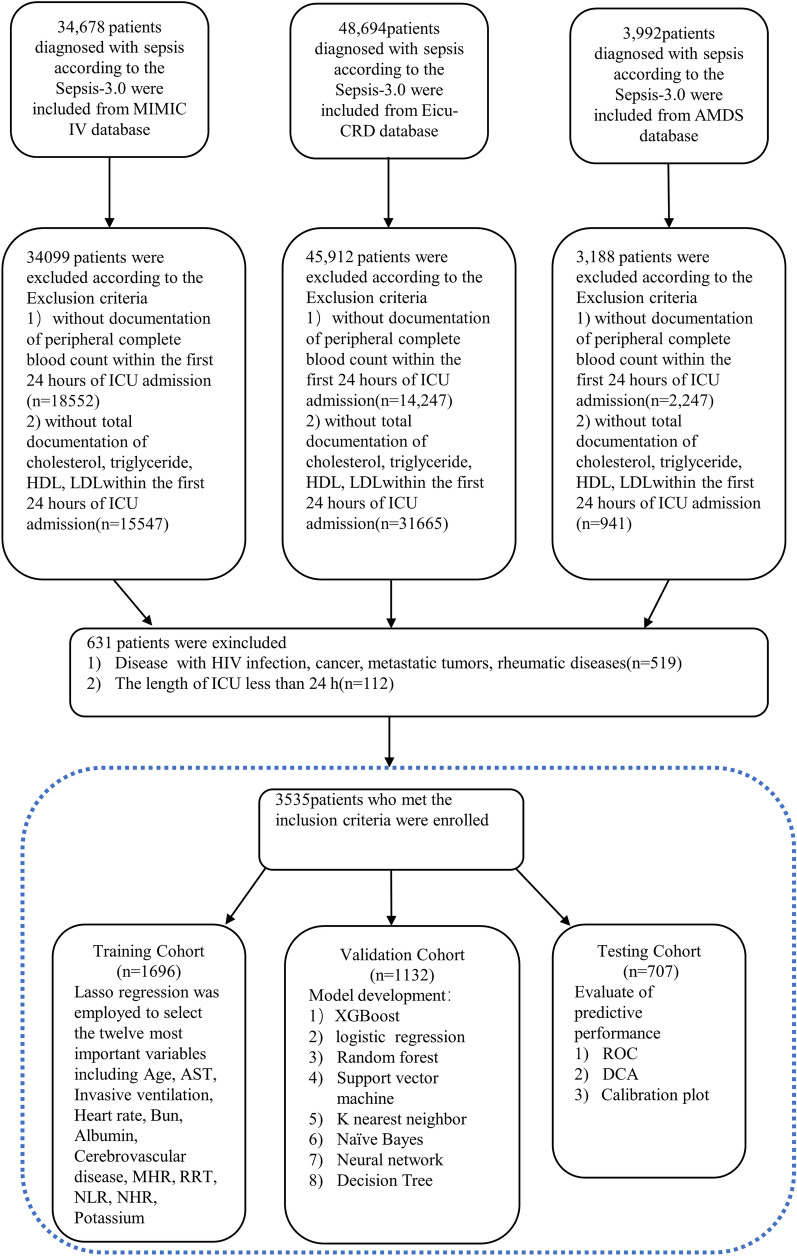
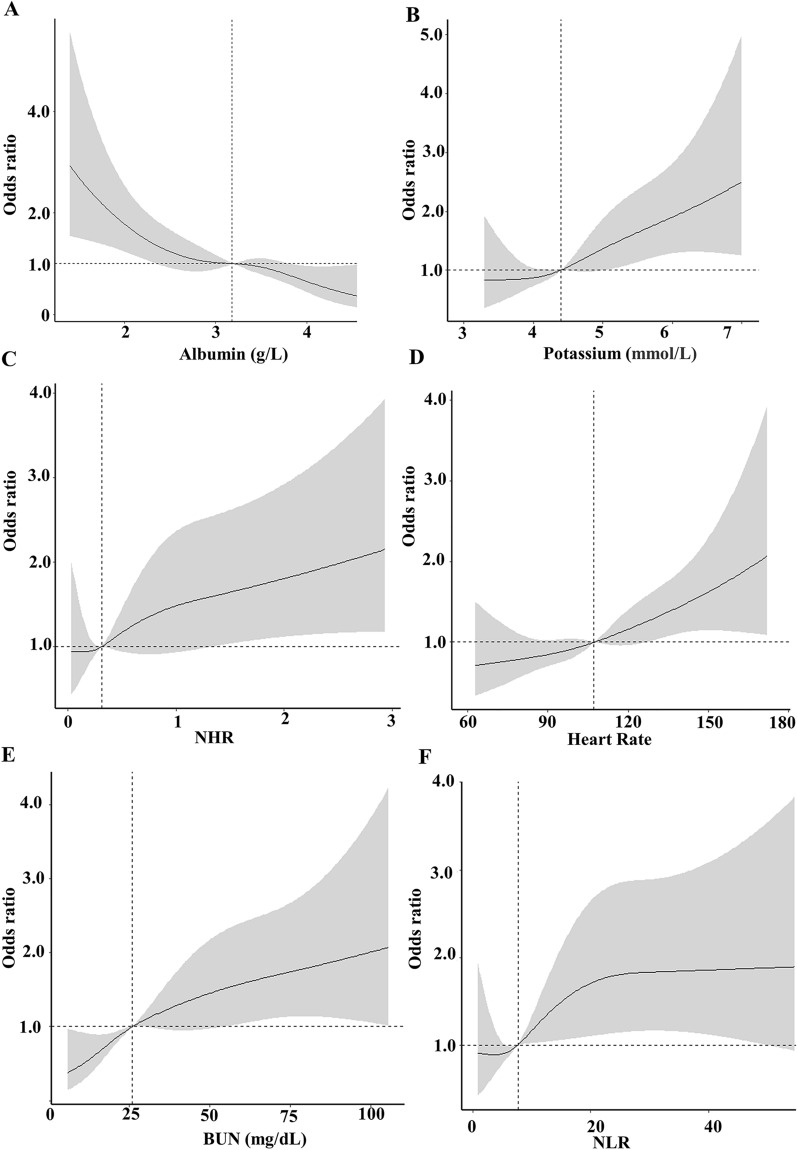
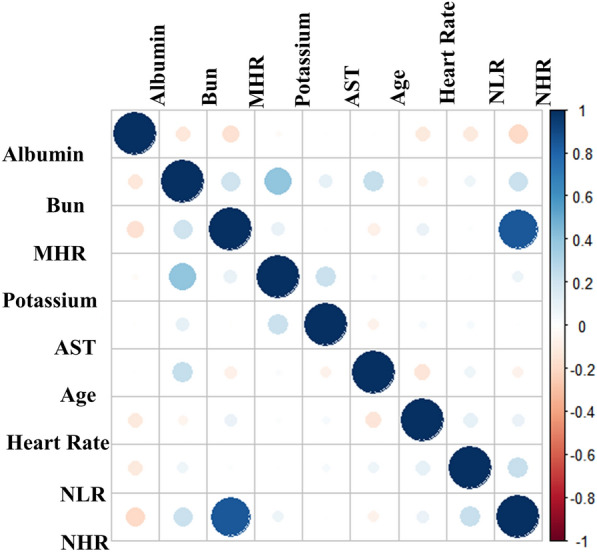
Methods: We enrolled all patients diagnosed with sepsis in the Medical Information Mart for Intensive Care IV (MIMIC-IV, v.2.0), eICU Collaborative Research Care (eICU-CRD 2.0), and the Amsterdam University Medical Centers databases (AmsterdamUMCdb 1.0.2). LASSO regression was employed for feature selection. Seven machine-learning methods were applied to develop prognostic models. The optimal model was chosen based on its accuracy, F1 score and area under curve (AUC) in the validation cohort. Moreover, we utilized the SHapley Additive exPlanations (SHAP) method to elucidate the effects of the features attributed to the model and analyze how individual features affect the model's output. Finally, Spearman correlation analysis examined the associations among continuous predictor variables. Restricted cubic splines (RCS) explored potential non-linear relationships between continuous risk factors and in-hospital mortality.
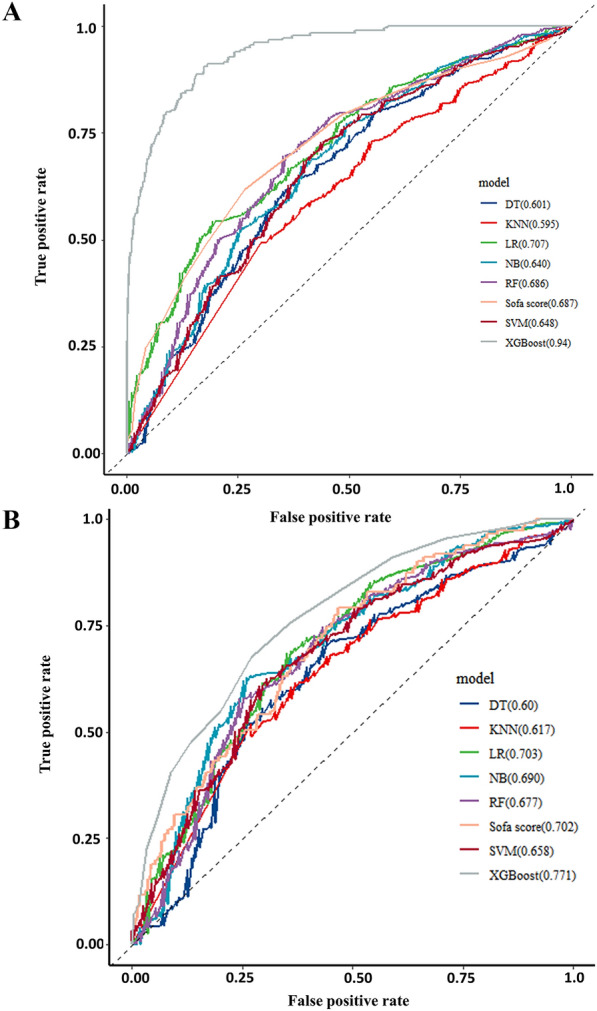
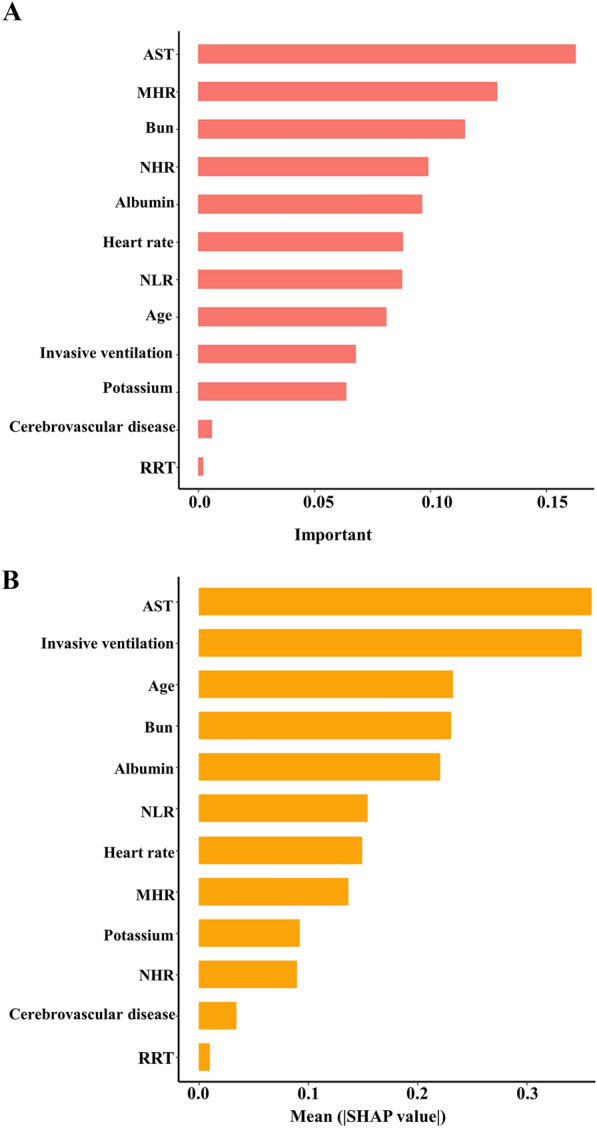
Results: 3535 patients with sepsis were eligible for participation in this study. The median age of the participants was 66 years (IQR, 55-77 years), and 56% were male. After selection, 12 of the 45 clinical parameters collected on the first day after ICU admission remained associated with prognosis and were used to develop machine-learning models. Among seven constructed models, the eXtreme Gradient Boosting (XGBoost) model achieved the best performance, with an AUC of 0.94 and an F1 score of 0.937 in the validation cohort. Feature importance analysis revealed that Age, AST, invasive ventilation treatment, and serum urea nitrogen (BUN) were the top four features of the XGBoost model with the most significant impact. Inflammatory biomarkers may have prognostic value. Furthermore, SHAP force analysis illustrated how the constructed model visualized the prediction of the model.
Conclusions: This study demonstrated the potential of machine-learning approaches for early prediction of outcomes in patients with sepsis. The SHAP method could improve the interoperability of machine-learning models and help clinicians better understand the reasoning behind the outcome.
Keywords: Intensive care unit; Machining learning; Prediction; Sepsis; XGBoost.
© 2024. The Author(s).
Conflict of interest statement
The authors declare that the research was conducted without any commercial or financial relationships that could be construed as a potential conflict of interest.
Figures

Similar articles
-
Interpretable Machine Learning for Early Prediction of Prognosis in Sepsis: A Discovery and Validation Study.Infect Dis Ther. 2022 Jun;11(3):1117-1132. doi: 10.1007/s40121-022-00628-6. Epub 2022 Apr 10. Infect Dis Ther. 2022. PMID: 35399146 Free PMC article.
-
Interpretable machine learning for 28-day all-cause in-hospital mortality prediction in critically ill patients with heart failure combined with hypertension: A retrospective cohort study based on medical information mart for intensive care database-IV and eICU databases.Front Cardiovasc Med. 2022 Oct 12;9:994359. doi: 10.3389/fcvm.2022.994359. eCollection 2022. Front Cardiovasc Med. 2022. PMID: 36312291 Free PMC article.
-
Interpretable machine learning model for early prediction of 28-day mortality in ICU patients with sepsis-induced coagulopathy: development and validation.Eur J Med Res. 2024 Jan 3;29(1):14. doi: 10.1186/s40001-023-01593-7. Eur J Med Res. 2024. PMID: 38172962 Free PMC article.
-
Interpretable machine learning model to predict surgical difficulty in laparoscopic resection for rectal cancer.Front Oncol. 2024 Feb 6;14:1337219. doi: 10.3389/fonc.2024.1337219. eCollection 2024. Front Oncol. 2024. PMID: 38380369 Free PMC article. Review.
-
The CMLA score: A novel tool for early prediction of renal replacement therapy in patients with cardiogenic shock.Curr Probl Cardiol. 2024 Dec;49(12):102870. doi: 10.1016/j.cpcardiol.2024.102870. Epub 2024 Sep 27. Curr Probl Cardiol. 2024. PMID: 39343053 Review.
Cited by
-
Navigating the Modern Landscape of Sepsis: Advances in Diagnosis and Treatment.Int J Mol Sci. 2024 Jul 5;25(13):7396. doi: 10.3390/ijms25137396. Int J Mol Sci. 2024. PMID: 39000503 Free PMC article. Review.
-
Thirty-day mortality risk prediction for geriatric patients undergoing non-cardiac surgery in the surgical intensive care unit.Eur J Med Res. 2025 May 9;30(1):372. doi: 10.1186/s40001-025-02543-1. Eur J Med Res. 2025. PMID: 40346684 Free PMC article.
-
Artificial Intelligence in Sepsis Management: An Overview for Clinicians.J Clin Med. 2025 Jan 6;14(1):286. doi: 10.3390/jcm14010286. J Clin Med. 2025. PMID: 39797368 Free PMC article. Review.
-
Machine Learning and Artificial Intelligence for Infectious Disease Surveillance, Diagnosis, and Prognosis.Viruses. 2025 Jun 23;17(7):882. doi: 10.3390/v17070882. Viruses. 2025. PMID: 40733500 Free PMC article. Review.
-
Machine learning based prediction of cognitive metrics using major biomarkers in SuperAgers.Sci Rep. 2025 May 28;15(1):18735. doi: 10.1038/s41598-025-01477-2. Sci Rep. 2025. PMID: 40436987 Free PMC article.
References
-
- Fleischmann C, Scherag A, Adhikari NK, Hartog CS, Tsaganos T, Schlattmann P, Angus DC, Reinhart K. Assessment of global incidence and mortality of hospital-treated sepsis. Current estimates and limitations. Am J Respir Crit Care Med. 2016;193(3):259–272. doi: 10.1164/rccm.201504-0781OC. - DOI - PubMed
Publication types
MeSH terms
Substances
LinkOut - more resources
Full Text Sources
Medical
