

Adipose Tissue and Umbilical Cord Tissue: Potential Sources of Mesenchymal Stem Cells for Liver Fibrosis Treatment
- PMID: 38449506
- PMCID: PMC10912848
- DOI: 10.1016/j.jceh.2024.101364
Adipose Tissue and Umbilical Cord Tissue: Potential Sources of Mesenchymal Stem Cells for Liver Fibrosis Treatment
Abstract
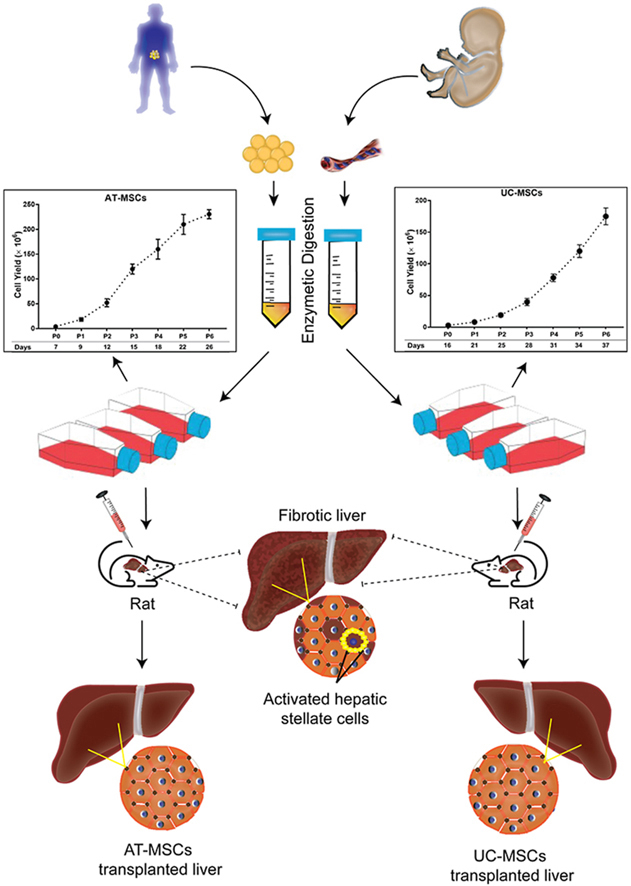
Background/aims: Mesenchymal stem cells (MSCs) are potential alternatives for liver fibrosis treatment; however, their optimal sources remain uncertain. This study compares the ex-vivo expansion characteristics of MSCs obtained from adipose tissue (AT) and umbilical cord (UC) and assesses their therapeutic potential for liver fibrosis treatment.
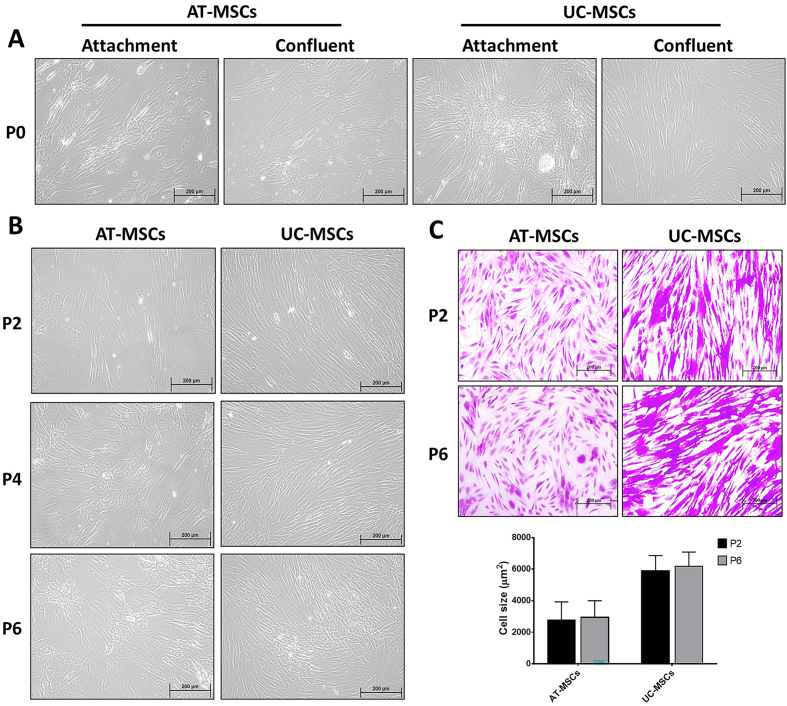
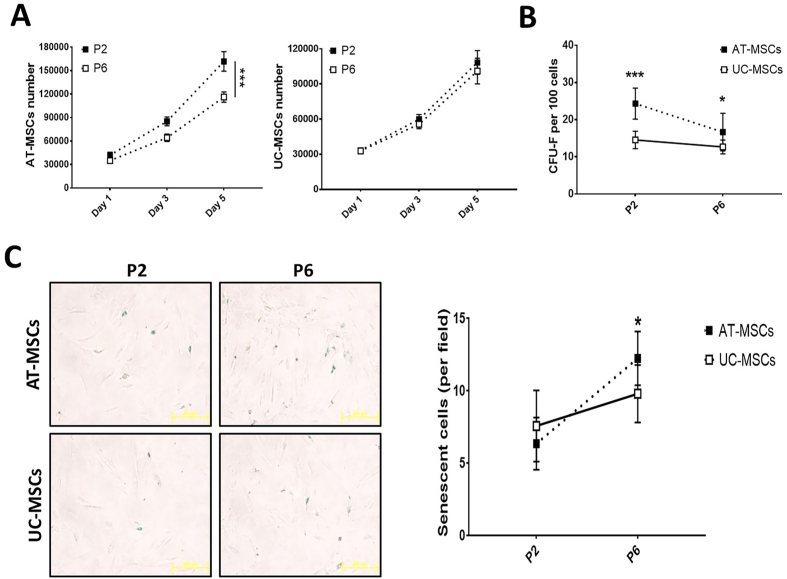
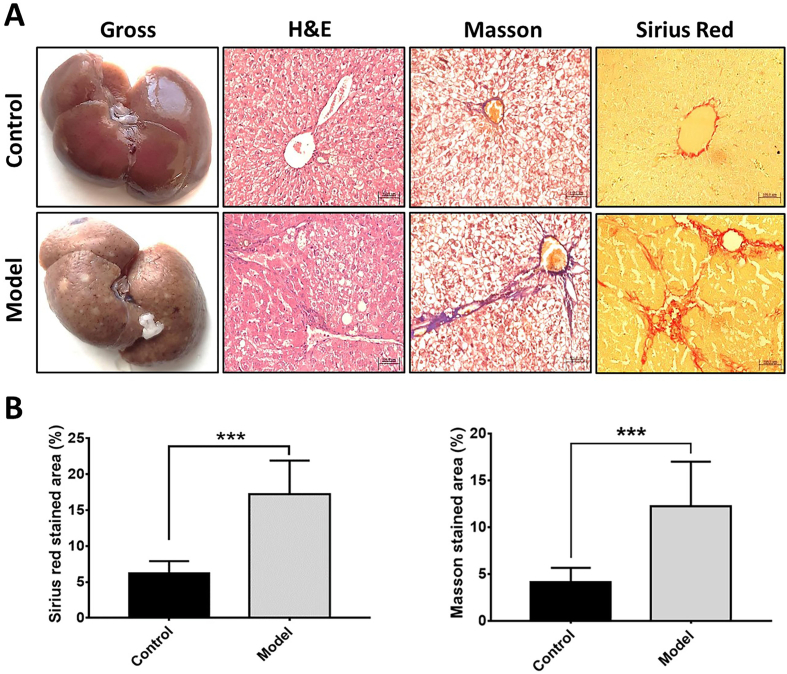
Methods: Since MSCs from early to mid-passage numbers (P2-P6) are preferable for cellular therapy, we investigated the growth kinetics of AT-MSCs and UC-MSCs up to P6 and evaluated their therapeutic effects in a rat model of liver fibrosis induced by diethylnitrosamine.
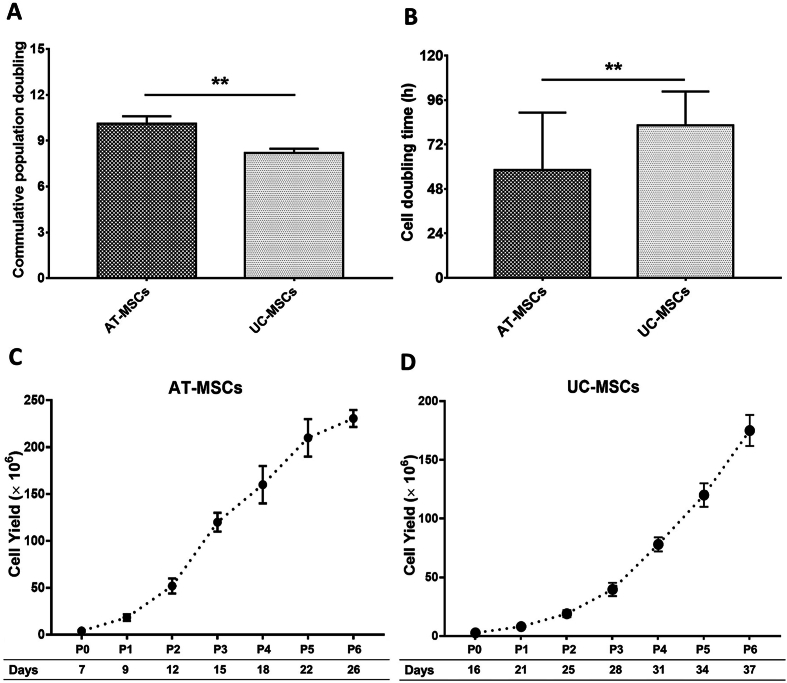
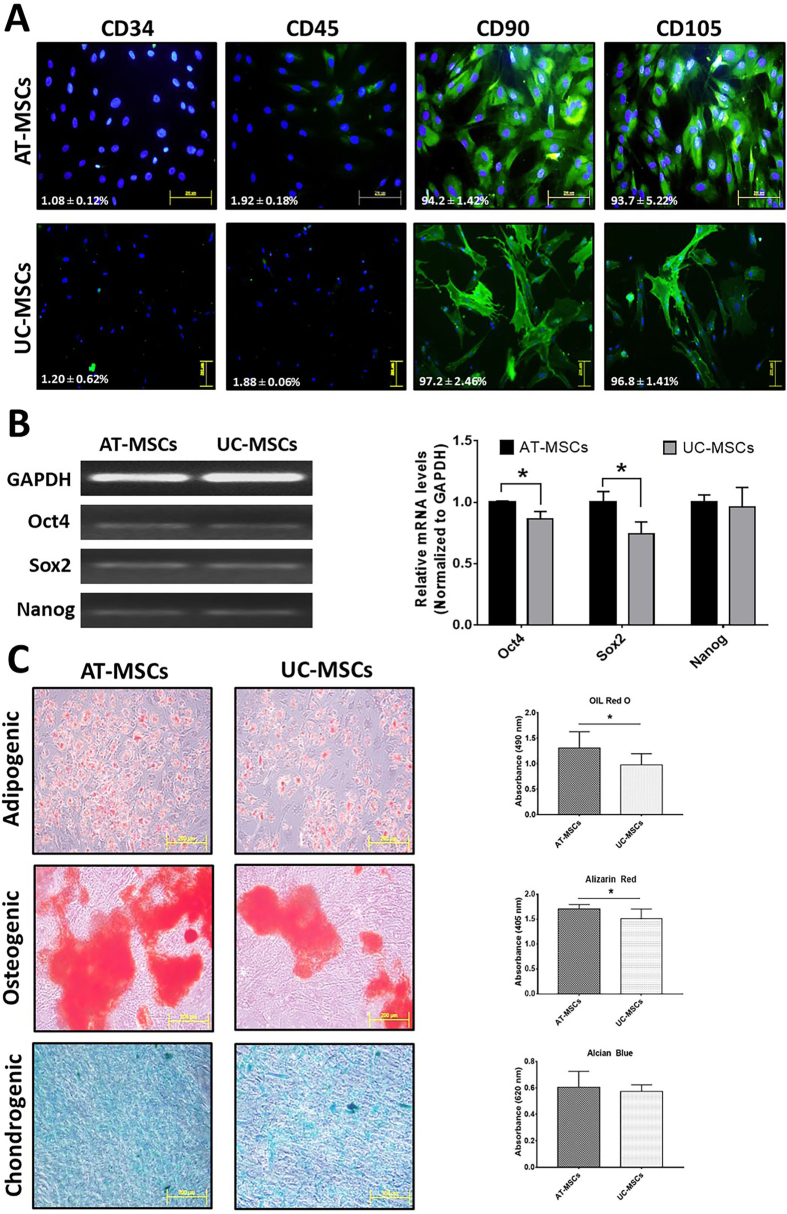
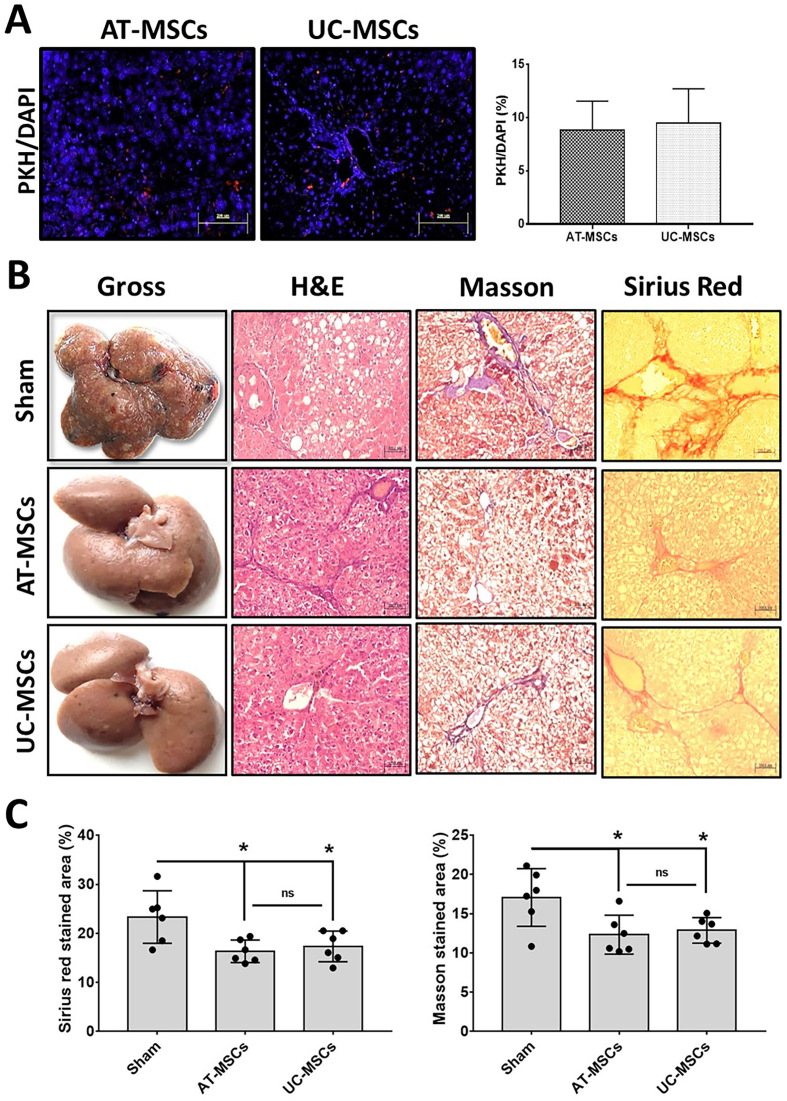
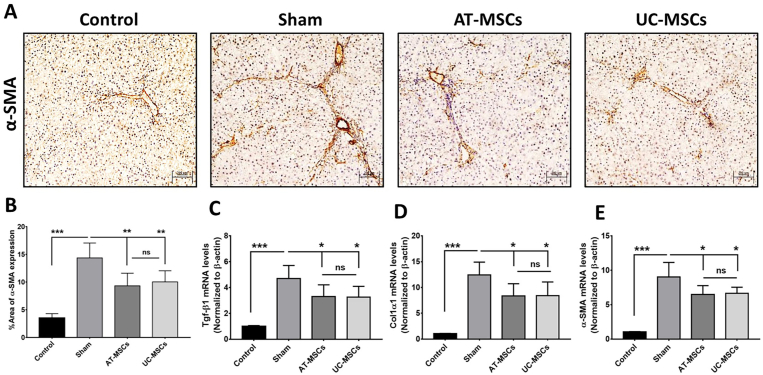
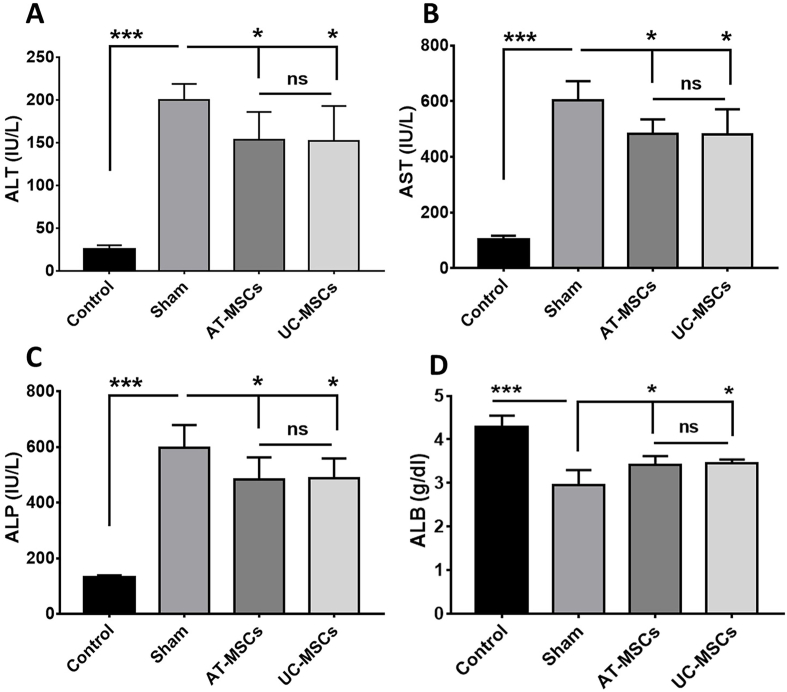
Results: Results from the expansion studies demonstrated that both cell types exhibited bona fide characteristics of MSCs, including surface antigens, pluripotent gene expression, and differentiation potential. However, AT-MSCs demonstrated a shorter doubling time (58.2 ± 7.3 vs. 82.3 ± 4.3 h; P < 0.01) and a higher population doubling level (10.1 ± 0.7 vs. 8.2 ± 0.3; P < 0.01) compared to UC-MSCs, resulting in more cellular yield (230 ± 9.0 vs. 175 ± 13.2 million) in less time. Animal studies demonstrated that both MSC types significantly reduced liver fibrosis (P < 0.05 vs. the control group) while also improving liver function and downregulating fibrosis-associated gene expression.
Conclusion: AT-MSCs and UC-MSCs effectively reduce liver fibrosis. However, adipose cultures display an advantage by yielding a higher number of MSCs in a shorter duration, rendering them a viable choice for scenarios requiring immediate single-dose administration, often encountered in clinical settings.
Keywords: adipose tissue; cellular therapy; liver fibrosis; mesenchymal stem cells; umbilical cord.
© 2024 Indian National Association for Study of the Liver. Published by Elsevier B.V. All rights reserved.
Figures
Similar articles
-
Human Infrapatellar Fat Pad Mesenchymal Stem Cell-derived Extracellular Vesicles Purified by Anion Exchange Chromatography Suppress Osteoarthritis Progression in a Mouse Model.Clin Orthop Relat Res. 2024 Jul 1;482(7):1246-1262. doi: 10.1097/CORR.0000000000003067. Epub 2024 Apr 19. Clin Orthop Relat Res. 2024. PMID: 38662932 Free PMC article.
-
Overexpression of Decorin Optimizes the Treatment Efficacy of Umbilical Cord Mesenchymal Stem Cells in Bleomycin-Induced Pulmonary Fibrosis in Rats.Stem Cells Int. 2025 May 21;2025:6324980. doi: 10.1155/sci/6324980. eCollection 2025. Stem Cells Int. 2025. PMID: 40438789 Free PMC article.
-
Decadal analysis of efficacy and safety profiles of mesenchymal stem cells from varied sources in knee osteoarthritis patients: A systematic review and network meta-analysis.Exp Gerontol. 2024 Jul;192:112460. doi: 10.1016/j.exger.2024.112460. Epub 2024 May 20. Exp Gerontol. 2024. PMID: 38772192
-
Injection of human umbilical cord mesenchymal stem cells exosomes for the treatment of knee osteoarthritis: from preclinical to clinical research.J Transl Med. 2025 Jun 11;23(1):641. doi: 10.1186/s12967-025-06623-y. J Transl Med. 2025. PMID: 40500748 Free PMC article. Clinical Trial.
-
Interventions for the eradication of meticillin-resistant Staphylococcus aureus (MRSA) in people with cystic fibrosis.Cochrane Database Syst Rev. 2022 Dec 13;12(12):CD009650. doi: 10.1002/14651858.CD009650.pub5. Cochrane Database Syst Rev. 2022. PMID: 36511181 Free PMC article.
Cited by
-
Regulation of the Nrf2/HO-1 axis by mesenchymal stem cells-derived extracellular vesicles: implications for disease treatment.Front Cell Dev Biol. 2024 Jun 10;12:1397954. doi: 10.3389/fcell.2024.1397954. eCollection 2024. Front Cell Dev Biol. 2024. PMID: 38915448 Free PMC article. Review.
-
From laboratory to clinic: a precise treatment strategy of mesenchymal stem cells-derived exosomes pretreated by simulating disease microenvironment.Front Immunol. 2025 Jul 17;16:1609288. doi: 10.3389/fimmu.2025.1609288. eCollection 2025. Front Immunol. 2025. PMID: 40746527 Free PMC article. Review.
-
Human umbilical cord-derived mesenchymal stem cells attenuate hepatic stellate cells activation and liver fibrosis.Mol Biol Rep. 2024 Jun 14;51(1):734. doi: 10.1007/s11033-024-09664-6. Mol Biol Rep. 2024. PMID: 38874773 Free PMC article.
References
-
- Pouyanfard S., Meshgin N., Cruz L.S., et al. Human induced pluripotent stem cell-derived macrophages ameliorate liver fibrosis. Stem Cell. 2021;39:1701–1717. - PubMed
-
- Zhan Y., Wang Y., Wei L., et al., editors. Transplantation Proceedings. Elsevier; 2006. Differentiation of hematopoietic stem cells into hepatocytes in liver fibrosis in rats. - PubMed
LinkOut - more resources
Full Text Sources
Research Materials
