

Air Quality and Health Impacts of Onshore Oil and Gas Flaring and Venting Activities Estimated Using Refined Satellite-Based Emissions
- PMID: 38449816
- PMCID: PMC10916426
- DOI: 10.1029/2023GH000938
Air Quality and Health Impacts of Onshore Oil and Gas Flaring and Venting Activities Estimated Using Refined Satellite-Based Emissions
Abstract
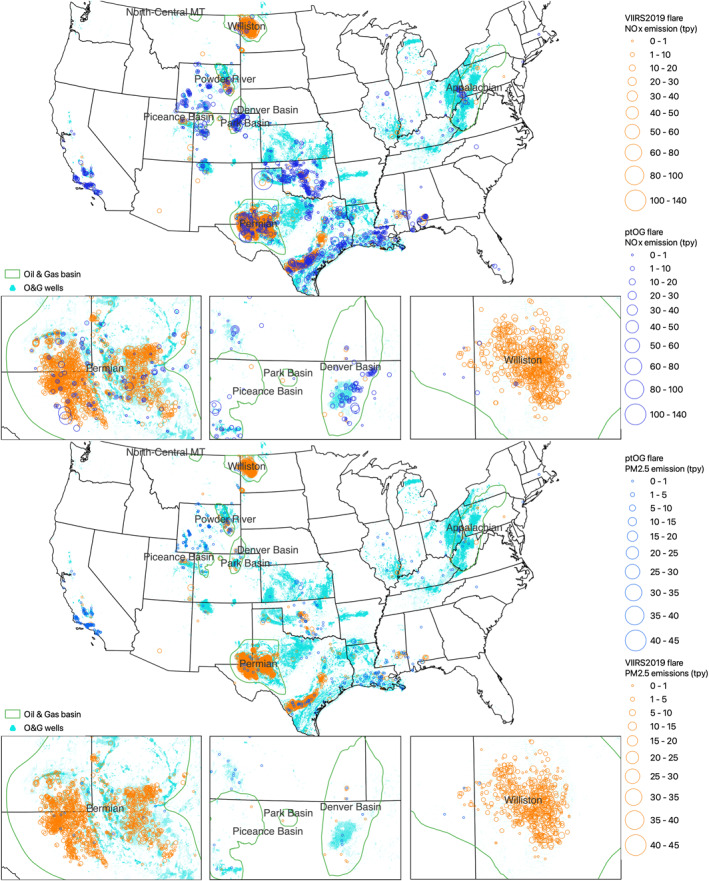
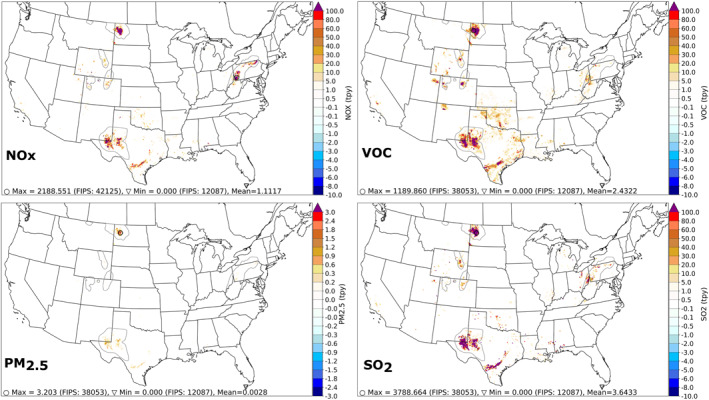
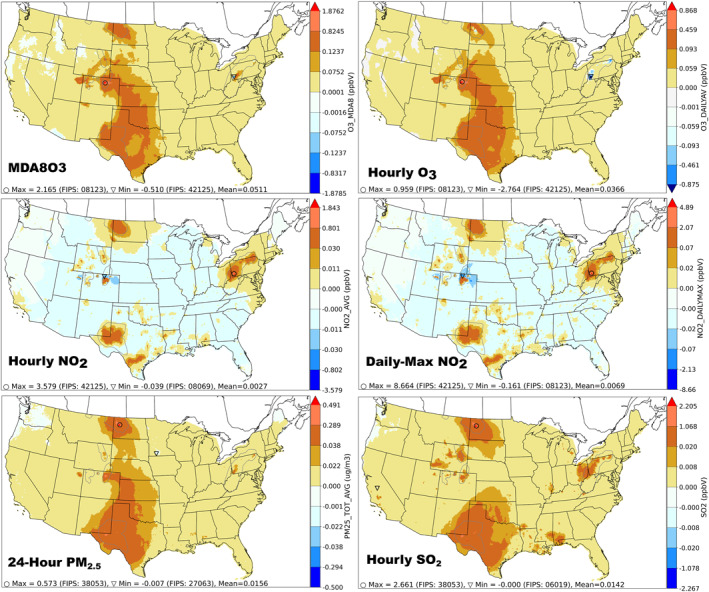
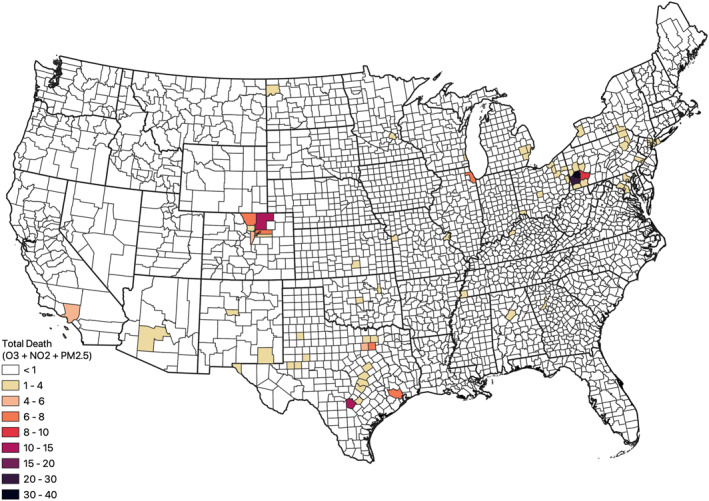
Emissions from flaring and venting (FV) in oil and gas (O&G) production are difficult to quantify due to their intermittent activities and lack of adequate monitoring and reporting. Given their potentially significant contribution to total emissions from the O&G sector in the United States, we estimate emissions from FV using Visible Infrared Imaging Radiometer Suite satellite observations and state/local reported data on flared gas volume. These refined estimates are higher than those reported in the National Emission Inventory: by up to 15 times for fine particulate matter (PM2.5), two times for sulfur dioxides, and 22% higher for nitrogen oxides (NOx). Annual average contributions of FV to ozone (O3), NO2, and PM2.5 in the conterminous U.S. (CONUS) are less than 0.15%, but significant contributions of up to 60% are found in O&G fields with FV. FV contributions are higher in winter than in summer months for O3 and PM2.5; an inverse behavior is found for NO2. Nitrate aerosol contributions to PM2.5 are highest in the Denver basin whereas in the Permian and Bakken basins, sulfate and elemental carbon aerosols are the major contributors. Over four simulated months in 2016 for the entire CONUS, FV contributes 210 additional instances of exceedances to the daily maximum 8-hr average O3 and has negligible contributions to exceedance of NO2 and PM2.5, given the current form of the national ambient air quality standards. FV emissions are found to cause over $7.4 billion in health damages, 710 premature deaths, and 73,000 asthma exacerbations among children annually.
Keywords: VIIRS; air quality; emissions; flaring and venting; health; oil and gas.
© 2024 The Authors. GeoHealth published by Wiley Periodicals LLC on behalf of American Geophysical Union.
Conflict of interest statement
The authors declare no conflicts of interest relevant to this study.
Figures
References
-
- Adakai, M. , Sandoval‐Rosario, M. , Xu, F. , Aseret‐Manygoats, T. , Allison, M. , Greenlund, K. J. , & Barbour, K. E. (2018). Health disparities among American Indians/Alaska natives ‐ Arizona, 2017. MMWR. Morbidity and Mortality Weekly Report, 67(47), 1314–1318. 10.15585/mmwr.mm6747a4 - DOI - PMC - PubMed
-
- Ahmadov, R. , McKeen, S. , Trainer, M. , Banta, R. , Brewer, A. , Brown, S. , et al. (2015). Understanding high wintertime ozone pollution events in an oil‐ and natural gas‐producing region of the western US. Atmospheric Chemistry and Physics, 15(1), 411–429. 10.5194/acp-15-411-2015 - DOI
-
- AHRQ . (2022). Healthcare cost & utilization project (HCUP) user support databases [Dataset]. AHRQ. Retrieved from https://hcup‐us.ahrq.gov/databases.jsp
-
- Allen, D. T. , Smith, D. , Torres, V. M. , & Saldaña, F. C. (2016). Carbon dioxide, methane and black carbon emissions from upstream oil and gas flaring in the United States. Current Opinion in Chemical Engineering, 13, 119–123. 10.1016/j.coche.2016.08.014 - DOI
-
- Anejionu, O. C. D. , Whyatt, J. D. , Blackburn, G. A. , & Price, C. S. (2015). Contributions of gas flaring to a global air pollution hotspot: Spatial and temporal variations, impacts and alleviation. Atmospheric Environment, 118, 184–193. 10.1016/j.atmosenv.2015.08.006 - DOI
References From the Supporting Information
-
- Alhanti, B. A. , Chang, H. H. , Winquist, A. , Mulholland, J. A. , Darrow, L. A. , & Sarnat, S. E. (2016). Ambient air pollution and emergency department visits for asthma: A multi‐city assessment of effect modification by age. Journal of Exposure Science and Environmental Epidemiology, 26(2), 180–188. 10.1038/jes.2015.57 - DOI - PubMed
-
- Appel, K. W. , Bash, J. O. , Fahey, K. M. , Foley, K. M. , Gilliam, R. C. , Hogrefe, C. , et al. (2021). The community multiscale air quality (CMAQ) model versions 5.3 and 5.3.1: System updates and evaluation. Geoscientific Model Development, 14(5), 2867–2897. 10.5194/gmd-14-2867-2021 - DOI - PMC - PubMed
-
- Appel, K. W. , Napelenok, S. L. , Foley, K. M. , Pye, H. O. T. , Hogrefe, C. , Luecken, D. J. , et al. (2017). Description and evaluation of the community multiscale air quality (CMAQ) modeling system version 5.1. Geoscientific Model Development, 10(4), 1703–1732. 10.5194/gmd-10-1703-2017 - DOI - PMC - PubMed
-
- API . (2014). API Standard 521 (No. C52106, 6th ed.) (p. 248). American Petroleum Institute (API).
LinkOut - more resources
Full Text Sources