. 2024 Feb 21:15:1324868.
doi: 10.3389/fneur.2024.1324868. eCollection 2024.

Postural impairments in unilateral and bilateral vestibulopathy

Affiliations

Postural impairments in unilateral and bilateral vestibulopathy

Julie Corre et al. Front Neurol. .

Abstract

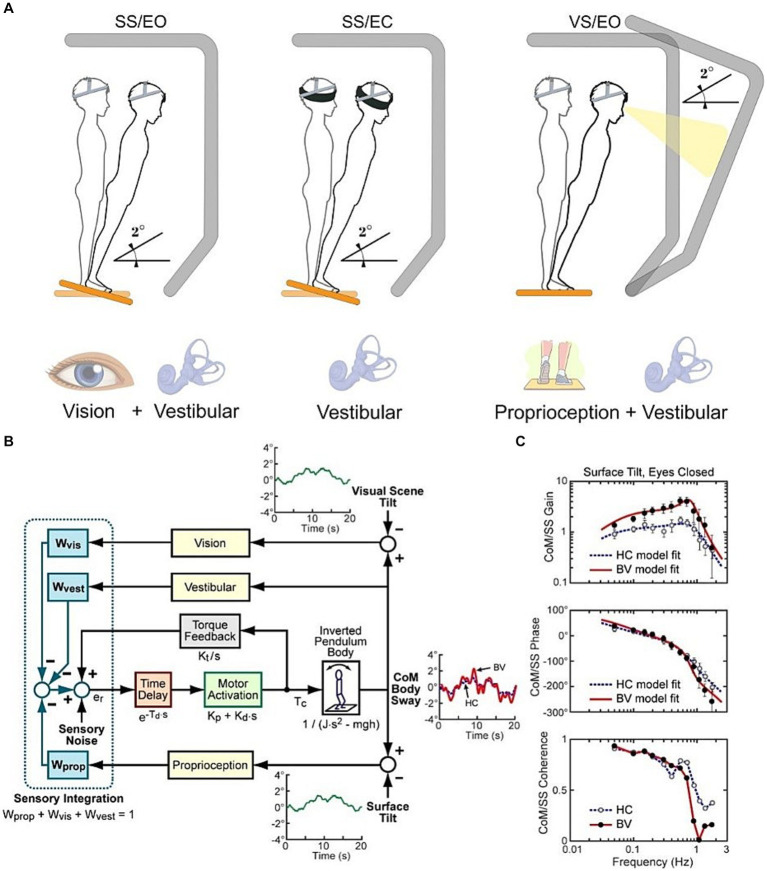
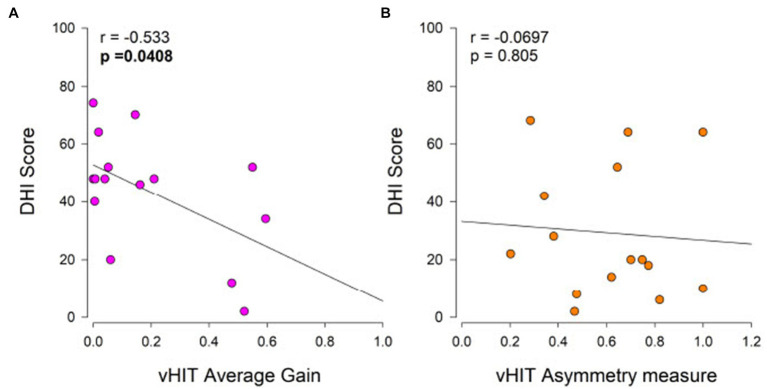
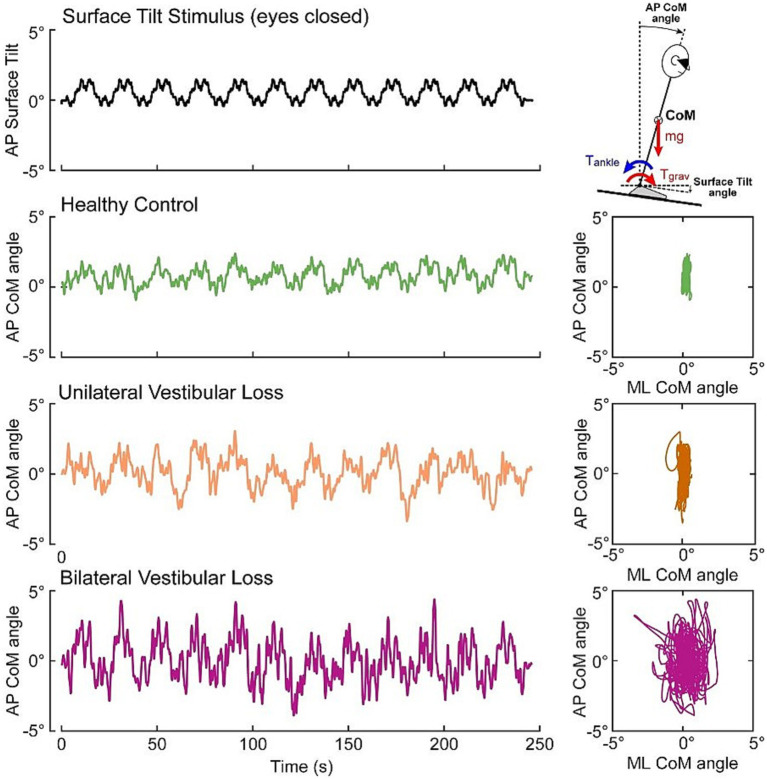
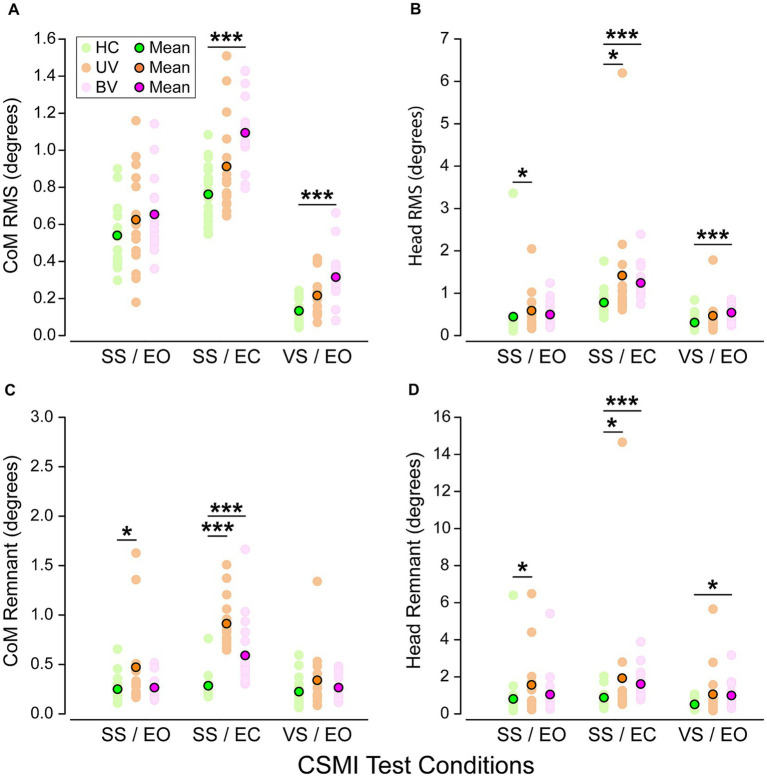
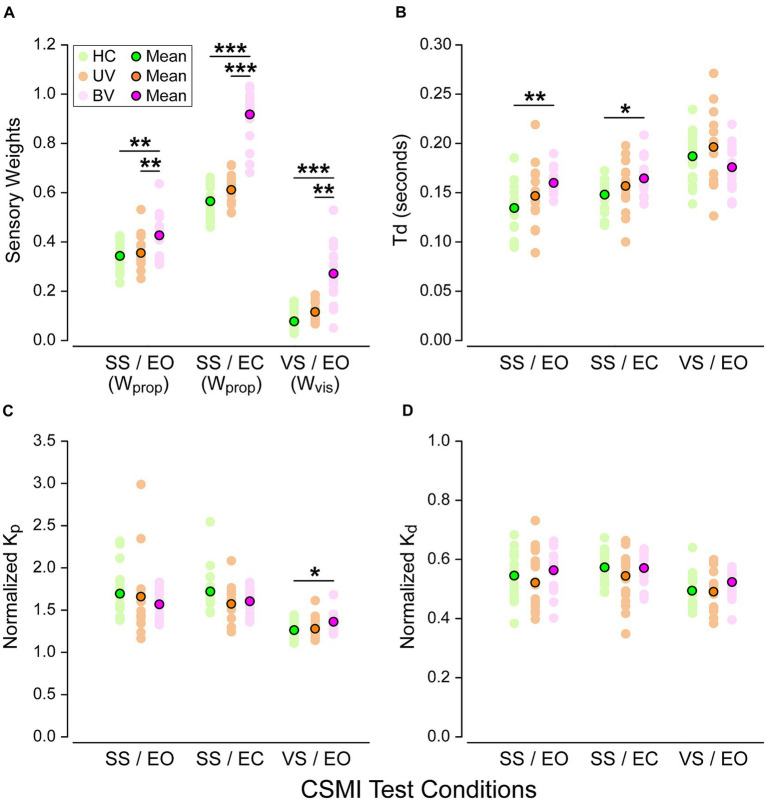
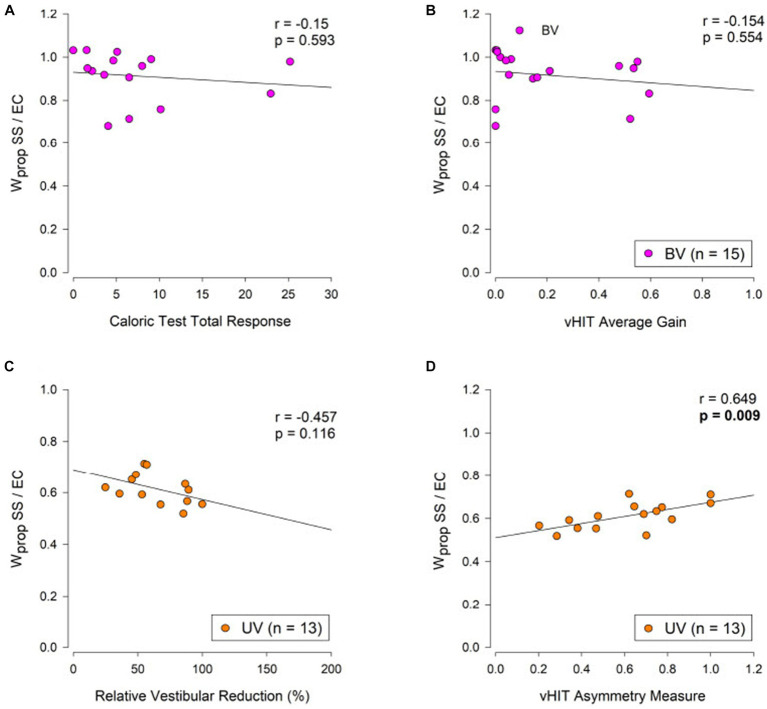
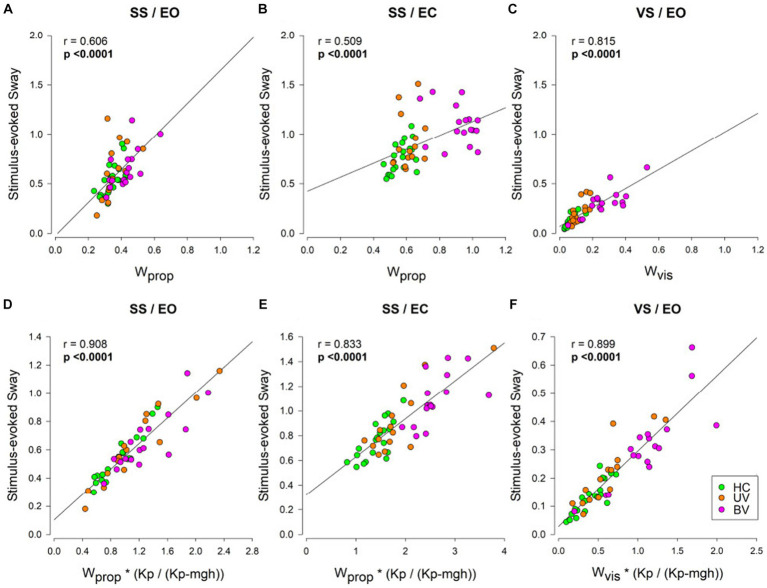
Chronic imbalance is a major complaint of patients suffering from bilateral vestibulopathy (BV) and is often reported by patients with chronic unilateral vestibulopathy (UV), leading to increased risk of falling. We used the Central SensoriMotor Integration (CSMI) test, which evaluates sensory integration, time delay, and motor activation contributions to standing balance control, to determine whether CSMI measures could distinguish between healthy control (HC), UV, and BV subjects and to characterize vestibular, proprioceptive, and visual contributions expressed as sensory weights. We also hypothesized that sensory weight values would be associated with the results of vestibular assessments (vestibulo ocular reflex tests and Dizziness Handicap Inventory scores). Twenty HCs, 15 UVs and 17 BVs performed three CSMI conditions evoking sway in response to pseudorandom (1) surface tilts with eyes open or, (2) surface tilts with eyes closed, and (3) visual surround tilts. Proprioceptive weights were identified in surface tilt conditions and visual weights were identified in the visual tilt condition. BVs relied significantly more on proprioception. There was no overlap in proprioceptive weights between BV and HC subjects and minimal overlap between UV and BV subjects in the eyes-closed surface-tilt condition. Additionally, visual sensory weights were greater in BVs and were similarly able to distinguish BV from HC and UV subjects. We found no significant correlations between sensory weights and the results of vestibular assessments. Sensory weights from CSMI testing could provide a useful measure for diagnosing and for objectively evaluating the effectiveness of rehabilitation efforts and future treatments designed to restore vestibular function such as hair cell regeneration and vestibular implants.

Keywords: balance; bilateral vestibulopathy; posturography; sensory integration; unilateral vestibulopathy; vestibular.


Conflict of interest statement

The authors declare that the research was conducted in the absence of any commercial or financial relationships that could be construed as a potential conflict of interest.

Figures

Figure 1
Figure 1
(A) Schematic representation of the Central Sensorimotor Integration (CSMI) test conditions. (B) Block diagram of CSMI feedback control model of the balance system. Each sensory system contributing to balance is represented by a “sensory weight” (W) with each weight representing the relative contribution of a sensory system to a central estimate of body motion such that the sum of all sensory weights is equal to 1.0. This central estimate in turn generates a corrective ankle torque (Tc). The model parameter values are estimated by first applying Fourier methods to calculate a Frequency Response Function (C) and then adjusting model parameters to optimally account for the experimental Frequency Response Function. Two example Frequency Response Functions are shown for an HC and BV subject.
Figure 2
Figure 2
Relationship of Dizziness Handicap Inventory (DHI) to vHIT average gain in BV subjects (A) and to vHIT lateral canal asymmetry in UV subjects (B). Self-perceived handicap is considered moderate for DHI scores between 30 and 60, and severe for DHI scores above 60. The Pearson product–moment correlation coefficient (r) and associated p-values are shown.
Figure 3
Figure 3
Example data from an eyes closed CSMI surface tilt stimulus (black trace) evoking center of mass (CoM) sway in an individual HC subject (green trace), a UV subject (orange trace), and a BV subject (purple trace). Right panels display anterior–posterior (AP) sway in relation to the medial-lateral (ML) sway.
Figure 4
Figure 4
Scatter plots of root mean square (RMS) values of (A) stimulus-evoked Center of Mass (CoM) sway, (B) stimulus-evoked head sway, (C) remnant CoM sway, and (D) remnant head sway in healthy controls (HC, green), unilateral vestibular loss (UV, orange) and bilateral vestibular loss (BV, purple) groups and for the three CSMI test conditions. Pastel dots represent individual subject values while bright ones are group mean values. Stars and black horizontal lines indicate significant differences between groups (*p < 0.05, **p < 0.01, ***p < 0.001).
Figure 5
Figure 5
Balance control model parameters across the three CSMI testing conditions in healthy controls (HC, green), unilateral vestibulopathy (UV, orange) and bilateral vestibulopathy (BV, purple) groups. Plots display (A) sensory weights (Wprop or Wvis depending on the test condition), (B) time delays Td, (C) normalized Kp, and (D) normalized Kd. Stars and black horizontal lines indicate significant differences between groups (*p < 0.05, **p < 0.01, ***p < 0.001).
Figure 6
Figure 6
Relation of caloric test and vHIT measures to proprioceptive sensory weight measures from the eyes-closed surface tilt (SS/EC) condition in bilateral vestibulopathy (BV, purple points, A,B) and unilateral vestibulopathy (UV, orange points, C,D) subjects. The Pearson product–moment correlation coefficient (r) and corresponding p-values are shown.
Figure 7
Figure 7
CSMI parameters accounting for the variation in RMS values of stimulus-evoked sway. CoM sway measure versus sensory weight values across the three testing conditions in healthy controls (HC, green), unilateral vestibulopathy (UV, orange), and bilateral vestibulopathy (BV, purple) groups. In panels (A–C) stimulus-evoked sway measures are plotted against the CSMI sensory weight parameters, while in Panel (D–F) stimulus-evoked sway measures are plotted against the product of the sensory weight parameters and the stiffness-related sway amplification factor Kp/(Kp – mgh). Panels (A,D) show Wprop for the SS/EO condition, panels (B,E) show Wprop for the SS/EC condition, and panels (C,F) show Wvis for the VS/EO condition. The Pearson product–moment correlation coefficient (r) are show with associated p-values. Bold p-values indicate statistically significant correlations.

References

    1. Goldberg JM, Cullen KE. Vestibular control of the head: possible functions of the vestibulocollic reflex. Exp Brain Res. (2011) 210:331–45. doi: 10.1007/s00221-011-2611-5, PMID: - DOI - PMC - PubMed
    1. Cullen KE. The vestibular system: multimodal integration and encoding of self-motion for motor control. Trends Neurosci. (2012) 35:185–96. doi: 10.1016/j.tins.2011.12.001, PMID: - DOI - PMC - PubMed
    1. Cullen KE. Chapter 2 - Physiology of central pathways In: Furman JM, Lempert T, editors. Handbook of Clinical Neurology: Elsevier, Amsterdam: (2016). 17–40. - PubMed
    1. Prieto TE, Myklebust JB, Hoffmann RG, Lovett EG, Myklebust BM. Measures of postural steadiness: differences between healthy young and elderly adults. IEEE Trans Biomed Eng. (1996) 43:956–66. doi: 10.1109/10.532130, PMID: - DOI - PubMed
    1. Pasma JH, Engelhart D, Schouten AC, van der Kooij H, Maier AB, Meskers CGM. Impaired standing balance: the clinical need for closing the loop. Neuroscience. (2014) 267:157–65. doi: 10.1016/j.neuroscience.2014.02.030, PMID: - DOI - PubMed

LinkOut - more resources