. 2024 Feb 17;27(3):109265.
doi: 10.1016/j.isci.2024.109265. eCollection 2024 Mar 15.

Pseudouridine synthase 1 regulates erythropoiesis via transfer RNAs pseudouridylation and cytoplasmic translation

Affiliations

Pseudouridine synthase 1 regulates erythropoiesis via transfer RNAs pseudouridylation and cytoplasmic translation

Deyang Shi et al. iScience. .

Abstract

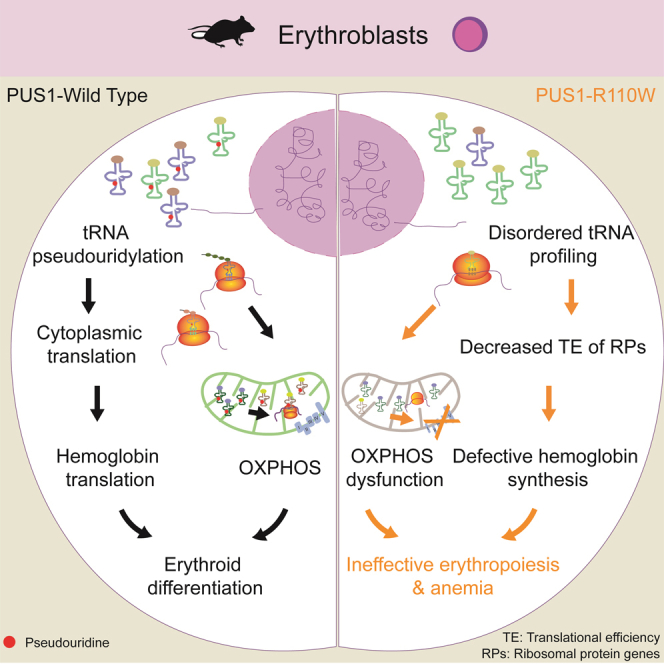
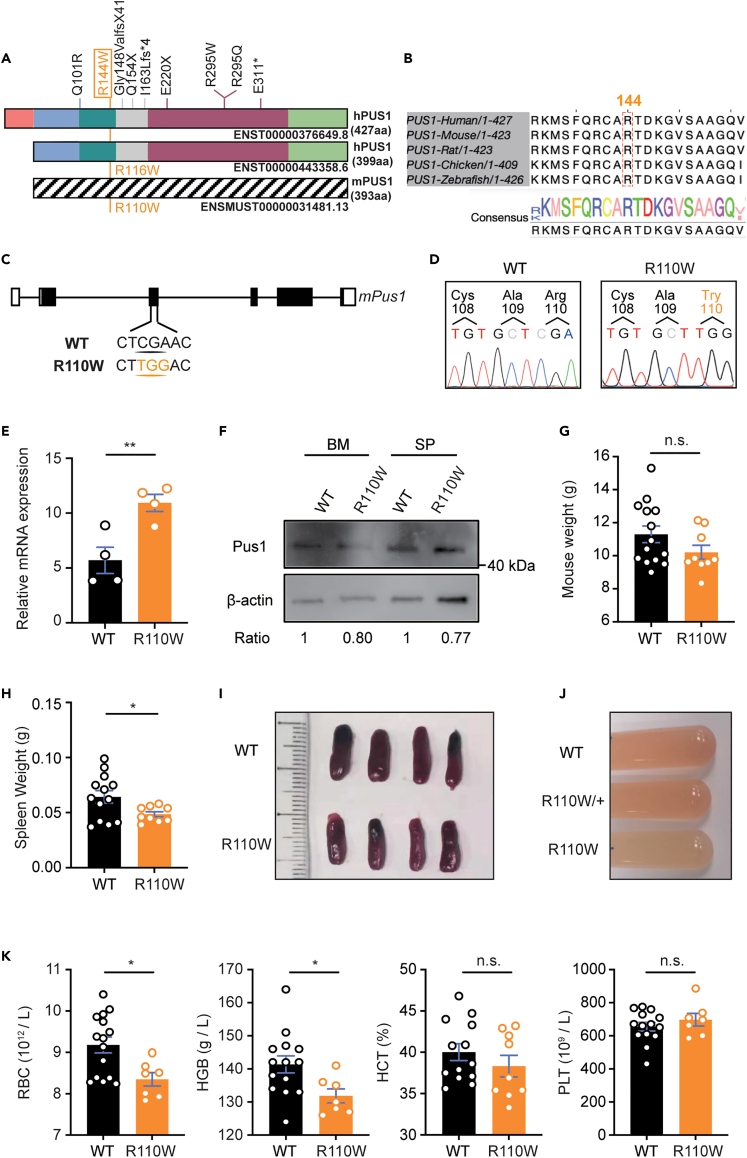
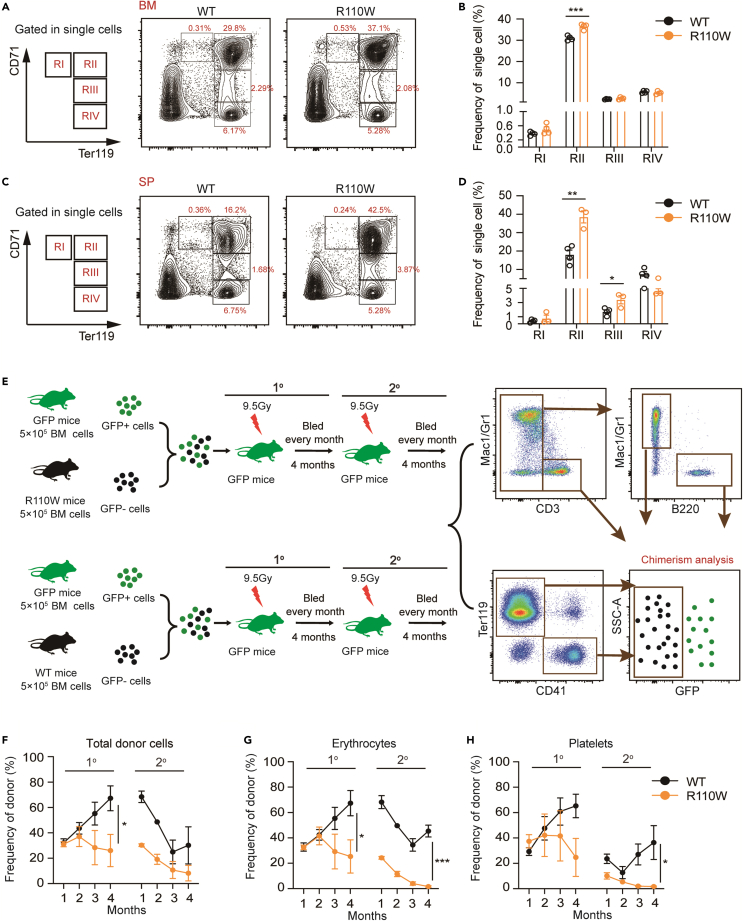
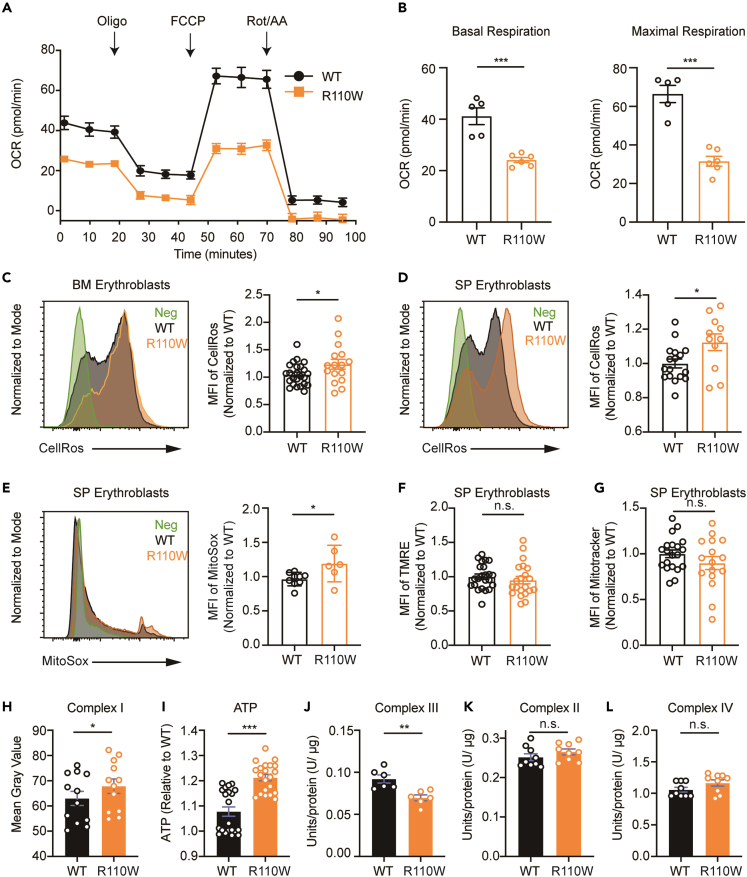
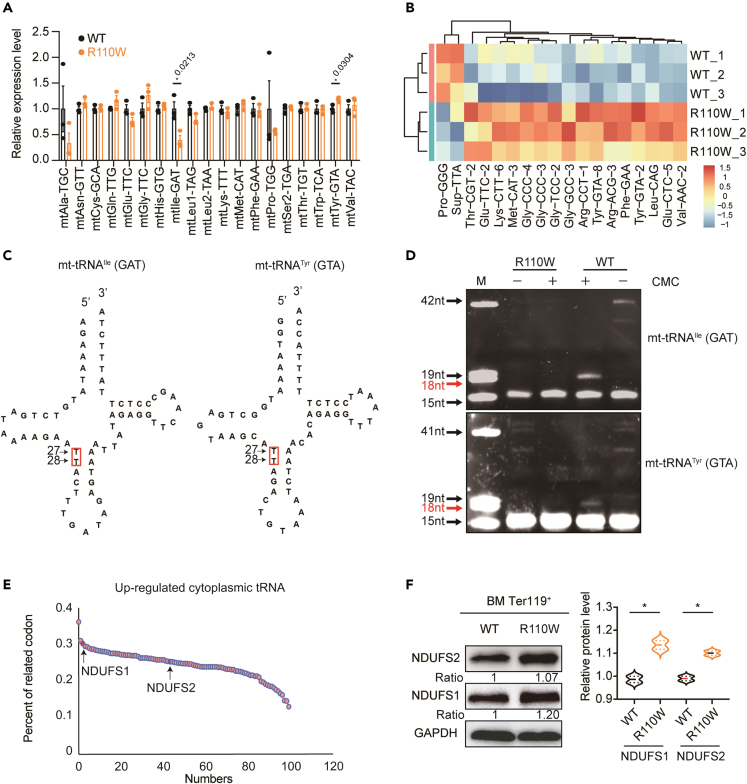
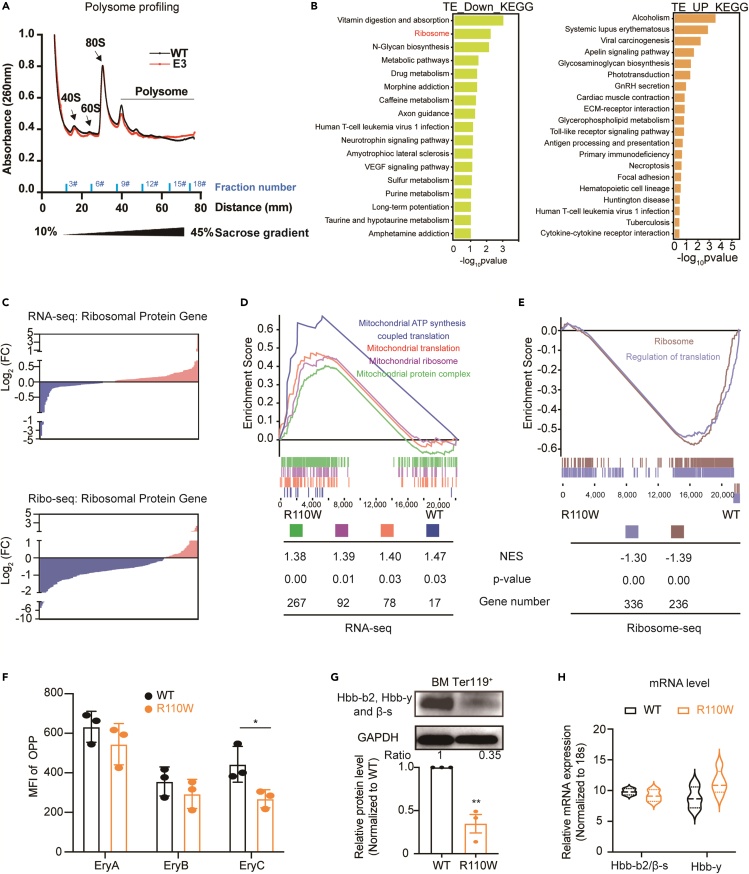
Pseudouridylation plays a regulatory role in various physiological and pathological processes. A prime example is the mitochondrial myopathy, lactic acidosis, and sideroblastic anemia syndrome (MLASA), characterized by defective pseudouridylation resulting from genetic mutations in pseudouridine synthase 1 (PUS1). However, the roles and mechanisms of pseudouridylation in normal erythropoiesis and MLASA-related anemia remain elusive. We established a mouse model carrying a point mutation (R110W) in the enzymatic domain of PUS1, mimicking the common mutation in human MLASA. Pus1-mutant mice exhibited anemia at 4 weeks old. Impaired mitochondrial oxidative phosphorylation was also observed in mutant erythroblasts. Mechanistically, mutant erythroblasts showed defective pseudouridylation of targeted tRNAs, altered tRNA profiles, decreased translation efficiency of ribosomal protein genes, and reduced globin synthesis, culminating in ineffective erythropoiesis. Our study thus provided direct evidence that pseudouridylation participates in erythropoiesis in vivo. We demonstrated the critical role of pseudouridylation in regulating tRNA homeostasis, cytoplasmic translation, and erythropoiesis.

Keywords: Cell biology; Molecular biology.


Conflict of interest statement

The authors declare no competing interests.

Figures

None
Graphical abstract
Figure 1
Figure 1
R110W mice developed anemia at 4 weeks old (A) Illustration of the two human PUS1 isoforms and the mutations reported in patients with MLASA. The hPUS1-427aa contains a mitochondrial targeting signal and is localized within mitochondria, while the hPUS1-399aa isoform lacks a mitochondrial targeting signal and is localized in the nucleus. The mutation R144W in hPUS1-427aa corresponds to R116W in hPUS1-399aa and R110W in mPUS1. (B) The amino acid Arginine 144 (144R) in the enzymatic region of PUS1 is highly conserved across vertebrates. The alignment was performed using T-Coffee (https://tcoffee.crg.eu). (C) Construction strategy of R110W mice using CRISPR-Cas9 technology with CGA replaced with TGG. (D) Confirmation of the Pus1 mutation by the Sanger sequence of mouse genomic DNA. The location of this mutation is denoted in orange text. Primers used are listed in Table S1. (E) Relative expression of Pus1 in whole BM cells of R110W mice and WT littermates normalized to 18s; n = 4. (F) The protein level of mutant Pus1 in the bone marrow (BM) and spleen of mutant and wild-type (WT) littermates was analyzed by Western blotting. The ratio represents the fold change in expression between the two groups as measured by densitometric analysis. (G) Body weights of the WT and R110W male mice at 4 weeks old (n = 14 for WT; n = 9 for R110W). (H) Spleen weights of the WT and R110W male mice at 4 weeks old (n = 13 for WT; n = 9 for R110W). (I) Representative images of the spleen in the WT and R110W male mice (n = 4). (J) Representative images of BM cells flushed from WT littermates, heterozygous and homozygous mice of R110W. (K) Complete blood count analysis of peripheral blood from 4-week-old R110W and WT male mice (n = 15 for WT; n = 7 for R110W). RBC, Red blood cells; HGB, Hemoglobin; HCT, Hematocrit; PLT, Platelets. Data are represented as Mean ± SEM; ∗p < 0.05, ∗∗p < 0.01, ∗∗∗p < 0.001. See also Figure S1.
Figure 2
Figure 2
Mutation of Pus1 impaired erythroid lineage cell commitment and differentiation in mice (A) Flow cytometric gating strategy of erythroblasts in BM by CD71 and Ter119 staining. Region I (CD71highTer119intermediate) represents proerythroblasts, region II (CD71highTer119+) are basophilic erythroblasts, region III (CD71intermediateTer119+) reflects late basophilic and chromatophilic erythroblasts and region IV (CD71-Ter119+) are orthochromatophilic erythroblasts.. (B) The proportion of erythroblasts in BM at different stages during terminal erythropoiesis (n = 4, male mice). (C) Flow cytometric gating strategy of erythroblasts in the spleen. (D) The proportion of erythroblasts in the spleen at different stages during terminal erythropoiesis. (n = 4, male mice). (E) Schematic diagram for competitive serial transplantation assay. 5×10⁵ BM cells from R110W or control mice, together with 5×10⁵ BM cells from actin-EGFP mice as protective cells, were transplanted into lethally irradiated actin-EGFP mice to evaluate the intrinsic regulation of PUS1 on hematopoiesis. Secondary transplantation was performed 4 months later. (F) The total frequencies of donor cells derived erythrocytes (Ter119+) and platelets (CD41+) in the PB of recipient male mice at indicated time point during primary and secondary transplantation (n = 4). (G‒H) The frequencies of donor cells derived mature erythrocytes (Ter119+) (G) and platelets (CD41+) (H) in the PB of recipient male mice during primary and secondary transplantation (n = 4). Data are represented as Mean ± SEM; ∗p < 0.05, ∗∗p < 0.01, ∗∗∗p < 0.001. See also Figures S1–S4.
Figure 3
Figure 3
Pus1 mutation resulted in mitochondrial respiratory chain dysfunction (A) Mitochondrial respiration in R110W and control BM erythroblasts measured by cellular OCR at baseline and after various inhibitors treatment. The OCR prior to the addition of oligomycin represents basal respiration. Mitochondrial ATP synthesis, proton translocation, and O2 uptake were measured after the addition of oligomycin (Oligo). Addition of carbonyl cyanide-4 (trifluoromethoxy) phenylhydrazone (FCCP) defines maximal respiratory capacity, while rotenone plus antimycin A (Rot/AA) describes spare respiratory capacity (n = 6, male mice). (B) OCR of basal respiration (left) and maximal respiratory capacity (right) from (A) (n = 6, male mice). (C and D) Mean fluorescence intensity (MFI) peak (left) and values (right) of CellROS in BM (C) or SP (D) erythroblasts between WT and mutant male mice (n = 17–24 for WT; n = 11–17 for R110W). (E) MFI peak (left) and values (right) of MitoSox in spleen erythroblasts between WT and mutant male mice (n = 9 for WT; n = 6 for R110W). (F‒G) MFI values of TMRE (F) and mitotracker (G) in spleen erythroblasts between WT and mutant male mice (n = 20–24 for WT; n = 16–20 for R110W). (H) Complex I activity of BM cells in the two groups, see the detailed protocol in the STAR methods (n = 12, male mice). (I) ATP level of BM cells in the two groups, see the detailed protocol in the STAR methods (n = 6, each sample includes three or four replicates, male mice). (J) Complex III activity of spleen cells in the two groups, see the detailed protocol in the STAR methods (n = 6, male mice). (K‒L) Complex II (K) and complex IV (L) activity of BM cells in the two groups, see the detailed protocol in the STAR methods (n = 3, each sample includes three replicates, male mice). Data are represented as Mean ± SEM; ∗p < 0.05, ∗∗p < 0.01, ∗∗∗p < 0.001. See also Figure S4.
Figure 4
Figure 4
Pus1-mutant mice presented defective pseudouridylation of targeted tRNAs (A) Expression levels of mitochondrial tRNA in BM erythroblasts of the two groups, all of the detected mitochondrial tRNAs were listed in the panel. (n = 3, female mice). (B) Heatmap showing the expression level of cytoplasmic tRNAs with significant differences between the two groups (n = 3, female mice). (C) Sequences and secondary structures of the mitochondrial tRNA with differential expression in R110W BM erythroblasts. Red boxes indicate putative Pus1 target sites that we examined by the CMC primer extension assay. (D) CMC primer extension assay of mitochondrial tRNAIle (GAT) and tRNATyr (GTA). M, marker, a pool of indicated length of RNAs. Red arrows indicate sites that contain pseudouridine modifications in WT but are not found in the R110W cells. The detailed sequences used are shown in the supplementary materials. (E) Nuclear-encoded mitochondrial OXPHOS genes ranked by the frequencies containing codons of the up-regulated cytosolic tRNAs in R110W cells. The arrows indicate the ranking of NDUFS1 and NDUFS2, respectively. (F) Expression changes of nuclear-encoded mitochondrial respiratory chain-related proteins in R110W BM erythroblasts by Western blotting. Data are represented as Mean ± SEM; ∗p < 0.05, ∗∗p < 0.01, ∗∗∗p < 0.001. See also Figure S5 and Table S2.
Figure 5
Figure 5
BM erythroblasts of Pus1-mutant mice showed decreased translation efficiency of ribosomal protein (A) Polysome profiles were performed by fractionation on a 10 to 45% sucrose gradient. Fractions were collected and corresponding tube numbers were indicated, and the optical density at 260 nm (A260) was measured. The positions of the 40S and 60S native subunits and the 80S monosomes are indicated (n = 3, female mice). (B) KEGG enrichment analysis of down-regulated translational efficiency genes (log2FC < −1, p < 0.05, left) and up-regulated translational efficiency genes (log2FC > 1, p < 0.05, right). (C) RNA expression changes of ribosomal protein genes by RNA-seq (upper) and translational expression changes of ribosomal protein gene by Ribo-seq (bottom). Blue, downregulated genes; Pink, upregulated genes. Related genes are listed in Table S4. (D) GSEA performed on all genes detected by RNA-seq. NES: normalized enrichment score. (E) GSEA performed on all genes detected by Ribo-seq. NES: normalized enrichment score. (F) MFI values of OPP incorporation in BM erythroblasts (n = 3, female mice). The gating strategy is shown in Figure S7B. (G) Expression of Hbb-b2, Hbb-y, and β-s protein in BM erythroblasts (upper) by Western blotting and quantification (bottom). (H) Relative mRNA level of Hbb-b2/β-s and Hbb-y (n = 3). Primers used are listed in Table S1. Data are represented as Mean ± SEM; ∗p < 0.05, ∗∗p < 0.01, ∗∗∗p < 0.001. See also Figures S6 and S7.
Figure 6
Figure 6
Inhibition of the mitochondrial electron transport chain and cytoplasmic translation exerted inhibitory effects on erythropoiesis (A) Strategy of in vitro erythropoiesis differentiation. (B) Quantification of erythroid cells that were differentiated from sorted Lin- cells of WT mice with erythropoiesis differentiation culture medium in the presence or absence of antimycin A. Inhibitors were both incubated with cells for 48 h, and then the drugs were withdrawn. (C and D) Quantification of erythroid cells that were differentiated from Lin- cells of WT mice cultured in liquid medium in the presence or absence of cycloheximide (C) or doxycycline (D), inhibitors both incubate with cells for 48 h. (E) Quantification of live cells or Ter119+ erythroid cells at day 6 after differentiation by the treatment with doxycycline for 2 days or 6 days. Data are represented as Mean ± SEM; ∗p < 0.05, ∗∗p < 0.01, ∗∗∗p < 0.001. See also Figures S8 and S9.

Similar articles

Cited by

  • Mitochondrial diseases: from molecular mechanisms to therapeutic advances.
    Wen H, Deng H, Li B, Chen J, Zhu J, Zhang X, Yoshida S, Zhou Y. Wen H, et al. Signal Transduct Target Ther. 2025 Jan 10;10(1):9. doi: 10.1038/s41392-024-02044-3. Signal Transduct Target Ther. 2025. PMID: 39788934 Free PMC article. Review.
  • Functions and therapeutic applications of pseudouridylation.
    Luo N, Huang Q, Zhang M, Yi C. Luo N, et al. Nat Rev Mol Cell Biol. 2025 May 20. doi: 10.1038/s41580-025-00852-1. Online ahead of print. Nat Rev Mol Cell Biol. 2025. PMID: 40394244 Review.
  • RNA modifications in cancer.
    Wu H, Chen S, Li X, Li Y, Shi H, Qing Y, Shi B, Tang Y, Yan Z, Hao Y, Wang D, Liu W. Wu H, et al. MedComm (2020). 2025 Jan 10;6(1):e70042. doi: 10.1002/mco2.70042. eCollection 2025 Jan. MedComm (2020). 2025. PMID: 39802639 Free PMC article. Review.

References

    1. Cohn W.E. Pseudouridine, a carbon-carbon linked ribonucleoside in ribonucleic acids: isolation, structure, and chemical characteristics. J. Biol. Chem. 1960;235:1488–1498. - PubMed
    1. Machnicka M.A., Milanowska K., Osman Oglou O., Purta E., Kurkowska M., Olchowik A., Januszewski W., Kalinowski S., Dunin-Horkawicz S., Rother K.M., et al. MODOMICS: a database of RNA modification pathways--2013 update. Nucleic Acids Res. 2013;41:D262–D267. doi: 10.1093/nar/gks1007. - DOI - PMC - PubMed
    1. Song J., Zhuang Y., Zhu C., Meng H., Lu B., Xie B., Peng J., Li M., Yi C. Differential roles of human PUS10 in miRNA processing and tRNA pseudouridylation. Nat. Chem. Biol. 2020;16:160–169. doi: 10.1038/s41589-019-0420-5. - DOI - PubMed
    1. Guzzi N., Muthukumar S., Cieśla M., Todisco G., Ngoc P.C.T., Madej M., Munita R., Fazio S., Ekström S., Mortera-Blanco T., et al. Pseudouridine-modified tRNA fragments repress aberrant protein synthesis and predict leukaemic progression in myelodysplastic syndrome. Nat. Cell Biol. 2022;24:299–306. doi: 10.1038/s41556-022-00852-9. - DOI - PMC - PubMed
    1. Guzzi N., Cieśla M., Ngoc P.C.T., Lang S., Arora S., Dimitriou M., Pimková K., Sommarin M.N.E., Munita R., Lubas M., et al. Pseudouridylation of tRNA-Derived Fragments Steers Translational Control in Stem Cells. Cell. 2018;173:1204–1216.e26. doi: 10.1016/j.cell.2018.03.008. - DOI - PubMed

LinkOut - more resources