

Metabolomics analysis reveals novel serum metabolite alterations in cancer cachexia
- PMID: 38450189
- PMCID: PMC10915872
- DOI: 10.3389/fonc.2024.1286896
Metabolomics analysis reveals novel serum metabolite alterations in cancer cachexia
Abstract
Background: Cachexia is a body wasting syndrome that significantly affects well-being and prognosis of cancer patients, without effective treatment. Serum metabolites take part in pathophysiological processes of cancer cachexia, but apart from altered levels of select serum metabolites, little is known on the global changes of the overall serum metabolome, which represents a functional readout of the whole-body metabolic state. Here, we aimed to comprehensively characterize serum metabolite alterations and analyze associated pathways in cachectic cancer patients to gain new insights that could help instruct strategies for novel interventions of greater clinical benefit.
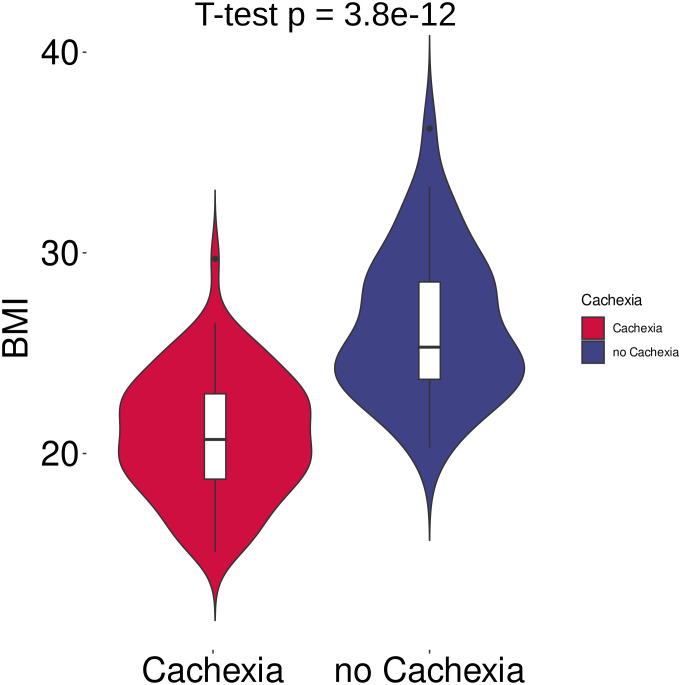
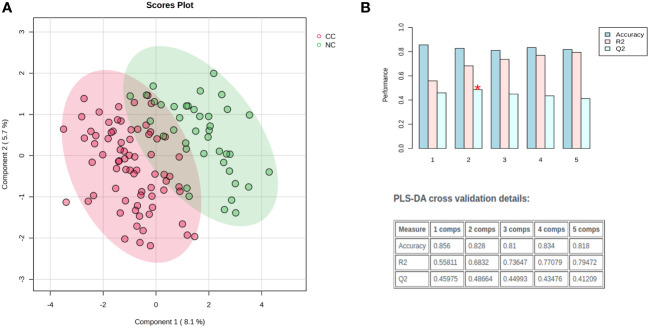
Methods: Serum was sampled from 120 metastatic cancer patients (stage UICC IV). Patients were grouped as cachectic or non-cachectic according to the criteria for cancer cachexia agreed upon international consensus (main criterium: weight loss adjusted to body mass index). Samples were pooled by cachexia phenotype and assayed using non-targeted gas chromatography-mass spectrometry (GC-MS). Normalized metabolite levels were compared using t-test (p < 0.05, adjusted for false discovery rate) and partial least squares discriminant analysis (PLS-DA). Machine-learning models were applied to identify metabolite signatures for separating cachexia states. Significant metabolites underwent MetaboAnalyst 5.0 pathway analysis.
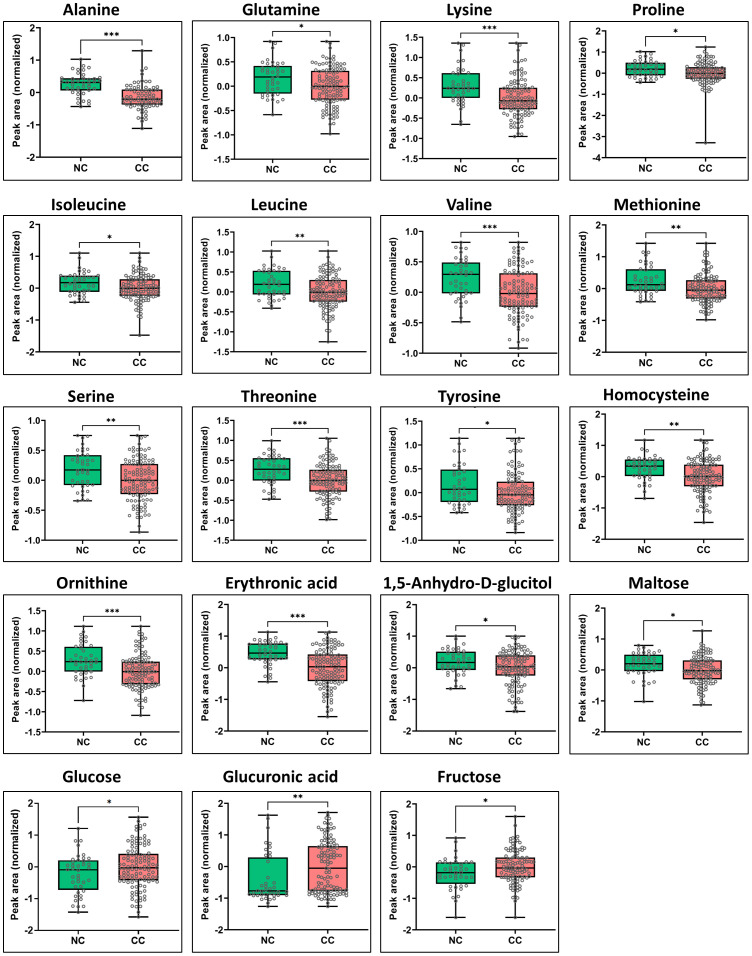
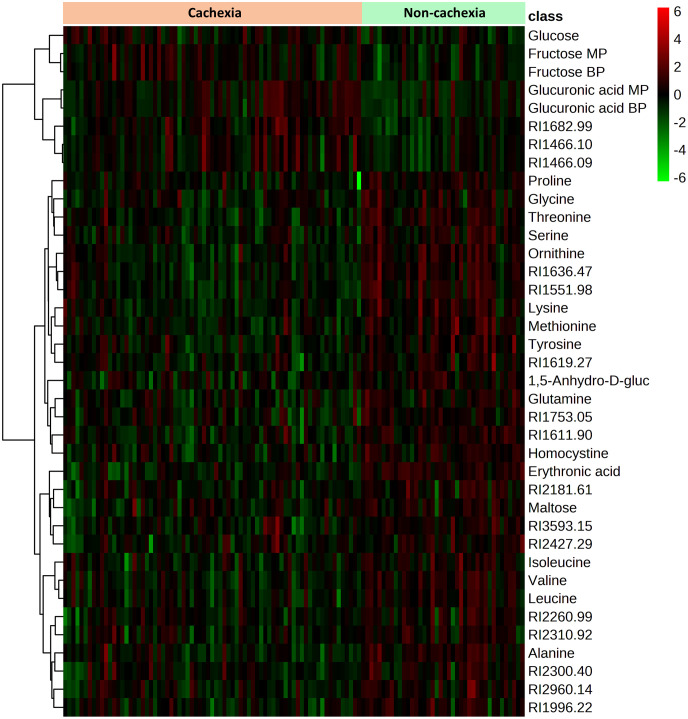
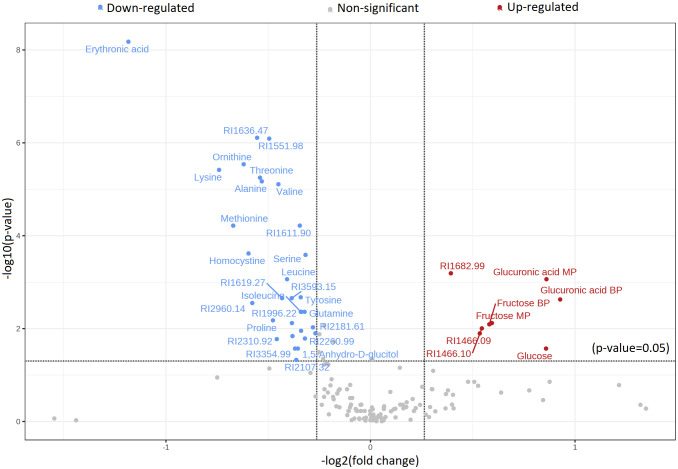
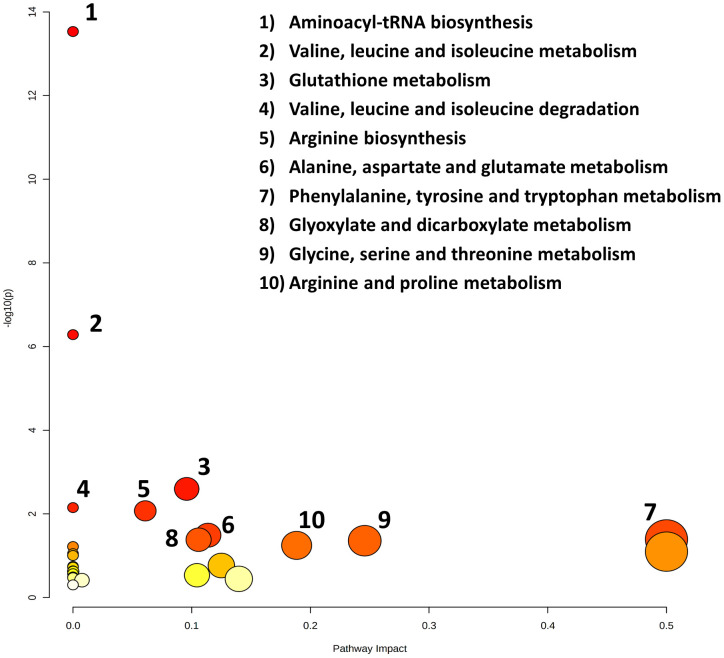
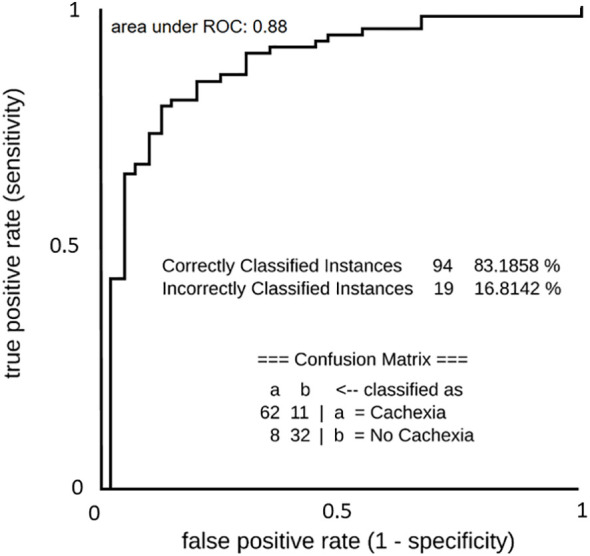
Results: Comparative analyses included 78 cachectic and 42 non-cachectic patients. Cachectic patients exhibited 19 annotable, significantly elevated (including glucose and fructose) or decreased (mostly amino acids) metabolites associating with aminoacyl-tRNA, glutathione and amino acid metabolism pathways. PLS-DA showed distinct clusters (accuracy: 85.6%), and machine-learning models identified metabolic signatures for separating cachectic states (accuracy: 83.2%; area under ROC: 88.0%). We newly identified altered blood levels of erythronic acid and glucuronic acid in human cancer cachexia, potentially linked to pentose-phosphate and detoxification pathways.
Conclusion: We found both known and yet unknown serum metabolite and metabolic pathway alterations in cachectic cancer patients that collectively support a whole-body metabolic state with impaired detoxification capability, altered glucose and fructose metabolism, and substrate supply for increased and/or distinct metabolic needs of cachexia-associated tumors. These findings together imply vulnerabilities, dependencies and targets for novel interventions that have potential to make a significant impact on future research in an important field of cancer patient care.
Keywords: GC-MS metabolomics; body metabolism; cancer cachexia; erythronic acid; glucuronic acid; metabolic pathways; serum metabolites.
Copyright © 2024 More, Hiller, Seifert, Illig, Schmidt, Gronauer, von Hahn, Weilert and Stang.
Conflict of interest statement
The authors declare that the research was conducted in the absence of any commercial or financial relationships that could be construed as a potential conflict of interest.
Figures
References
-
- Blum D, Stene GB, Solheim TS, Fayers P, Hjermstad MJ, Baracos VE, et al. Validation of the consensus-definition for cancer cachexia and evaluation of a classification model – a study based on data from an international multicentre project (EPCRC-CSA). Ann Oncol (2014) 25:1635–42. doi: 10.1093/annonc/mdu086 - DOI - PubMed
-
- Vazeille C, Jouinot A, Durand JP, Neveux N, Boudou-Rouquette P, Huillard O, et al. Relation between hypermetabolism, cachexia, and survival in cancer patients: a prospective study in 390 cancer patients before initiation of anticancer therapy. Am J Clin Nutr (2017) 105:1139–47. doi: 10.3945/ajcn.116.140434 - DOI - PubMed
LinkOut - more resources
Full Text Sources
Miscellaneous