

Functional and multi-omics signatures of mitapivat efficacy upon activation of pyruvate kinase in red blood cells from patients with sickle cell disease
- PMID: 38450513
- PMCID: PMC11290518
- DOI: 10.3324/haematol.2023.284831
Functional and multi-omics signatures of mitapivat efficacy upon activation of pyruvate kinase in red blood cells from patients with sickle cell disease
Abstract
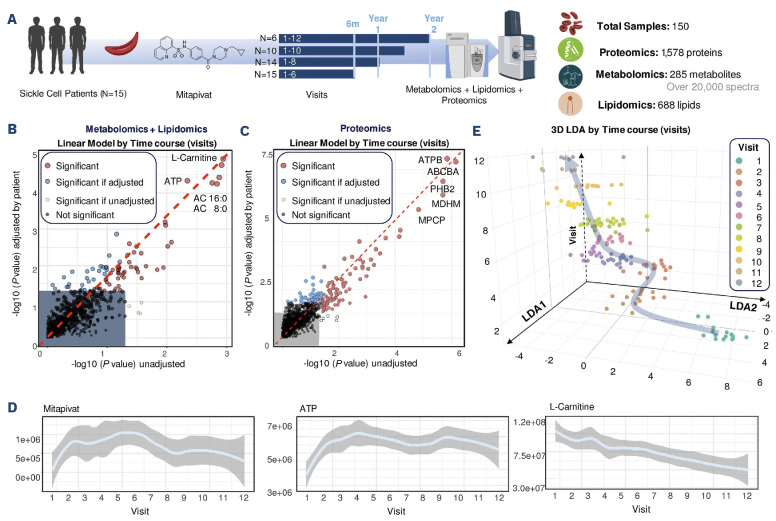
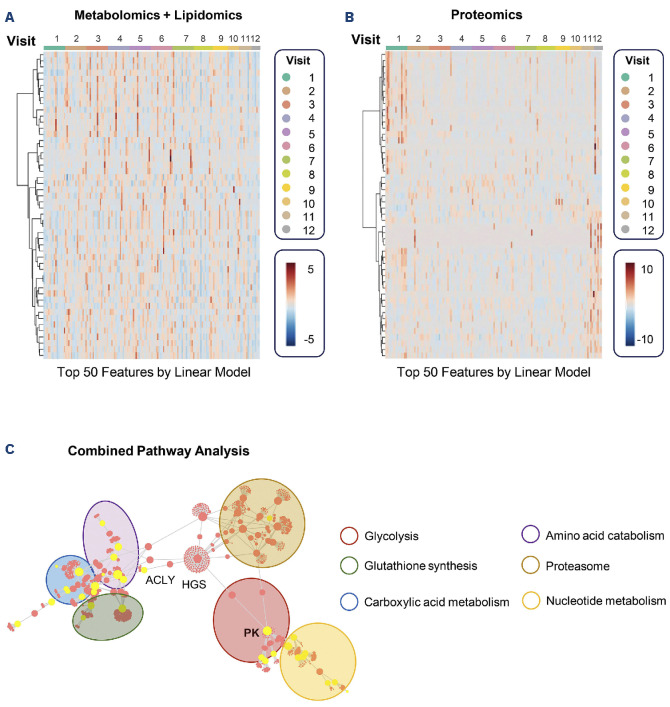
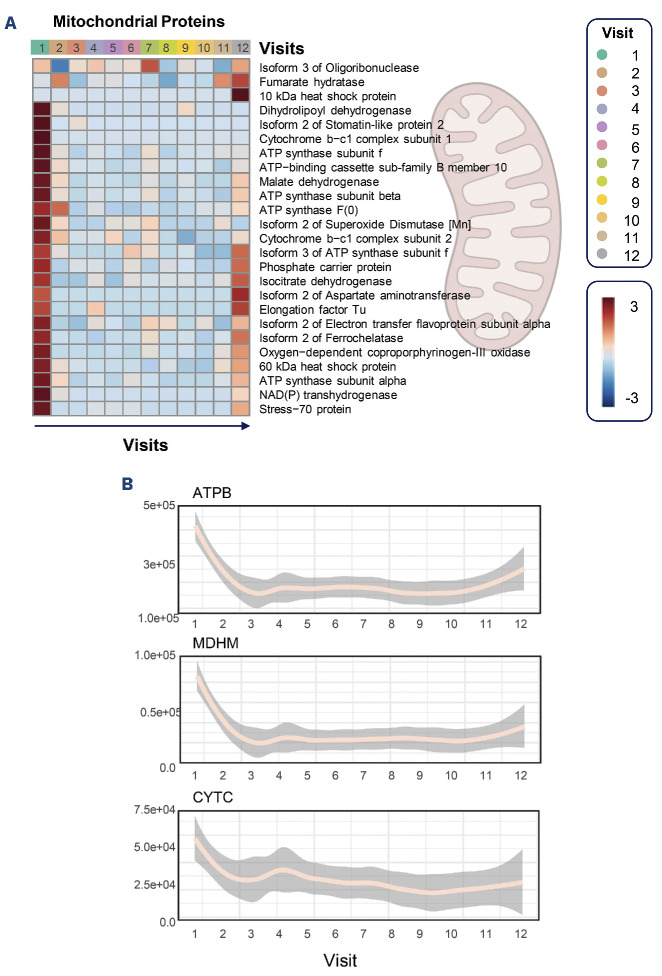
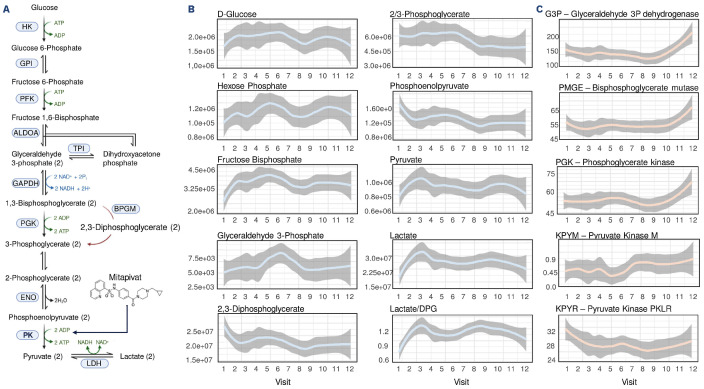
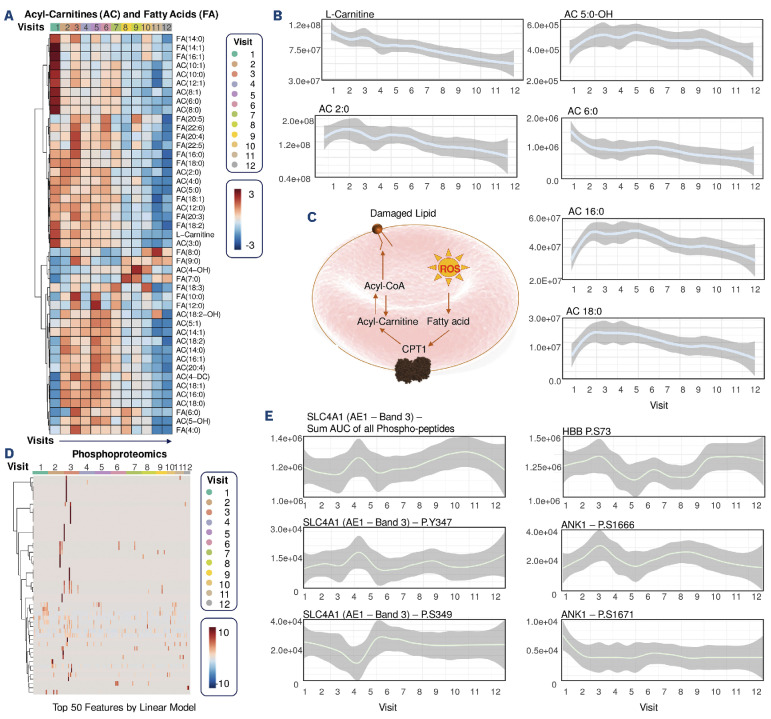
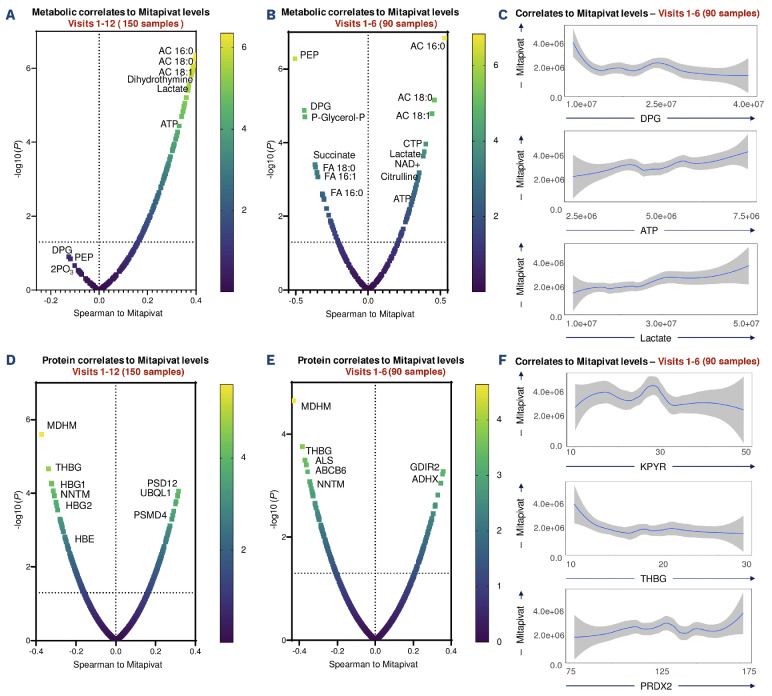
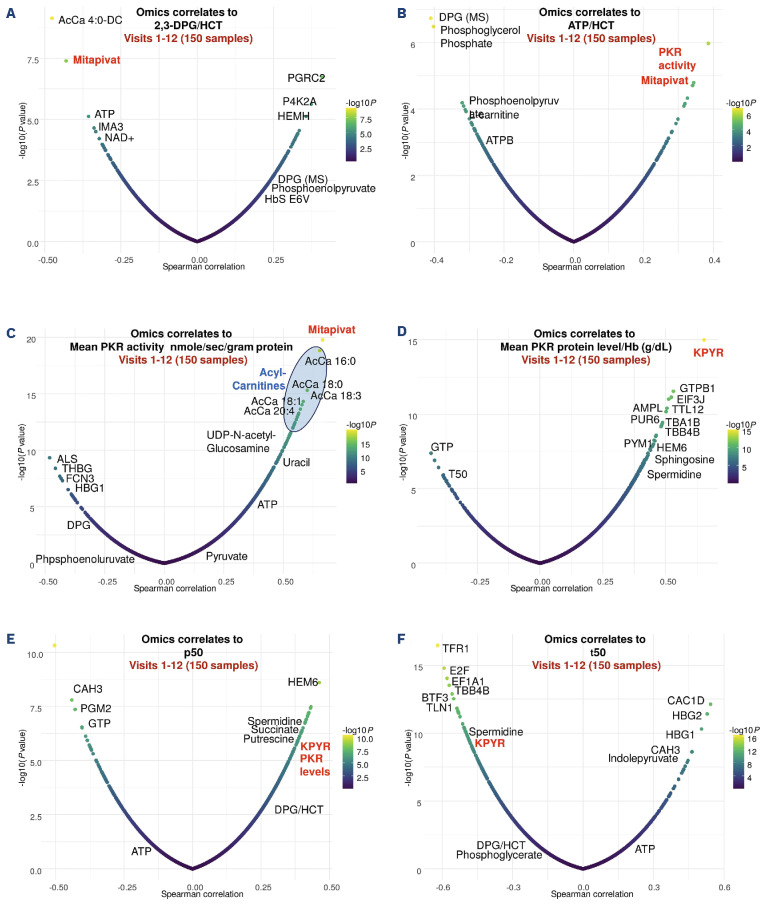
Mitapivat, a pyruvate kinase activator, shows great potential as a sickle cell disease (SCD)-modifying therapy. The safety and efficacy of mitapivat as a long-term maintenance therapy are currently being evaluated in two open-label studies. Here we applied a comprehensive multi-omics approach to investigate the impact of activating pyruvate kinase on red blood cells (RBC) from 15 SCD patients. HbSS patients were enrolled in one of the open-label, extended studies (NCT04610866). Leukodepleted RBC obtained from fresh whole blood at baseline, prior to drug initiation, and at longitudinal timepoints over the course of the study were processed for multi-omics through a stepwise extraction of metabolites, lipids and proteins. Mitapivat therapy had significant effects on the metabolome, lipidome and proteome of SCD RBC. Mitapivat decreased 2,3-diphosphoglycerate levels, increased adenosine triphosphate levels, and improved hematologic and sickling parameters in patients with SCD. Agreement between omics measurements and clinical measurements confirmed the specificity of mitapivat on targeting late glycolysis, with glycolytic metabolites ranking as the top correlates to parameters of hemoglobin S oxygen affinity (p50) and sickling kinetics (t50) during treatment. Mitapivat markedly reduced levels of proteins of mitochondrial origin within 2 weeks of initiation of treatment, with minimal changes in reticulocyte counts. In the first 6 months of treatment there were also transient elevations of lysophosphatidylcholines and oxylipins with depletion of free fatty acids, suggestive of an effect on membrane lipid remodeling. Multi-omics analysis of RBC identified benefits for glycolysis, as well as activation of the Lands cycle.
Figures
Comment in
-
Beyond adenosine triphosphate: unveiling the pleiotropic effects of pyruvate kinase activation in sickle cell anemia.Haematologica. 2024 Aug 1;109(8):2398-2400. doi: 10.3324/haematol.2024.285390. Haematologica. 2024. PMID: 38634127 Free PMC article. No abstract available.
Similar articles
-
Pyruvate kinase activators: targeting red cell metabolism in sickle cell disease.Hematology Am Soc Hematol Educ Program. 2023 Dec 8;2023(1):107-113. doi: 10.1182/hematology.2023000467. Hematology Am Soc Hematol Educ Program. 2023. PMID: 38066891 Free PMC article.
-
Mitapivat increases ATP and decreases oxidative stress and erythrocyte mitochondria retention in a SCD mouse model.Blood Cells Mol Dis. 2022 Jul;95:102660. doi: 10.1016/j.bcmd.2022.102660. Epub 2022 Mar 12. Blood Cells Mol Dis. 2022. PMID: 35366607 Free PMC article.
-
Etavopivat, a Pyruvate Kinase Activator in Red Blood Cells, for the Treatment of Sickle Cell Disease.J Pharmacol Exp Ther. 2022 Mar;380(3):210-219. doi: 10.1124/jpet.121.000743. Epub 2022 Jan 14. J Pharmacol Exp Ther. 2022. PMID: 35031585
-
Erythrocyte pyruvate kinase activation in red cell disorders.Curr Opin Hematol. 2023 May 1;30(3):93-98. doi: 10.1097/MOH.0000000000000758. Epub 2023 Feb 9. Curr Opin Hematol. 2023. PMID: 36853806 Review.
-
Mitapivat: A Review in Pyruvate Kinase Deficiency in Adults.Drugs. 2023 Nov;83(17):1613-1620. doi: 10.1007/s40265-023-01961-x. Epub 2023 Nov 22. Drugs. 2023. PMID: 37991635 Review.
Cited by
-
Mitapivat metabolically reprograms human β-thalassemic erythroblasts, increasing their responsiveness to oxidation.Blood Adv. 2025 Jun 10;9(11):2818-2830. doi: 10.1182/bloodadvances.2024013591. Blood Adv. 2025. PMID: 40085946 Free PMC article.
-
Red blood cell metabolism: a window on systems health towards clinical metabolomics.Curr Opin Hematol. 2025 May 1;32(3):111-119. doi: 10.1097/MOH.0000000000000863. Epub 2025 Mar 13. Curr Opin Hematol. 2025. PMID: 40085132 Review.
-
Metabolic blood profile and response to treatment with the pyruvate kinase activator mitapivat in patients with sickle cell disease.Hemasphere. 2024 Jun 25;8(6):e109. doi: 10.1002/hem3.109. eCollection 2024 Jun. Hemasphere. 2024. PMID: 38919958 Free PMC article.
-
Beyond adenosine triphosphate: unveiling the pleiotropic effects of pyruvate kinase activation in sickle cell anemia.Haematologica. 2024 Aug 1;109(8):2398-2400. doi: 10.3324/haematol.2024.285390. Haematologica. 2024. PMID: 38634127 Free PMC article. No abstract available.
References
-
- Sunshine HR, Hofrichter J, Ferrone FA, Eaton WA. Oxygen binding by sickle cell hemoglobin polymers. J Mol Biol. 1982;158(2):251-273. - PubMed
-
- Goldberg MA, Husson MA, Bunn HF. Participation of hemoglobins A and F in polymerization of sickle hemoglobin. J Biol Chem. 1977;252(10):3414-3421. - PubMed
-
- Nemkov T, Stephenson D, Earley E, et al. . Biological and genetic determinants of red blood cell glycolysis. bioRxiv. Sept 11, 2023. doi:10.1101/2023.09.11.55725 [preprint, not peer-reviewed].
Publication types
MeSH terms
Substances
Associated data
Grants and funding
LinkOut - more resources
Full Text Sources
Medical
Research Materials
