. 2024 Apr 16;98(4):e0170123.
doi: 10.1128/jvi.01701-23. Epub 2024 Mar 7.

The human adenovirus PI3K-Akt activator E4orf1 is targeted by the tumor suppressor p53

Affiliations

The human adenovirus PI3K-Akt activator E4orf1 is targeted by the tumor suppressor p53

Lilian Göttig et al. J Virol. .

Abstract

Human adenoviruses (HAdV) are classified as DNA tumor viruses due to their potential to mediate oncogenic transformation in non-permissive mammalian cells and certain human stem cells. To achieve transformation, the viral early proteins of the E1 and E4 regions must block apoptosis and activate proliferation: the former predominantly through modulating the cellular tumor suppressor p53 and the latter by activating cellular pro-survival and pro-metabolism protein cascades, such as the phosphoinositide 3-kinase (PI3K-Akt) pathway, which is activated by HAdV E4orf1. Focusing on HAdV-C5, we show that E4orf1 is necessary and sufficient to stimulate Akt activation through phosphorylation in H1299 cells, which is not only hindered but repressed during HAdV-C5 infection with a loss of E4orf1 function in p53-positive A549 cells. Contrary to other research, E4orf1 localized not only in the common, cytoplasmic PI3K-Akt-containing compartment, but also in distinct nuclear aggregates. We identified a novel inhibitory mechanism, where p53 selectively targeted E4orf1 to destabilize it, also stalling E4orf1-dependent Akt phosphorylation. Co-IP and immunofluorescence studies showed that p53 and E4orf1 interact, and since p53 is bound by the HAdV-C5 E3 ubiquitin ligase complex, we also identified E4orf1 as a novel factor interacting with E1B-55K and E4orf6 during infection; overexpression of E4orf1 led to less-efficient E3 ubiquitin ligase-mediated proteasomal degradation of p53. We hypothesize that p53 specifically subverts the pro-survival function of E4orf1-mediated PI3K-Akt activation to protect the cell from metabolic hyper-activation or even transformation.IMPORTANCEHuman adenoviruses (HAdV) are nearly ubiquitous pathogens comprising numerous subtypes that infect various tissues and organs. Among many encoded proteins that facilitate viral replication and subversion of host cellular processes, the viral E4orf1 protein has emerged as an intriguing yet under-investigated player in the complex interplay between the virus and its host. Nonetheless, E4orf1 has gained attention as a metabolism activator and oncogenic agent, while recent research is showing that E4orf1 may play a more important role in modulating the cellular pathways such as phosphoinositide 3-kinase-Akt-mTOR. Our study reveals a novel and general impact of E4orf1 on host mechanisms, providing a novel basis for innovative antiviral strategies in future therapeutic settings. Ongoing investigations of the cellular pathways modulated by HAdV are of great interest, particularly since adenovirus-based vectors actually serve as vaccine or gene vectors. HAdV constitute an ideal model system to analyze the underlying molecular principles of virus-induced tumorigenesis.

Keywords: E4orf1; HAdV; PI3K-Akt; p53; tumor suppressor.


Conflict of interest statement

The authors declare no conflict of interest.

Figures

Fig 1
Fig 1
Generation of recombinant HAdV-C5 ∆E4orf1 and HAdV-C5 HA-E4orf1 with successful virus propagation. (A) Schematic HAdV-C5 bacmid cloning scheme. The E4 box in the WT E4-box vector was mutagenized with insertion PCR (red X), either introducing a stop codon at the N-terminus, which if leaky results in a frameshift, to encode ∆E4orf1, or inserting an HA-tag at the N-terminus to encode HA-E4orf1. The recombinant E4 boxes were excised by BstBI digestion and ligated with linearized HAdV-C5 bacmid rest genomes to generate recombinant HAdV-C5 bacmids. These were linearized for transfection, which generated infectious particles (HAdV-C5 ∆E4orf1 and HAdV-C5 HA-E4orf1) several days post transfection. (B) Virus DNA was isolated from freshy generated and harvested virus by phenol-chloroform extraction and sequenced. The sequences were aligned with Clustal Omega [EMBL-EBI (111)], which shows from top to bottom amino acid sequences of the E4orf1 region of HAdV-C5 ∆E4orf1 (stop codons indicated in orange), HAdV-C5 WT, and HAdV-C5 HA-E4orf1 (HA-tag indicated in blue). (C) A549 cells were infected with HAdV-C5 WT and HAdV-C5 HA-E4orf1 (MOI 20), harvested at 0, 8, 16, 24, 48, and 72 h post infection (hpi), lysed, and subjected to western blotting with detection of the HA-tag of E4orf1, E2A, and β-actin as a loading control. Stained proteins are indicated on the right and molecular weights in kDa on the left. (D) H1299 cells were transfected with 5 µg pcDNA3-HA empty or pcDNA3-HA-E4orf1-C5. Following harvesting of the cells 30 h post transfection (hpt), cells were lysed and proteins were separated via SDS-PAGE and subjected to western blotting using anti-HA and anti-β-actin antibodies that served as a loading control, while phosphorylated Akt (pAkt) at Ser473 was used as E4orf1 expression control. (E) H1299 cells were transfected with 5 µg pcDNA3-HA empty, pcDNA3-HA-E4orf1-C5, pcDNA3-HA-E4orf1∆PBM-C5, or pcDNA3-HA-E4orf1∆C-Term-C5. The cells were processed and analyzed as in D.
Fig 2
Fig 2
E4orf1 deletion from HAdV-C5 has minor effects on viral replication. (A) A549 cells were infected with HAdV-C5 WT and HAdV-C5 ∆E4orf1 with MOI 20 and harvested at 16 and 48 hpi. The cells were lysed, and 1 µg was digested with proteinase K. RT-PCR amplified the genomic region for HAdV-C5 E2A. The resulting CT values were calculated relative to the fold change and normalized to HAdV-C5 16 hpi. (B) A549 cells were infected as in A and harvested at 24 and 48 hpi. After lysing the cells, mRNA was extracted, and 1 µg was used for reverse transcription to cDNA. RT-PCR amplified HAdV-C5 cDNA for E1A, E2A, and Hexon. The resulting CT values were calculated relative to RNA Polymerase II and the fold change was normalized to HAdV WT 24 hpi. (C) A549 cells were infected and harvested as in A. The samples were lysed and analyzed with SDS-PAGE and western blotting. Detection of E1A, E2A, E1B-55K, E4orf6, E4orf3, and Capsid served as controls for functional HAdV-C5 infection, p53 was stained as an E3 ubiquitin ligase target, pAkt-Ser473 as a ∆E4orf1 control, and β-actin served as a loading control. Stained proteins are indicated on the right and molecular weights in kDa on the left. (D) A549 cells were infected as in A. At 72 hpi, the cells were harvested and resuspended in unsupplemented DMEM and the virus was isolated by three freeze (liquid nitrogen) and thaw (37°C, water bath) cycles. HEK293 cells were reinfected with decreasing virus dilutions and fixed with MeOH after 30 h. Virally expressed E2A was immunostained, progeny production analyzed with an Axiovert 200 M microscope, and fluorescent-forming units (ffu)/cell was quantified. (E) A549 cells were infected with HAdV-C5 WT and HAdV-C5 ∆E4orf1 (MOI 20), harvested at 0, 24, 48, and 72 hpi, lysed, and subjected to western blotting using the antibodies mentioned in C. Statistical analysis was performed using Student’s unpaired t-test and the Wilcoxon rank sum test (n.s., not significant, P > 0.05; normalized values in percentage).
Fig 3
Fig 3
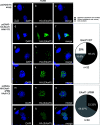
The PBM of E4orf1 is responsible for distinct nuclear localization. H1299 cells grown on glass cover slips in 12 wells were transfected with 1 µg pcDNA3-HA empty, pcDNA3-HA-E4orf1-C5, or pcDNA3-HA-E4orf1∆PBM-C5 and permeabilized and fixed 30 hpt. IF labelling was performed using primary anti-HA (rat) and secondary rat AlexaFluor (488 nm) as well as nucleus-staining DAPI (405 nm). The immunostained cells were detected with an LSM 880 (Zeiss), 3 ≤ images taken per replicate, images processed with Zen lite (Zeiss), and HA-signal distribution phenotypes counted and quantified (right panel).
Fig 4
Fig 4
E4orf1 dynamically localizes throughout the cells. (A) A549 cells grown on glass cover slips were mock infected or with HAdV-C5 HA-E4orf1 (MOI 20) and permeabilized and fixed at 16, 24, 48, and 72 hpi. IF labeling was performed using primary B6-8 anti-E2A (mouse) and AlexaFluor (488 nm), as well as anti-HA (rat) and secondary rat AlexaFluor (647 nm), and nucleus-staining DAPI (405 nm). The immunostained cells were detected with an ECLIPSE Ti microscope (Nikon), 3 ≤ images taken per replicate, and images processed with Volocity (PerkinElmer). (B) A549 Tet empty and HA-E4orf1 cells were grown on glass cover slips and induced (+Dox; 2 µg/mL) for 48 h. IF staining was performed using primary anti-PML (rabbit) and AlexaFluor (647 nm), as well as anti-HA (rat) and secondary rat AlexaFluor (488 nm), and nucleus-staining DAPI (405 nm). The immunostained cells were detected with an LSM 880 (Zeiss), of which 3 ≤ images were taken per replicate and processed with Zen lite (Zeiss).
Fig 5
Fig 5
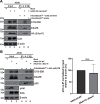
E4orf1 interacts with the HAdV-C5 E3 ligase components E1B-55K and E4orf6 but does not significantly affect interaction with p53 during infection. (A) A549 cells were infected with HAdV-C5 HA-E4orf1 with MOI 20 and harvested at 48 hpi. These cells were then lysed; an aliquot was reserved for the input and the rest, corresponding to 1,000 µg overall protein, subjected to IP with magnetic A SureBeads, either antibody unconjugated (empty) or incubated with anti-E1B 2A6. Input and IP were analyzed in SDS-PAGE and western blotting. E2A detection served as an infection control and HA as an E4orf1 expression control; E1B-55K and E4orf6 detection confirmed correct HAdV-C5 protein expression, and β-actin served as a loading control. Stained proteins are indicated on the right and molecular weights in kDa on the left. (B) A549 cells were infected with HAdV-C5 WT or HAdV-C5 ∆E4orf1 with MOI 20 and harvested at 48 hpi. The samples for input and IP were prepared as in A. Visualization of E2A served as a control for equal infection between the viruses, and anti-E1B-55K and E4orf6 detection was included to confirm HAdV-C5 protein expression. Anti-pAkt-Ser473 antibody detection was used to confirm E4orf1 deletion, and β-actin served as a loading control. Human p53 interaction in the co-IP with E1B-55K was quantified with ImageJ and normalized relative to the p53 input and β-actin. Statistical analysis was performed with Student’s unpaired t-test (n.s., not significant, P > 0.05; values in percentage).
Fig 6
Fig 6
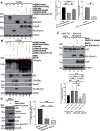
Overexpression of E4orf1 decreases HAdV-C5-mediated E3 ubiquitin ligase proteasomal degradation of p53. (A) H1299 cells were transfected with 5 µg each of pcDNA3-E1B-55K, pcDNA3-E4orf6, pcDNA3-HA-E4orf1-C5, and 2.5 µg of pC53-SN3 encoding human p53 and equal amounts of corresponding empty vectors pcDNA3 empty and pcDNA3-HA empty. Forty-eight hours post transfection, the cells were harvested, lysed, and subjected to western blotting. E1B-55K, E4orf6, HA (E4orf1), and p53 served as expression controls and β-actin as loading controls. Stained proteins are indicated on the right and molecular weights in kDa on the left. Signal intensities of p53 (middle panel) and E4orf1 (right panel) expression were calculated relative to β-actin and normalized in a densitometric analysis with ImageJ. (B) H1299 cells were transfected and processed as in A; however, 16 h prior to harvesting, the cells were treated with 25 µM of the proteasome inhibitor MG132 or an equivalent volume of DMSO. (C) A549 Tet empty and HA-E4orf1 were either induced (+Dox; 2 µg/mL) or mock induced with an equal volume of MeOH (−Dox) for 24 h, after which the cells were mock infected for 48 h or with HAdV-C5 ∆E4orf1 at MOI 20. Following harvesting, cell lysis, and western blotting as in A, HA (E4orf1) staining was used as an induction and p53 and E2A as infection controls, as well as β-actin serving as a loading control. Signal intensities for p53 were calculated with ImageJ as in A (lower bar chart). (D) A549 cells were infected with HAdV-C5 WT or HAdV-C5 ∆E4orf1 with MOI 20 and harvested at 48 hpi. The samples were further processed as in A, including E2A as an infection control, pAkt-Ser473 as an E4orf1 deletion control, and Mdm2 and PTEN as PI3K-Akt pathway proteins. Signal intensities for p53 were calculated with ImageJ as in A (right bar chart). Statistical analysis was performed with Student’s unpaired t-test (*P < 0.05 and **P < 0.005; n.s. not significant, P > 0.05; normalized values in percentage).
Fig 7
Fig 7
E4orf1 modulates p53 ubiquitination with the E3 ubiquitin ligase complex. (A) H1299 cells were transfected with 3 µg of each pcDNA3-E1B-55K, pcDNA3-E4orf6, and pcDNA3-HA-E4orf1-C5; 10 µg pcDNA3-6xHis-ubiquitin; and 2.5 µg pC53-SN3 coding for human p53 and equal amounts of corresponding pcDNA3 empty and pcDNA3-HA, as well as 0.5 µg pEYFP empty. Forty-eight hours post transfection, the cells were harvested, lysed, and subjected to western blotting. E1B-55K, E4orf6, HA (E4orf1), 6xHis (ubiquitin), and p53 were visualized to detect protein expression; GFP was used as a transfection control and β-actin as a loading control. Stained proteins are indicated on the right and molecular weights in kDa on the left. (B) Signal intensities of p53 6xHis-ubiquitin modification in the NiNTA assay were calculated relative to the p53 input and normalized to β-actin with ImageJ. Statistical analysis was performed with Student’s unpaired t-test (n.s., not significant, P > 0.05; normalized values in percentage).
Fig 8
Fig 8
Human p53 is a novel interaction partner of E4orf1, inversely regulating E4orf1 integrity. (A) H1299 cells were transfected with 5 µg pcDNA3-HA-E4orf1-C5 and increasing amounts, 1, 2.5, and 5 µg of pC53-SN3 coding for human p53 and equal amounts of corresponding empty vectors pcDNA3 empty and pcDNA3-HA empty. 48 hpt, the cells were harvested, lysed, and subjected to western blotting. HA (E4orf1) and p53 detection revealed protein expression; pAkt-Ser473 detection was used as an E4orf1 expression control and β-actin as a loading control. Stained proteins are indicated on the right and molecular weights in kDa on the left. Signal intensities of E4orf1 (middle panel) and pAkt-Ser473 (right panel) with varying concentrations of p53 co-expression were calculated relative to β-actin and normalized in a densitometric analysis with ImageJ. (B) HepaRG cells were transfected with 15 µg pcDNA3-HA-E4orf1-C5 or pcDNA3-HA empty for 30 h. Following harvesting and lysis, an aliquot was reserved for the input and the rest, corresponding to 2,000 µg total protein, was subjected to IP with anti-p53 antibody-coupled protein A magnetic SureBeads or with uncoupled empty beads that served as unspecific binding controls. In western blotting, HA (E4orf1) and p53 served as transfection controls and β-actin as a loading control. (C) HepaRG cells were treated and processed as in B, including transfection with 15 µg pcDNA3-HA-E4orf1-∆PBM-C5 and staining of pAkt-Ser473 in western blots as an E4orf1-∆PBM control. Statistical analysis was performed with Student’s unpaired t-test (*P < 0.05, **P < 0.005, ***P < 0.0005, and **** P < 0.00005; n.s., not significant, P > 0.05; normalized values in percentage: exp, exposure).
Fig 9
Fig 9
p53 colocalizes with E4orf1. (A) H1299 cells were grown on glass cover slips and transfected for 48 h with pC53-SN3 encoding human p53 and pcDNA3-HA-E4orf1-C5 and corresponding empty vectors pcDNA3 empty and pcDNA3-HA empty. IF staining was performed using primary anti-p53 (mouse) and secondary mouse AlexaFluor (488 nm), as well as anti-HA (rat) and secondary rat AlexaFluor (647 nm), and nucleus-staining DAPI (405 nm). The transfected and immunostained cells were then detected with an ECLIPSE Ti microscope (Nikon), 3 ≤ images taken per replicate, cross-sections (Z plane) taken, and images processed as well as co-localization quantified as a Pearson’s correlation coefficient of E4orf1 and p53-positive cells (co-localization > 0.5; n = 20) with Volocity (PerkinElmer; right panel with error and mean indicated). (B) A549 Tet empty and HA-E4orf1 cells were grown on glass cover slips and induced (+Dox; 2 µg/mL) or an equal volume of MeOH (−Dox) for 48 h. IF labelling was performed using primary anti-p53 (mouse) and secondary mouse AlexaFluor (647 nm), as well as anti-HA (rat) and secondary rat AlexaFluor (488 nm), and nucleus-staining DAPI (405 nm). The induced and immunostained cells were detected with an LSM 880 (Zeiss), 3 ≤ images taken per replicate, and images processed with Zen lite (Zeiss; right panel). (C) Relative expression of HA-E4orf1 and p53 per cell count was quantified with ImageJ. (D) Relative expression of HA-E4orf1 with nuclear dots in Tet A549 cells compared with H1299 cells was quantified with ImageJ. Statistical analysis was performed with Student’s unpaired t-test (*P < 0.05 and ***P < 0.0005; normalized values in percentage).
Fig 10
Fig 10
Summarizing overview of HAdV-C5 E4orf1. HAdV-C5 infection expresses viral proteins, and through binding of PI3K and Dlg-1, a fraction of the cytoplasm-associated E4orf1 protein activates the canonical PI3K-Akt phosphorylation cascade, where PIP2 is converted to PIP3, which induces PDK1 for Thr308 Akt phosphorylation and mTORC2 for Ser473 Akt phosphorylation, which is also achieved by DNA-PK (66). Akt activation contributes to cell survival. E4orf1 interacts with the viral E3 ubiquitin ligase components E1B-55K and E4orf6, which can affect the efficiency of proteasomal degradation of p53. Within the nucleus, E4orf1 co-localizes and interacts with p53, where E4orf1 also assembles dot hotspots. Potentially through the interaction, p53 may deregulate E4orf1 to protect the cell from hyper-active Akt. Since p53 is degraded through the E3 ubiquitin ligase complex, it may be beneficial for the virus that E4orf1 modulates the ubiquitin PTM to initially fine-tune instead of degrade cellular targets, including p53. Blue lines and black text represent previously described and our own observed events presented here, while gray dotted lines and gray text represent theoretical events or unknown modes of action.

References

    1. Rampersad S, Tennant P. 2018. Viruses, p 55–82
    1. Pandey NV. 2020. DNA viruses and cancer: insights from evolutionary biology. Virusdisease 31:1–9. doi:10.1007/s13337-019-00563-0 - DOI - PMC - PubMed
    1. Krump NA, You J. 2018. Molecular mechanisms of viral oncogenesis in humans. Nat Rev Microbiol 16:684–698. doi:10.1038/s41579-018-0064-6 - DOI - PMC - PubMed
    1. Tessier TM, Dodge MJ, MacNeil KM, Evans AM, Prusinkiewicz MA, Mymryk JS. 2021. Almost famous: human adenoviruses (and what they have taught us about cancer). Tumour Virus Res 12:200225. doi:10.1016/j.tvr.2021.200225 - DOI - PMC - PubMed
    1. Endter C, Dobner T. 2004. Edited by Doerfler W and Böhm P. Adenoviruses: model and vectors in virus-host interactions: immune system, oncogenesis, gene therapy, p 163–214. Springer, Berlin, Heidelberg.

MeSH terms

Substances