Randomized Controlled Trial
. 2024 Apr;6(2):e230217.
doi: 10.1148/ryct.230217.

Multi-Energy Low-Kiloelectron Volt versus Single-Energy Low-Kilovolt Images for Endoleak Detection at CT Angiography of the Aorta

Affiliations
Randomized Controlled Trial

Multi-Energy Low-Kiloelectron Volt versus Single-Energy Low-Kilovolt Images for Endoleak Detection at CT Angiography of the Aorta

Anna Landsmann et al. Radiol Cardiothorac Imaging. 2024 Apr.

Abstract

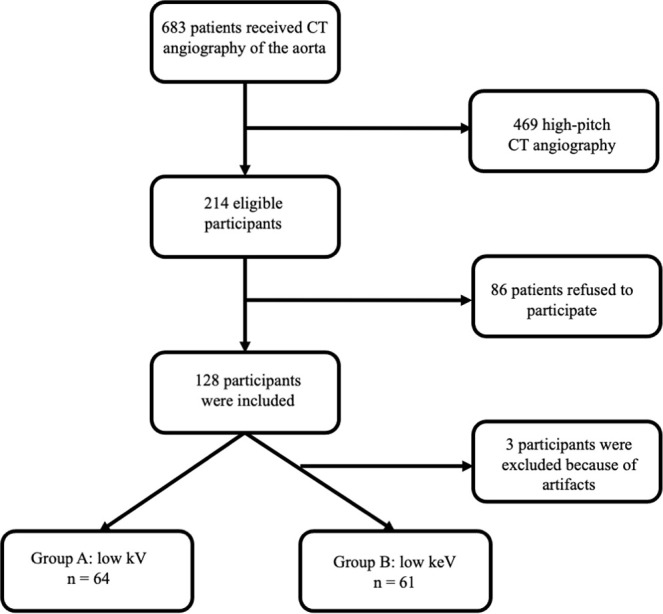
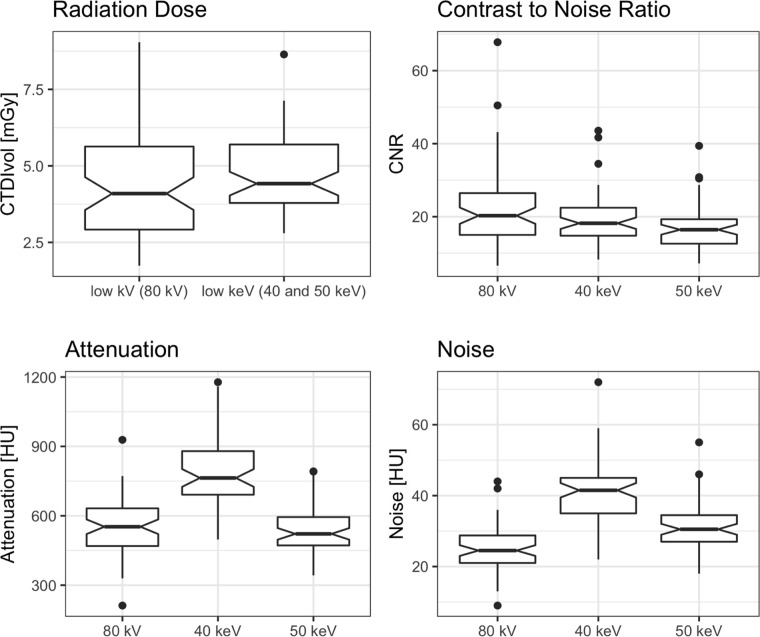
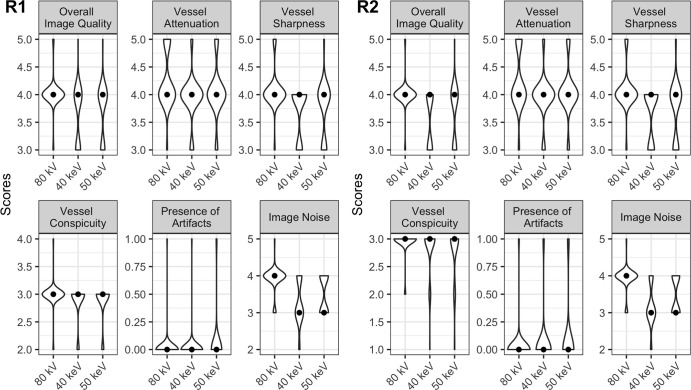
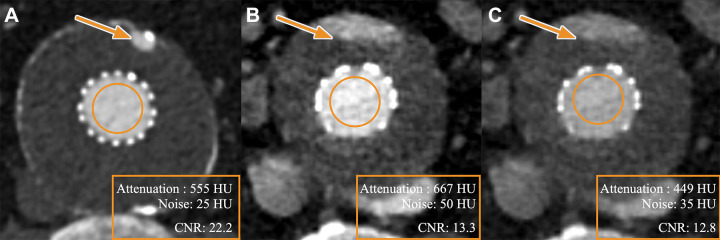
Purpose To compare image quality, diagnostic performance, and conspicuity between single-energy and multi-energy images for endoleak detection at CT angiography (CTA) after endovascular aortic repair (EVAR). Materials and Methods In this single-center prospective randomized controlled trial, individuals undergoing CTA after EVAR between August 2020 and May 2022 were allocated to imaging using either low-kilovolt single-energy images (SEI; 80 kV, group A) or low-kiloelectron volt virtual monoenergetic images (VMI) at 40 and 50 keV from multi-energy CT (80/Sn150 kV, group B). Scan protocols were dose matched (volume CT dose index: mean, 4.5 mGy ± 1.8 [SD] vs 4.7 mGy ± 1.3, P = .41). Contrast-to-noise ratio (CNR) was measured. Two expert radiologists established the reference standard for the presence of endoleaks. Detection and conspicuity of endoleaks and subjective image quality were assessed by two different blinded radiologists. Interreader agreement was calculated. Nonparametric statistical tests were used. Results A total of 125 participants (mean age, 76 years ± 8; 103 men) were allocated to groups A (n = 64) and B (n = 61). CNR was significantly lower for 40-keV VMI (mean, 19.1; P = .048) and 50-keV VMI (mean, 16.8; P < .001) as compared with SEI (mean, 22.2). In total, 45 endoleaks were present (A: 23 vs B: 22). Sensitivity for endoleak detection was higher for SEI (82.6%, 19 of 23; P = .88) and 50-keV VMI (81.8%, 18 of 22; P = .90) as compared with 40-keV VMI (77.3%, 17 of 22). Specificity was comparable among groups (SEI: 92.7%, 38 of 41; both VMI energies: 92.3%, 35 of 38; P = .99), with an interreader agreement of 1. Conspicuity of endoleaks was comparable between SEI (median, 2.99) and VMI (both energies: median, 2.87; P = .04). Overall subjective image quality was rated significantly higher for SEI (median, 4 [IQR, 4-4) as compared with 40 and 50 keV (both energies: median, 4 [IQR, 3-4]; P < .001). Conclusion SEI demonstrated higher image quality and comparable diagnostic accuracy as compared with 50-keV VMI for endoleak detection at CTA after EVAR. Keywords: Aneurysms, CT, CT Angiography, Vascular, Aorta, Technology Assessment, Multidetector CT, Abdominal Aortic Aneurysms, Endoleaks, Perigraft Leak Supplemental material is available for this article. © RSNA, 2024.

Keywords: Abdominal Aortic Aneurysms; Aneurysms; Aorta; CT; CT Angiography; Endoleaks; Multidetector CT; Perigraft Leak; Technology Assessment; Vascular.


Conflict of interest statement

Disclosures of conflicts of interest: A.L. No relevant relationships. T.S. No relevant relationships. V.M. No relevant relationships. L.J. No relevant relationships. M.E. Payment or honoraria from Siemens Healthineers for speakers bureau activities. A.K. No relevant relationships. H.A. Institutional grants from Bayer, Canon, Guerbet, and Siemens; honoraria from Siemens for lectures. A.E. Author’s institution received grants from Bayer Healthcare, Canon, Guerbet, and Siemens Healthcare, unrelated to this study; author is part of the Siemens Healthineers speakers bureau.

Figures

Flowchart depicts participant inclusion.
Figure 1:
Flowchart depicts participant inclusion.
Box plots depict objective image parameters for low-kilovolt
single-energy images and low–kiloelectron volt virtual monoenergetic
images at 40 keV and 50 keV, reconstructed from multi-energy CT. The line in
each box depicts the median. The lower and upper hinges correspond to the
first and third quartiles, respectively. The lower and upper whiskers extend
to the smallest and largest values, respectively, no further than 1.5 times
the IQR from the hinge. Points outside the whiskers depict outlier values,
further than 1.5 times the IQR from the hinge. CNR = contrast-to-noise
ratio, CTDIvol = volume CT dose index.
Figure 2:
Box plots depict objective image parameters for low-kilovolt single-energy images and low–kiloelectron volt virtual monoenergetic images at 40 keV and 50 keV, reconstructed from multi-energy CT. The line in each box depicts the median. The lower and upper hinges correspond to the first and third quartiles, respectively. The lower and upper whiskers extend to the smallest and largest values, respectively, no further than 1.5 times the IQR from the hinge. Points outside the whiskers depict outlier values, further than 1.5 times the IQR from the hinge. CNR = contrast-to-noise ratio, CTDIvol = volume CT dose index.
Violin plots depict subjective image parameters assessed by reader 1
(R1) and reader 2 (R2) for low-kilovolt single-energy images and
low–kiloelectron volt virtual monoenergetic images at 40 keV and 50
keV, reconstructed from multi-energy CT. The point in each violin depicts
the median. The lower and upper hinges extend to the smallest and highest
values, respectively. The width of each violin refers to the frequency of
the given value.
Figure 3:
Violin plots depict subjective image parameters assessed by reader 1 (R1) and reader 2 (R2) for low-kilovolt single-energy images and low–kiloelectron volt virtual monoenergetic images at 40 keV and 50 keV, reconstructed from multi-energy CT. The point in each violin depicts the median. The lower and upper hinges extend to the smallest and highest values, respectively. The width of each violin refers to the frequency of the given value.
Exemplary images of endoleaks after endovascular repair of an aortic
aneurysm. (A) Single-energy CT angiographic image in an 84-year-old male
patient at 80 kV in the arterial phase shows endoleak type I (arrow). (B, C)
Multi-energy CT angiographic images in a 72-year-old male patient in the
arterial phase demonstrate endoleak type I (arrow) at (B) 40 keV and at (C)
50 keV. (D) Single-energy CT angiographic image at 80 kV in an 80-year-old
male patient in the arterial phase shows endoleak type II (arrow). (E, F)
Multi-energy CT angiographic images in a 75-year-old male patient in the
arterial phase demonstrate endoleak type II (arrow) at (E) 40 keV and at (F)
50 keV.
Figure 4:
Exemplary images of endoleaks after endovascular repair of an aortic aneurysm. (A) Single-energy CT angiographic image in an 84-year-old male patient at 80 kV in the arterial phase shows endoleak type I (arrow). (B, C) Multi-energy CT angiographic images in a 72-year-old male patient in the arterial phase demonstrate endoleak type I (arrow) at (B) 40 keV and at (C) 50 keV. (D) Single-energy CT angiographic image at 80 kV in an 80-year-old male patient in the arterial phase shows endoleak type II (arrow). (E, F) Multi-energy CT angiographic images in a 75-year-old male patient in the arterial phase demonstrate endoleak type II (arrow) at (E) 40 keV and at (F) 50 keV.
Exemplary images of endoleaks after endovascular repair of an aortic
aneurysm. (A) Single-energy CT angiographic image in a 77-year-old male
patient at 80 kV in the arterial phase shows endoleak type II (arrow). (B,
C) Multi-energy CT angiographic images in a 77-year-old male patient in the
arterial phase demonstrate endoleak type II (arrows) at (B) 40 keV and at
(C) 50 keV. Please note the highest CT attenuation but also the highest
image noise at 40 keV, resulting in lower subjective image quality. Noise is
given as the SD of CT attenuation in the psoas muscle. Orange circular
outline indicates the measured region of interest. CNR = contrast-to-noise
ratio.
Figure 5:
Exemplary images of endoleaks after endovascular repair of an aortic aneurysm. (A) Single-energy CT angiographic image in a 77-year-old male patient at 80 kV in the arterial phase shows endoleak type II (arrow). (B, C) Multi-energy CT angiographic images in a 77-year-old male patient in the arterial phase demonstrate endoleak type II (arrows) at (B) 40 keV and at (C) 50 keV. Please note the highest CT attenuation but also the highest image noise at 40 keV, resulting in lower subjective image quality. Noise is given as the SD of CT attenuation in the psoas muscle. Orange circular outline indicates the measured region of interest. CNR = contrast-to-noise ratio.

Similar articles

Cited by

References

    1. Bulder RMA , Bastiaannet E , Hamming JF , Lindeman JHN . Meta-analysis of long-term survival after elective endovascular or open repair of abdominal aortic aneurysm . Br J Surg 2019. ; 106 ( 5 ): 523 – 533 . - PubMed
    1. Cassagnes L , Pérignon R , Amokrane F , et al. . Aortic stent-grafts: Endoleak surveillance . Diagn Interv Imaging 2016. ; 97 ( 1 ): 19 – 27 . - PubMed
    1. Chaikof EL , Dalman RL , Eskandari MK , et al. . The Society for Vascular Surgery practice guidelines on the care of patients with an abdominal aortic aneurysm . J Vasc Surg 2018. ; 67 ( 1 ): 2 – 77.e2 . - PubMed
    1. Smith T , Quencer KB . Best practice guidelines: imaging surveillance after endovascular aneurysm repair . AJR Am J Roentgenol 2020. ; 214 ( 5 ): 1165 – 1174 . - PubMed
    1. Higashigaito K , Schmid T , Puippe G , et al. . CT angiography of the aorta: prospective evaluation of individualized low-volume contrast media protocols . Radiology 2016. ; 280 ( 3 ): 960 – 968 . - PubMed

Publication types

LinkOut - more resources