. 2024 May 15;84(10):1719-1732.
doi: 10.1158/0008-5472.CAN-23-4070.

Transcriptomic Profiling of Plasma Extracellular Vesicles Enables Reliable Annotation of the Cancer-Specific Transcriptome and Molecular Subtype

Affiliations

Transcriptomic Profiling of Plasma Extracellular Vesicles Enables Reliable Annotation of the Cancer-Specific Transcriptome and Molecular Subtype

Vahid Bahrambeigi et al. Cancer Res. .

Abstract

Longitudinal monitoring of patients with advanced cancers is crucial to evaluate both disease burden and treatment response. Current liquid biopsy approaches mostly rely on the detection of DNA-based biomarkers. However, plasma RNA analysis can unleash tremendous opportunities for tumor state interrogation and molecular subtyping. Through the application of deep learning algorithms to the deconvolved transcriptomes of RNA within plasma extracellular vesicles (evRNA), we successfully predicted consensus molecular subtypes in patients with metastatic colorectal cancer. Analysis of plasma evRNA also enabled monitoring of changes in transcriptomic subtype under treatment selection pressure and identification of molecular pathways associated with recurrence. This approach also revealed expressed gene fusions and neoepitopes from evRNA. These results demonstrate the feasibility of using transcriptomic-based liquid biopsy platforms for precision oncology approaches, spanning from the longitudinal monitoring of tumor subtype changes to the identification of expressed fusions and neoantigens as cancer-specific therapeutic targets, sans the need for tissue-based sampling.

Significance: The development of an approach to interrogate molecular subtypes, cancer-associated pathways, and differentially expressed genes through RNA sequencing of plasma extracellular vesicles lays the foundation for liquid biopsy-based longitudinal monitoring of patient tumor transcriptomes.


Conflict of interest statement

Conflict of interest

A.M. is listed as an inventor on a patent that has been licensed by Johns Hopkins University to ThriveEarlier Detection, an Exact Sciences Company. A.M. serves as a consultant for Tezcat Biotechnology. S.K. has ownership interest in MolecularMatch, Lutris, Iylon, and is a consultant for Genentech, EMD Serono, Merck, Holy Stone, Novartis, Lilly, Boehringer Ingelheim, Boston Biomedical, AstraZeneca/MedImmune, Bayer Health, Pierre Fabre, Redx Pharma, Ipsen, Daiichi Sankyo, Natera, HalioDx, Lutris, Jacobio, Pfizer, Repare Therapeutics, Inivata, GlaxoSmithKline, Jazz Pharmaceuticals, Iylon, Xilis, Abbvie, Amal Therapeutics, Gilead Sciences, Mirati Therapeutics, Flame Biosciences, Servier, Carina Biotechnology, Bicara Therapeutics, Endeavor BioMedicines, Numab Pharma, Johnson & Johnson/Janssen, and has received research funding from Sanofi, Biocartis, Guardant Health, Array BioPharma, Genentech/Roche, EMD Serono, MedImmune, Novartis, Amgen, Lilly, Daiichi Sankyo. R.S. has received consulting fees from Boehringer Ingelheim. All other authors declare no potential conflicts of interest.

Figures

Figure 1.
Figure 1.. A visual overview of workflow in this study.
a, RNA-seq was performed on tumor samples and plasma EV of cancer patients as well as plasma EV of healthy controls. For deconvolution with CIBERSORTx and CODEFACS, a signature matrix was created using genes that are enriched in the tumor samples and in the plasma EV of healthy controls. Deconvolution could impute the proportion of cancer present in bulk plasma evRNA, which also allowed for generation of ROC curve based on whether cancer RNA was present in the sample. Deconvolved plasma EV profiles were also used in gene set enrichment analysis (GSEA) and artificial neural network to assign the CMS groups, which were then compared to the subtypes of the tumor samples. b, Cohorts of CRC patients analyzed in this study. In the baseline cohort, molecular subtypes of tumor tissues and their matched plasma evRNA samples were compared in addition to relevant transcriptomic pathways. In the longitudinal cohort, molecular subtype switch and emerging changes at the gene and pathway level were evaluated and compared, at each serial point, in patients with recurrence, without recurrence, and those with stable disease.
Figure 2.
Figure 2.. Transcriptomic subtyping for solid tumor tissues and their paired liquid biopsy samples.
a, Summary of transcriptomic subtyping of tumor tissues along with tumor MCP-counter results. Each column represents a patient, arranged by tumor purity from highest on the left to lowest on the right. b, Summary of molecular subtyping for deconvoluted liquid biopsy samples and corresponding MCP-counter results. The top row represents the prediction for bulk plasma EV and the bottom row represents the prediction for deconvolved plasma EV. If the predicted subtype of the liquid biopsy is concordant with the tumor sample, the column is marked by black box. c, Sankey diagram depicting CMS classification for tumor (left) and paired liquid biopsy (right) using CODEFACS. d-h, Single sample GSEA analysis (ssGSEA) of deconvoluted liquid biopsy samples for some of major pathways elevated at each CMS.
Figure 3.
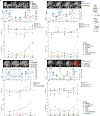
Figure 3.. Longitudinal monitoring of CMS changes in mCRC patients.
Timeline showing disease history of four mCRC patients, along with sequential ssGSEA and MCP-counter analyses. The tumor-derived transcripts, obtained post-deconvolution using CODEFACS, were utilized as input for molecular subtyping and ssGSEA analysis. Additionally, the evRNA data, without deconvolution, was employed for MCP-counter. a and b, in patients one and two, EVs-based CMS was determined at baseline, before and at the time of radiological recurrence for patient 1 or progression for patient 2. c, in patient three, EV-based CMS was determined at baseline and at four additional time points. d, in patient four, EV-based CMS was predicted at baseline and in six additional longitudinal draws. Disease responses according to RECIST 1.1 criteria are shown in the y axis (14). An upward segment between two time points represents recurrence/progressive disease (Rec/PD), a flat segment represents stable disease (SD) or non-evidence of disease (NED) and a downward segment represents complete response/partial response (CR/PR).
Figure 4.
Figure 4.. Longitudinal monitoring of genes and pathways changes in mCRC patients.
Representation of longitudinal timeline for 24 patients, 12 with no recurrence (a) and 12 with recurrence (b). Average cancer proportions for all patients at each time point is shown at the right of the timeline and mean ssGSEA scores for all cases is shown below. The imputed cancer fraction was estimated using CIBERSORTx. Subsequently, the liquid biopsy samples were deconvoluted using CODEFACS, and the resulting tumor-derived transcripts were utilized as input for ssGSEA analysis. c, Differential gene expression at NED2 for patients with no recurrence (yellow) and recurrence (red). Patients are shown as columns. d, Average ssGSEA scores for pathways that showed significant differences based on a paired t-test between the baseline draw and the progression time point for the stable disease cohort.
Figure 5.
Figure 5.. Prediction of gene fusions in plasma-derived evRNA.
a, Quantification of gene fusions in patients with and without recurrence. b-d, Structural representation of gene fusions and circle plot depicting main chromosomal aberrations in a patient with recurrence (patient ID7). Fusions at baseline (b, VCPIP1:MAPK1), NED2 (c, PTPRK;FAM120B) and recurrence (d, KRAS:SENP6) are depicted.

References

    1. Cohen JD, Li L, Wang Y, Thoburn C, Afsari B, Danilova L, et al. Detection and localization of surgically resectable cancers with a multi-analyte blood test. Science. 2018;359(6378):926–30. - PMC - PubMed
    1. Shen SY, Singhania R, Fehringer G, Chakravarthy A, Roehrl MHA, Chadwick D, et al. Sensitive tumour detection and classification using plasma cell-free DNA methylomes. Nature. 2018;563(7732):579–83. - PubMed
    1. Cristiano S, Leal A, Phallen J, Fiksel J, Adleff V, Bruhm DC, et al. Genome-wide cell-free DNA fragmentation in patients with cancer. Nature. 2019;570(7761):385–9. - PMC - PubMed
    1. Liu MC, Oxnard GR, Klein EA, Swanton C, Seiden MV, Consortium C. Sensitive and specific multi-cancer detection and localization using methylation signatures in cell-free DNA. Ann Oncol. 2020;31(6):745–59. - PMC - PubMed
    1. Larson MH, Pan W, Kim HJ, Mauntz RE, Stuart SM, Pimentel M, et al. A comprehensive characterization of the cell-free transcriptome reveals tissue- and subtype-specific biomarkers for cancer detection. Nat Commun. 2021;12(1):2357. - PMC - PubMed

MeSH terms