. 2024 May 15;30(10):2245-2259.
doi: 10.1158/1078-0432.CCR-23-2654.

Targeting CCL2/CCR2 Signaling Overcomes MEK Inhibitor Resistance in Acute Myeloid Leukemia

Affiliations

Targeting CCL2/CCR2 Signaling Overcomes MEK Inhibitor Resistance in Acute Myeloid Leukemia

Rucha V Modak et al. Clin Cancer Res. .

Abstract

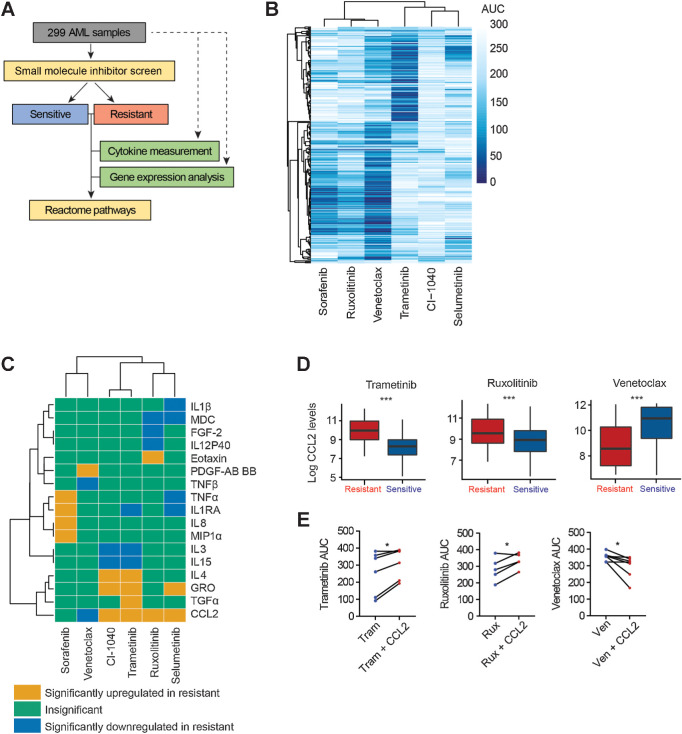
Purpose: Emerging evidence underscores the critical role of extrinsic factors within the microenvironment in protecting leukemia cells from therapeutic interventions, driving disease progression, and promoting drug resistance in acute myeloid leukemia (AML). This finding emphasizes the need for the identification of targeted therapies that inhibit intrinsic and extrinsic signaling to overcome drug resistance in AML.

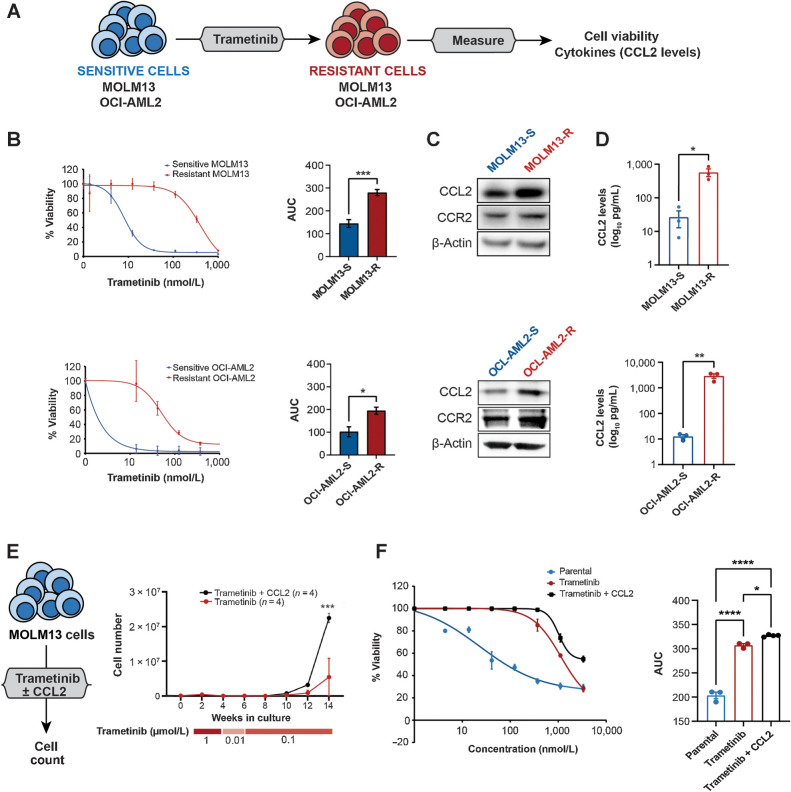
Experimental design: We performed a comprehensive analysis utilizing a cohort of ∼300 AML patient samples. This analysis encompassed the evaluation of secreted cytokines/growth factors, gene expression, and ex vivo drug sensitivity to small molecules. Our investigation pinpointed a notable association between elevated levels of CCL2 and diminished sensitivity to the MEK inhibitors (MEKi). We validated this association through loss-of-function and pharmacologic inhibition studies. Further, we deployed global phosphoproteomics and CRISPR/Cas9 screening to identify the mechanism of CCR2-mediated MEKi resistance in AML.

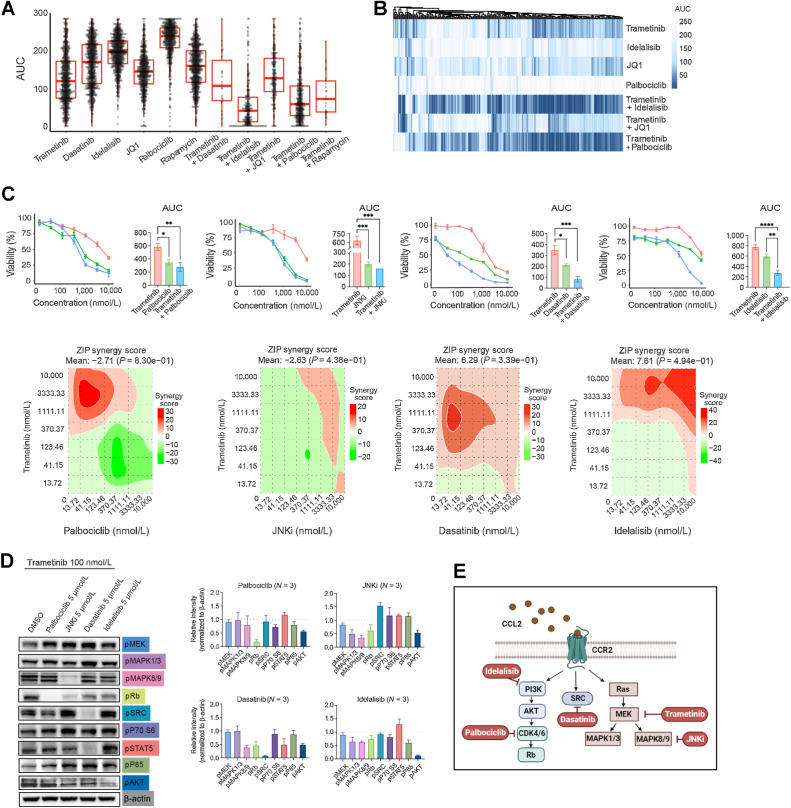
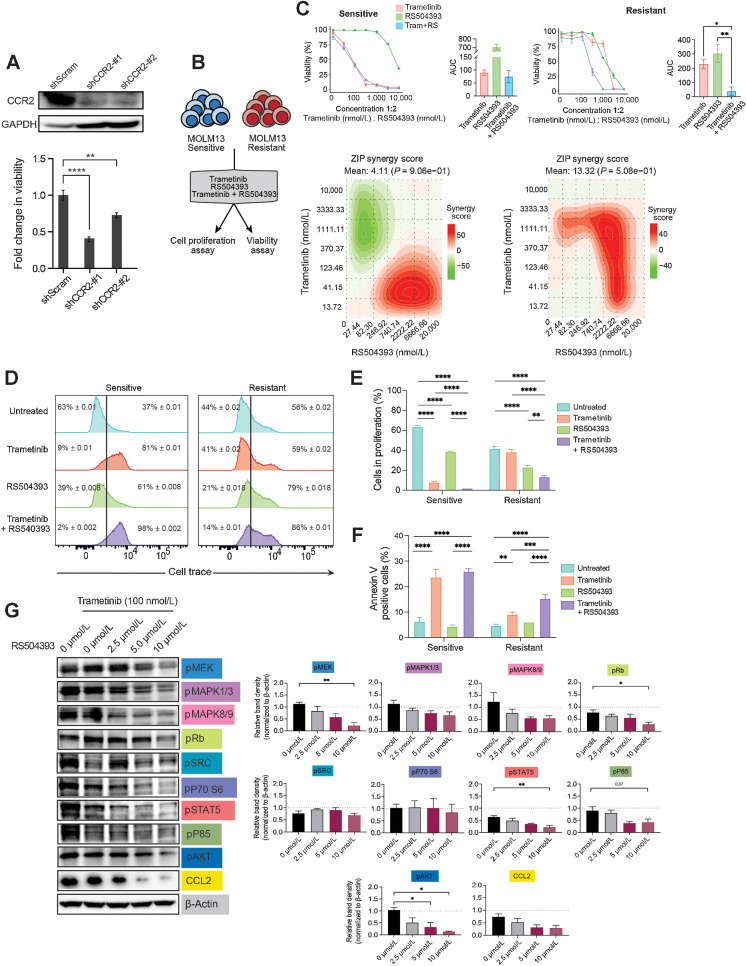
Results: Our multifaceted analysis unveiled that CCL2 activates multiple prosurvival pathways, including MAPK and cell-cycle regulation in MEKi-resistant cells. Employing combination strategies to simultaneously target these pathways heightened growth inhibition in AML cells. Both genetic and pharmacologic inhibition of CCR2 sensitized AML cells to trametinib, suppressing proliferation while enhancing apoptosis. These findings underscore a new role for CCL2 in MEKi resistance, offering combination therapies as an avenue to circumvent this resistance.

Conclusions: Our study demonstrates a compelling rationale for translating CCL2/CCR2 axis inhibitors in combination with MEK pathway-targeting therapies, as a potent strategy for combating drug resistance in AML. This approach has the potential to enhance the efficacy of treatments to improve AML patient outcomes.


Figures

Figure 1. Distinct cytokines and signaling pathways are associated with drug responses in AML. A, Representation of the data integration approach from 299 primary AML samples. Secreted cytokine levels using plasma derived from 299 AML patient samples, and the Beat AML database was leveraged for the ex vivo drug sensitivity and gene expression analysis for the matched samples. The drug screening data were classified as sensitive or resistant based on AUC for each drug and were integrated with the cytokine, RNA-seq, and Reactome pathway analysis. B, Hierarchical clustering of AUC for the indicated inhibitors for the 299 AML samples. C, Heat map constructed by integrating the cytokine expression data with ex vivo sensitivity profile of the inhibitors. Statistical significance was determined by t test with P value <0.05 as significant. D, CCL2 protein levels for AML patient samples sensitive and resistant to trametinib, ruxolitinib, and venetoclax from Fig. 1C. The measured abundance of CCL2 was log2-transformed in the plot. E, Ex vivo drug response of primary AML cells treated with the indicated inhibitors on a concentration gradient with or without 10 ng/mL CCL2 for 72 hours. Viability was determined by the MTS assay cell viability assay, and the results are represented as the AUC of individual samples (trametinib:Tram = 6, ruxolitinib: Rux n = 5, venetoclax: Ven n = 7). Statistical significance was determined by the two-tailed paired Student t test. *, P ≤0.05 and ***, P ≤ 0.001.
Figure 1.
Distinct cytokines and signaling pathways are associated with drug responses in AML. A, Representation of the data integration approach from 299 primary AML samples. Secreted cytokine levels using plasma derived from 299 AML patient samples, and the Beat AML database was leveraged for the ex vivo drug sensitivity and gene expression analysis for the matched samples. The drug screening data were classified as sensitive or resistant based on AUC for each drug and were integrated with the cytokine, RNA-seq, and Reactome pathway analysis. B, Hierarchical clustering of AUC for the indicated inhibitors for the 299 AML samples. C, Heat map constructed by integrating the cytokine expression data with ex vivo sensitivity profile of the inhibitors. Statistical significance was determined by t test with P value <0.05 as significant. D, CCL2 protein levels for AML patient samples sensitive and resistant to trametinib, ruxolitinib, and venetoclax from Fig. 1C. The measured abundance of CCL2 was log2-transformed in the plot. E,Ex vivo drug response of primary AML cells treated with the indicated inhibitors on a concentration gradient with or without 10 ng/mL CCL2 for 72 hours. Viability was determined by the MTS assay cell viability assay, and the results are represented as the AUC of individual samples (trametinib:Tram = 6, ruxolitinib: Rux n = 5, venetoclax: Ven n = 7). Statistical significance was determined by the two-tailed paired Student t test. *, P ≤0.05 and ***, P ≤ 0.001.
Figure 2. Increased CCL2 levels are associated with trametinib resistance in AML. A, The generation of trametinib-resistant MOLM13 and OCI-AML2 cell lines. These AML cell lines were made resistant to trametinib by culturing the cells in gradually increasing concentrations of trametinib starting over 12 weeks as described in methods and maintained in trametinib by replacing media twice weekly. B, Viability of trametinib-sensitive (S) and -resistant (R) MOLM13 and OCI-AML2 cells across the indicated concentrations of trametinib as measured by colorimetric cell viability (MTS) assay (left) and their AUC (right). The data are shown as mean ± SEM from three technical replicates, representative of at least three independent experiments. Significance is determined using two-tailed Student t test. C, Representative immunoblots from trametinib-sensitive (S) and -resistant (R) MOLM13 and OCI-AML2 cells probed for CCL2 and CCR2. β-Actin was used as a loading control. D, Levels of CCL2 from the supernatant of sensitive and resistant MOLM13 and OCI-AML2 cells are shown as a log10 scale expressed as pg/mL. Mean values from three independent experiments are shown with significance calculated by the unpaired two-tailed Student t test. E, MOLM13 trametinib-sensitive AML cell lines cultured with trametinib (0.01–1 μmol/L) ± CCL2 (10 ng/mL) for 14 weeks (n = 4). The media was replaced with fresh trametinib and CCL2 twice weekly. Once resistance was established, resistant cell lines were maintained in 100 nmol/L trametinib ± CCL2. Total viable cell numbers over 14 weeks in culture are represented. Significance was determined using the two-way ANOVA. F, Cell viability of trametinib-sensitive (parental) and -resistant MOLM13 cells cultured ± CCL2 from Fig. 2E treated with the indicated concentrations of trametinib as measured using the MTS assay (left) and AUC (right). The data are shown as mean ± SEM from three technical replicates; representative of three independent experiments; significance determined by the one-way ANOVA. *, P ≤ 0.05; **, P ≤ 0.01; ***, P ≤ 0.001; ****, P ≤ 0.0001.
Figure 2.
Increased CCL2 levels are associated with trametinib resistance in AML. A, The generation of trametinib-resistant MOLM13 and OCI-AML2 cell lines. These AML cell lines were made resistant to trametinib by culturing the cells in gradually increasing concentrations of trametinib starting over 12 weeks as described in methods and maintained in trametinib by replacing media twice weekly. B, Viability of trametinib-sensitive (S) and -resistant (R) MOLM13 and OCI-AML2 cells across the indicated concentrations of trametinib as measured by colorimetric cell viability (MTS) assay (left) and their AUC (right). The data are shown as mean ± SEM from three technical replicates, representative of at least three independent experiments. Significance is determined using two-tailed Student t test. C, Representative immunoblots from trametinib-sensitive (S) and -resistant (R) MOLM13 and OCI-AML2 cells probed for CCL2 and CCR2. β-Actin was used as a loading control. D, Levels of CCL2 from the supernatant of sensitive and resistant MOLM13 and OCI-AML2 cells are shown as a log10 scale expressed as pg/mL. Mean values from three independent experiments are shown with significance calculated by the unpaired two-tailed Student t test. E, MOLM13 trametinib-sensitive AML cell lines cultured with trametinib (0.01–1 μmol/L) ± CCL2 (10 ng/mL) for 14 weeks (n = 4). The media was replaced with fresh trametinib and CCL2 twice weekly. Once resistance was established, resistant cell lines were maintained in 100 nmol/L trametinib ± CCL2. Total viable cell numbers over 14 weeks in culture are represented. Significance was determined using the two-way ANOVA. F, Cell viability of trametinib-sensitive (parental) and -resistant MOLM13 cells cultured ± CCL2 from Fig. 2E treated with the indicated concentrations of trametinib as measured using the MTS assay (left) and AUC (right). The data are shown as mean ± SEM from three technical replicates; representative of three independent experiments; significance determined by the one-way ANOVA. *, P ≤ 0.05; **, P ≤ 0.01; ***, P ≤ 0.001; ****, P ≤ 0.0001.
Figure. 3. CCL2 or trametinib exposure activated prosurvival pathways in parental and trametinib-resistant AML cells. A, MOLM13 parental cells and treatment conditions used for phospho- and global proteomics. B, Kinase-substrate enrichment analysis (KSEA) of the enriched substrates for indicated kinases (P < 0.05) from the AML cells upon 60 minutes of trametinib, CCL2, or combination treatments. Red bars indicate increased activity for phosphokinases and blue bars indicate reduced activity relative to parental trametinib-sensitive MOLM13. C, Workflow of genome-wide CRISPR-Cas9 resensitization screen. Cas9 expressing MOLM13 trametinib-resistant cell line, cultured with CCL2, generated as described in Fig. 2E was transduced with the genome-wide CRISPR library. After puromycin selection, cells were treated with 100 nmol/L trametinib or DMSO for 14 days followed by DNA extraction and PCR amplification of the sgRNA barcodes. The resulting PCR library was subjected to NGS sequencing, and the data were analyzed for depleted and enriched sgRNA in trametinib-treated versus DMSO controls. D, Volcano plot of differential enrichment of sgRNA in trametinib-treated (100 nmol/L) versus DMSO-treated control AML cells, analyzed at day 14 of drug exposure. Mid log-fold change versus P values expressed as (−log10) are plotted with colors denoting the tiers associated with the ranking system for genes based on the statistically significant changes in guide numbers and guide/gene representation. E, Enrichment score plot for the MAPK1/3 signature that is significantly enriched in depleted sgRNA in trametinib-treated versus DMSO control (F) MOLM13 trametinib-resistant cells were transduced with sgRNA targeting MAPK1/2, NRAS, and PIK3CD genes and a nontargeting (NT) control. Viability was calculated using the indicated trametinib concentrations measured after 72 hours of treatment using an MTS assay. Representative of two independent experiments with consistent results using sgRNA to knockout each target gene. G, Pathways with altered protein levels downstream of CCL2 that can be combinatorically targeted with trametinib to mitigate AML cell survival and overcome trametinib resistance.
Figure. 3.
CCL2 or trametinib exposure activated prosurvival pathways in parental and trametinib-resistant AML cells. A, MOLM13 parental cells and treatment conditions used for phospho- and global proteomics. B, Kinase-substrate enrichment analysis (KSEA) of the enriched substrates for indicated kinases (P < 0.05) from the AML cells upon 60 minutes of trametinib, CCL2, or combination treatments. Red bars indicate increased activity for phosphokinases and blue bars indicate reduced activity relative to parental trametinib-sensitive MOLM13. C, Workflow of genome-wide CRISPR-Cas9 resensitization screen. Cas9 expressing MOLM13 trametinib-resistant cell line, cultured with CCL2, generated as described in Fig. 2E was transduced with the genome-wide CRISPR library. After puromycin selection, cells were treated with 100 nmol/L trametinib or DMSO for 14 days followed by DNA extraction and PCR amplification of the sgRNA barcodes. The resulting PCR library was subjected to NGS sequencing, and the data were analyzed for depleted and enriched sgRNA in trametinib-treated versus DMSO controls. D, Volcano plot of differential enrichment of sgRNA in trametinib-treated (100 nmol/L) versus DMSO-treated control AML cells, analyzed at day 14 of drug exposure. Mid log-fold change versus P values expressed as (−log10) are plotted with colors denoting the tiers associated with the ranking system for genes based on the statistically significant changes in guide numbers and guide/gene representation. E, Enrichment score plot for the MAPK1/3 signature that is significantly enriched in depleted sgRNA in trametinib-treated versus DMSO control (F) MOLM13 trametinib-resistant cells were transduced with sgRNA targeting MAPK1/2, NRAS, and PIK3CD genes and a nontargeting (NT) control. Viability was calculated using the indicated trametinib concentrations measured after 72 hours of treatment using an MTS assay. Representative of two independent experiments with consistent results using sgRNA to knockout each target gene. G, Pathways with altered protein levels downstream of CCL2 that can be combinatorically targeted with trametinib to mitigate AML cell survival and overcome trametinib resistance.
Figure. 4. Targeting PI3K/AKT, MAPK, or cell-cycle pathways overcomes drug resistance mediated by CCL2. A, Boxplots with AUC values from ex vivo drug response curves for trametinib or the indicated agent alone and in combination with trametinib for indicated drugs for AML patient samples from the Beat AML dataset. B, Unsupervised clustering analyses of the data from A. C, Top: Comparisons of drug–response curves of MOLM13 trametinib-resistant cells treated with trametinib, tested as single agents or in combination with palbociclib, JNKi, dasatinib, and idelalisib with a dose gradient of 0.004 to 10 μmol/L, and their respective AUC. Statistical significance was determined using the one-way ANOVA. Bottom: Analyses of corresponding synergy matrix with red indicating synergistic action calculated using SynergyFinder. D, Immunoblot analysis of the trametinib-resistant MOLM13 cell line treated with trametinib (100 nmol/L) alone or in combination with palbociclib (5 μmol/L), JNKi (5 μmol/L), dasatinib (5 μmol/L), and idelalisib (5 μmol/L) as indicated. Relative band intensities from three independent experiments were measured with ImageJ, normalized to β-actin, and represented relative to DMSO-only treatment control, which is represented as a dashed line. E, Pathways targeted by specific small-molecule inhibitors used in A–D, in combination with trametinib, which were found activated in trametinib-resistant AML cells downstream of CCL2. *, P ≤ 0.05; **, P ≤ 0.01; ***, P ≤ 0.001; ****, P ≤ 0.0001.
Figure. 4.
Targeting PI3K/AKT, MAPK, or cell-cycle pathways overcomes drug resistance mediated by CCL2. A, Boxplots with AUC values from ex vivo drug response curves for trametinib or the indicated agent alone and in combination with trametinib for indicated drugs for AML patient samples from the Beat AML dataset. B, Unsupervised clustering analyses of the data from A. C, Top: Comparisons of drug–response curves of MOLM13 trametinib-resistant cells treated with trametinib, tested as single agents or in combination with palbociclib, JNKi, dasatinib, and idelalisib with a dose gradient of 0.004 to 10 μmol/L, and their respective AUC. Statistical significance was determined using the one-way ANOVA. Bottom: Analyses of corresponding synergy matrix with red indicating synergistic action calculated using SynergyFinder. D, Immunoblot analysis of the trametinib-resistant MOLM13 cell line treated with trametinib (100 nmol/L) alone or in combination with palbociclib (5 μmol/L), JNKi (5 μmol/L), dasatinib (5 μmol/L), and idelalisib (5 μmol/L) as indicated. Relative band intensities from three independent experiments were measured with ImageJ, normalized to β-actin, and represented relative to DMSO-only treatment control, which is represented as a dashed line. E, Pathways targeted by specific small-molecule inhibitors used in A–D, in combination with trametinib, which were found activated in trametinib-resistant AML cells downstream of CCL2. *, P ≤ 0.05; **, P ≤ 0.01; ***, P ≤ 0.001; ****, P ≤ 0.0001.
Figure. 5. Targeting CCR2 in combination with trametinib reduced AML cell viability, cell proliferation, and induced apoptosis. A, Immunoblot analysis of CCR2 using trametinib-resistant MOLM13 cells expressing shRNAs for scrambled control and CCR2 (sh#1 and sh#2). GAPDH was used as a loading control (top). An equal number of cells was plated, and the viability of shRNA-transduced cells was determined by an MTS cell viability assay after 72 hours in culture. The data are represented as fold change over scrambled control shRNAs. Statistical significance was determined via the two-way ANOVA. B, The cell proliferation and viability assays performed with MOLM13 trametinib-resistant and sensitive cell lines. C, Drug–response curve of trametinib-sensitive (S) and -resistant (R) MOLM13 cells treated with trametinib (0.004–10 μmol/L) and RS540393 (0.008–20 μmol/L) for 7 days, as determined using the MTS cell viability assay. Significance was calculated using one-way ANOVA with multiple comparisons, where P ≤ 0.05 was considered significant. D, Representative flow cytometry histograms showing levels of cell trace violet in the sensitive and trametinib-resistant MOLM13 cell lines after 48 hours of treatment with either 100 nmol/L trametinib or 2.5 μmol/L RS504393, or their combination. E, Bar graphs of data in D, representing the percentage of proliferating cells compared with untreated control in respective cell lines. Data are plotted as mean ± SEM. Significance as calculated using the two-way ANOVA. The data are representative of three independent experiments. F, Representative plots of Annexin V and 7-AAD staining from trametinib-sensitive (S) and -resistant (R) MOLM13 cells treated with 100 nmol/L trametinib or 2.5 μmol/L RS504393 or a combination of both for 72 hours. Significance was calculated using the two-way ANOVA. The data are representative of three independent experiments. G, Immunoblot analysis of the trametinib-resistant line treated with trametinib (100 nmol/L) in combination with RS504393 across the indicated concentrations (left). Relative band densities of immunoblots (right) were measured using ImageJ, normalized to β-actin and represented relative to DMSO-only treatment control, which is shown as a dashed line. *, P ≤ 0.05; **, P ≤ 0.01; ***, P ≤ 0.001; ****, P ≤ 0.0001.
Figure. 5.
Targeting CCR2 in combination with trametinib reduced AML cell viability, cell proliferation, and induced apoptosis. A, Immunoblot analysis of CCR2 using trametinib-resistant MOLM13 cells expressing shRNAs for scrambled control and CCR2 (sh#1 and sh#2). GAPDH was used as a loading control (top). An equal number of cells was plated, and the viability of shRNA-transduced cells was determined by an MTS cell viability assay after 72 hours in culture. The data are represented as fold change over scrambled control shRNAs. Statistical significance was determined via the two-way ANOVA. B, The cell proliferation and viability assays performed with MOLM13 trametinib-resistant and sensitive cell lines. C, Drug–response curve of trametinib-sensitive (S) and -resistant (R) MOLM13 cells treated with trametinib (0.004–10 μmol/L) and RS540393 (0.008–20 μmol/L) for 7 days, as determined using the MTS cell viability assay. Significance was calculated using one-way ANOVA with multiple comparisons, where P ≤ 0.05 was considered significant. D, Representative flow cytometry histograms showing levels of cell trace violet in the sensitive and trametinib-resistant MOLM13 cell lines after 48 hours of treatment with either 100 nmol/L trametinib or 2.5 μmol/L RS504393, or their combination. E, Bar graphs of data in D, representing the percentage of proliferating cells compared with untreated control in respective cell lines. Data are plotted as mean ± SEM. Significance as calculated using the two-way ANOVA. The data are representative of three independent experiments. F, Representative plots of Annexin V and 7-AAD staining from trametinib-sensitive (S) and -resistant (R) MOLM13 cells treated with 100 nmol/L trametinib or 2.5 μmol/L RS504393 or a combination of both for 72 hours. Significance was calculated using the two-way ANOVA. The data are representative of three independent experiments. G, Immunoblot analysis of the trametinib-resistant line treated with trametinib (100 nmol/L) in combination with RS504393 across the indicated concentrations (left). Relative band densities of immunoblots (right) were measured using ImageJ, normalized to β-actin and represented relative to DMSO-only treatment control, which is shown as a dashed line. *, P ≤ 0.05; **, P ≤ 0.01; ***, P ≤ 0.001; ****, P ≤ 0.0001.

References

    1. 2018 National Cancer Institute: Surveillance, Epidemiology, and End Results Program. Available from: https://seer.cancer.gov/statfacts/.
    1. Jemal A, Siegel R, Xu J, Ward E. Cancer statistics 2010. CA Cancer J Clin 2010;60:277–300. - PubMed
    1. Papaemmanuil E, Gerstung M, Bullinger L, Gaidzik VI, Paschka P, Roberts ND, et al. . Genomic classification and prognosis in acute myeloid leukemia. N Engl J Med 2016;374:2209–21. - PMC - PubMed
    1. TCGA. Genomic and epigenomic landscapes of adult de novo acute myeloid leukemia. N Engl J Med 2013;368:2059–74. - PMC - PubMed
    1. Tyner JW, Tognon CE, Bottomly D, Wilmot B, Kurtz SE, Savage SL, et al. . Functional genomic landscape of acute myeloid leukaemia. Nature 2018;562:526–31. - PMC - PubMed

MeSH terms