

Phospholipase D regulates ferroptosis signal transduction in mouse spleen hypoxia response
- PMID: 38451609
- PMCID: PMC10913393
- DOI: 10.1590/1414-431X2023e13218
Phospholipase D regulates ferroptosis signal transduction in mouse spleen hypoxia response
Abstract
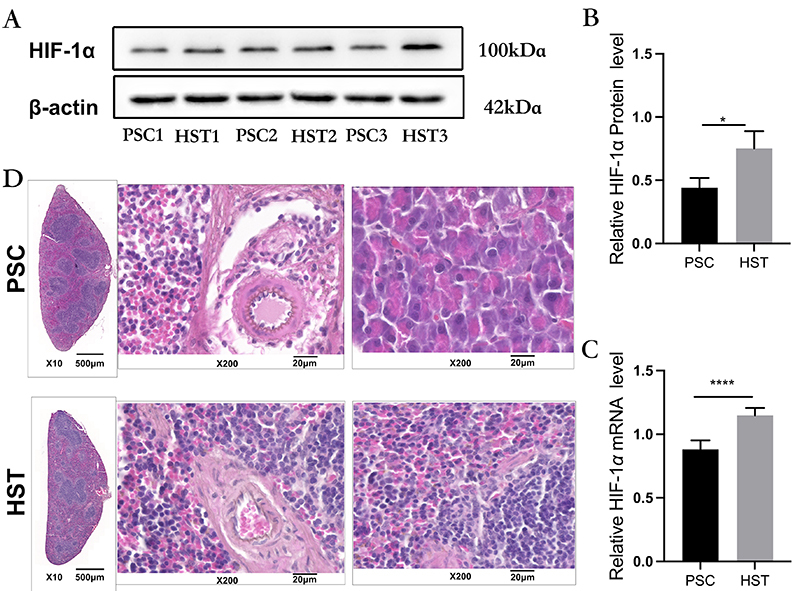
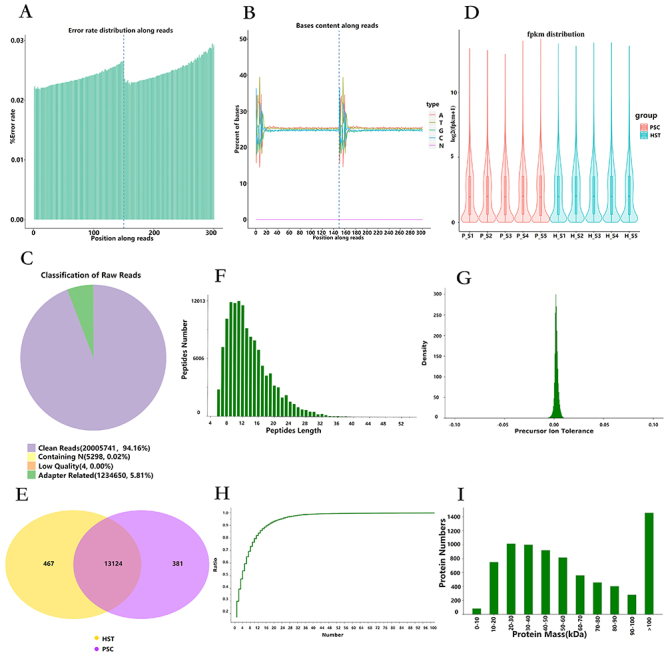
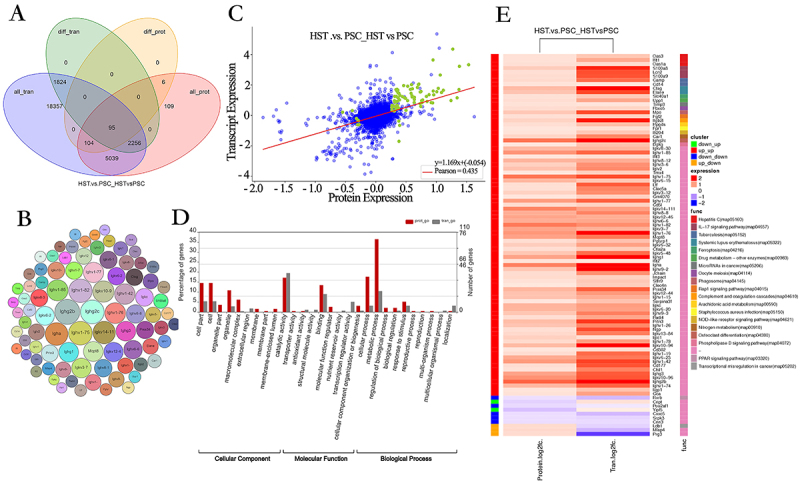
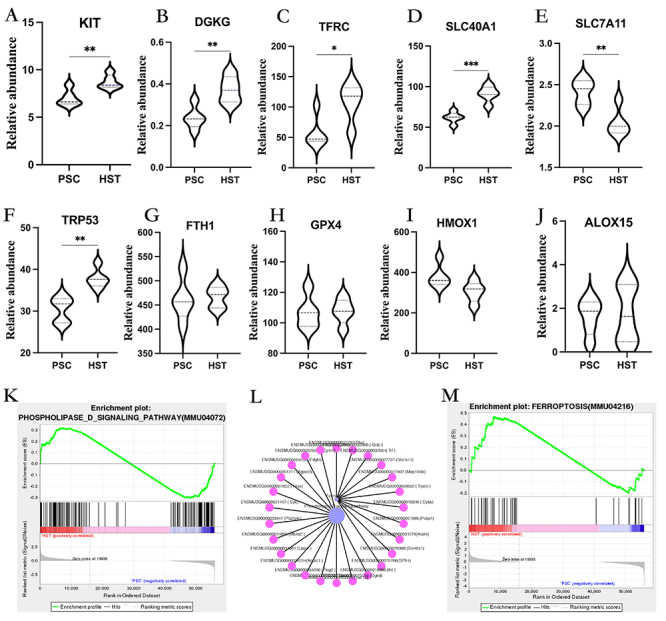
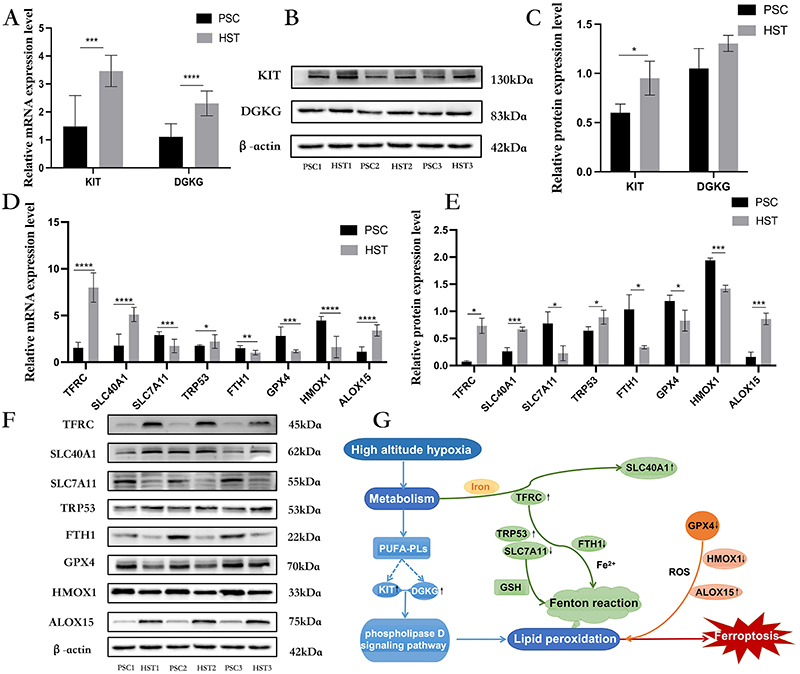
High-altitude hypoxia exposure can lead to phospholipase D-mediated lipid metabolism disorder in spleen tissues and induce ferroptosis. Nonetheless, the key genes underlying hypoxia-induced splenic phospholipase D and the ferroptosis pathway remain unclear. This study aimed to establish a hypoxia animal model. Combined transcriptomic and proteomic analyses showed that 95 predicted target genes (proteins) were significantly differentially expressed under hypoxic conditions. Key genes in phospholipase D and ferroptosis pathways under hypoxic exposure were identified by combining Gene Ontology (GO) and Kyoto Encyclopedia of Genes and Genomes (KEGG) enrichment analysis techniques. Gene set enrichment analysis (GSEA) showed that the differential gene sets of the phospholipase D and ferroptosis signaling pathways were upregulated in the high-altitude hypoxia group. The genes in the phospholipase D signalling pathway were verified, and the expression levels of KIT and DGKG were upregulated in spleen tissues under hypoxic exposure. Subsequently, the mRNA and protein expression levels of genes from the exogenous pathway such as TFRC, SLC40A1, SLC7A11, TRP53, and FTH1 and those from the endogenous pathway such as GPX4, HMOX1, and ALOX15 differentials in the ferroptosis signalling pathway were verified, and the results indicated significant differential expression. In summary, exposure to high-altitude hypoxia mediated phospholipid metabolism disturbance through the phospholipase D signalling pathway and further induced ferroptosis, leading to splenic injury.
Figures
Similar articles
-
[Changes of ferroptosis related pathways in hippocampus of mice exposed to high-altitude hypoxia].Sheng Li Xue Bao. 2024 Aug 25;76(4):507-516. Sheng Li Xue Bao. 2024. PMID: 39192784 Chinese.
-
[Mechanism of IL-17 Signaling Pathway in Spleen Inflammatory Response Induced by Altitude Hypoxia in Mice].Sichuan Da Xue Xue Bao Yi Xue Ban. 2024 Jan 20;55(1):118-124. doi: 10.12182/20240160208. Sichuan Da Xue Xue Bao Yi Xue Ban. 2024. PMID: 38322537 Free PMC article. Chinese.
-
[Molecular mechanism of high-altitude hypoxia-induced lipid metabolism disorder in mouse spleen tissue].Nan Fang Yi Ke Da Xue Xue Bao. 2024 Oct 20;44(10):2024-2032. doi: 10.12122/j.issn.1673-4254.2024.10.21. Nan Fang Yi Ke Da Xue Xue Bao. 2024. PMID: 39523103 Free PMC article. Chinese.
-
High-altitude hypoxia exposure inhibits erythrophagocytosis by inducing macrophage ferroptosis in the spleen.Elife. 2024 Apr 17;12:RP87496. doi: 10.7554/eLife.87496. Elife. 2024. PMID: 38629942 Free PMC article.
-
Astragaloside IV regulates the ferroptosis signaling pathway via the Nrf2/SLC7A11/GPX4 axis to inhibit PM2.5-mediated lung injury in mice.Int Immunopharmacol. 2022 Nov;112:109186. doi: 10.1016/j.intimp.2022.109186. Epub 2022 Sep 15. Int Immunopharmacol. 2022. PMID: 36115280 Review.
Cited by
-
Redox mechanism of glycerophospholipids and relevant targeted therapy in ferroptosis.Cell Death Discov. 2025 Aug 1;11(1):358. doi: 10.1038/s41420-025-02654-y. Cell Death Discov. 2025. PMID: 40744916 Free PMC article. Review.
References
MeSH terms
Substances
LinkOut - more resources
Full Text Sources
Research Materials
Miscellaneous
