. 2024 May;153(5):1336-1360.
doi: 10.1037/xge0001551. Epub 2024 Mar 7.

A lifespan study of the confidence-accuracy relation in working memory and episodic long-term memory

Affiliations

A lifespan study of the confidence-accuracy relation in working memory and episodic long-term memory

Nathaniel R Greene et al. J Exp Psychol Gen. 2024 May.

Abstract

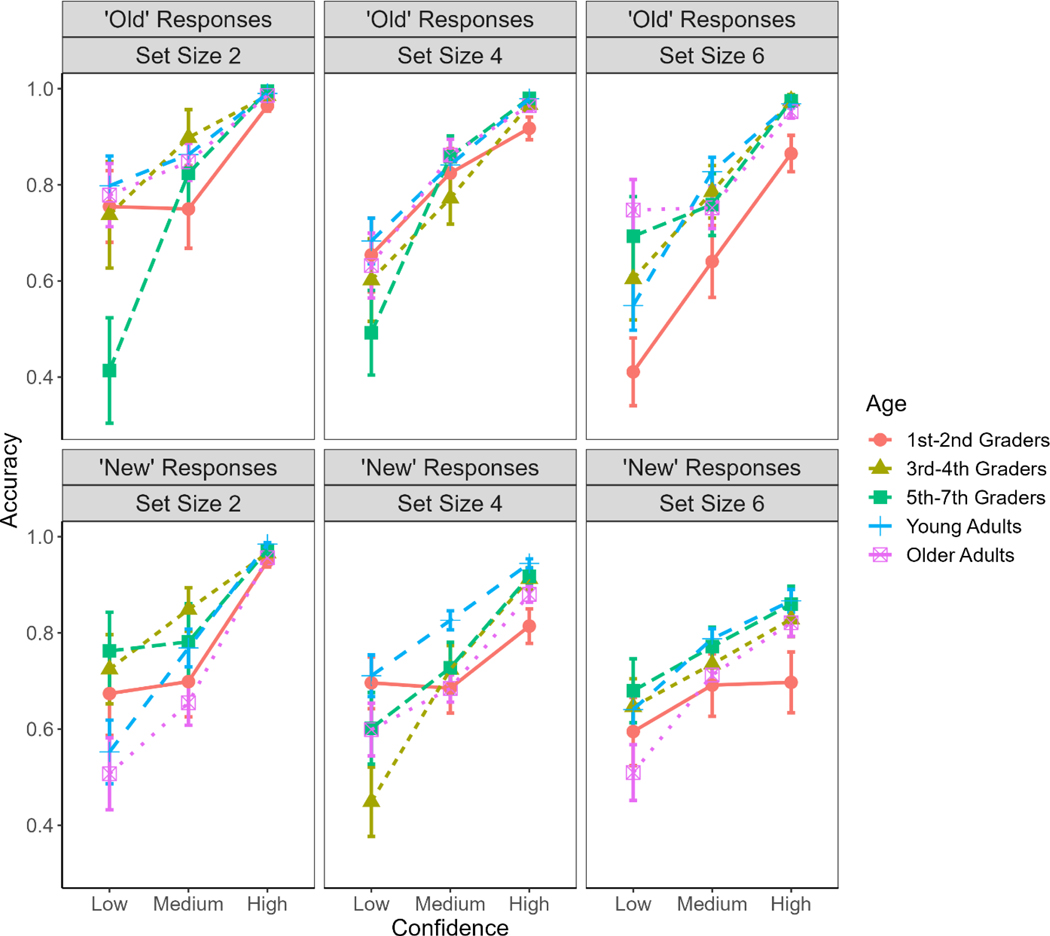
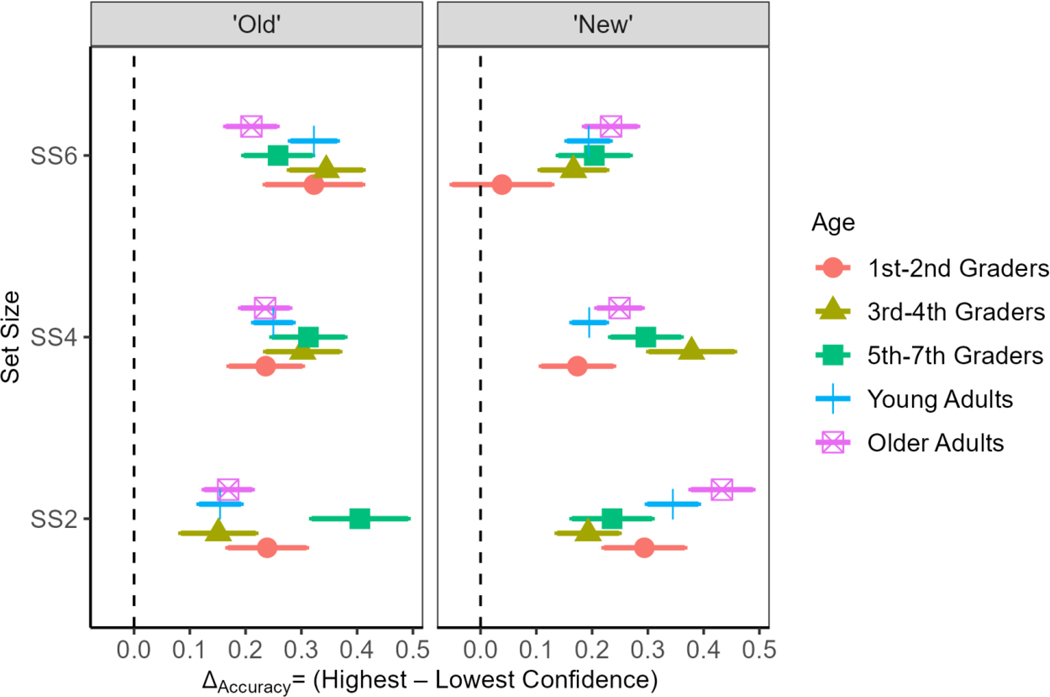
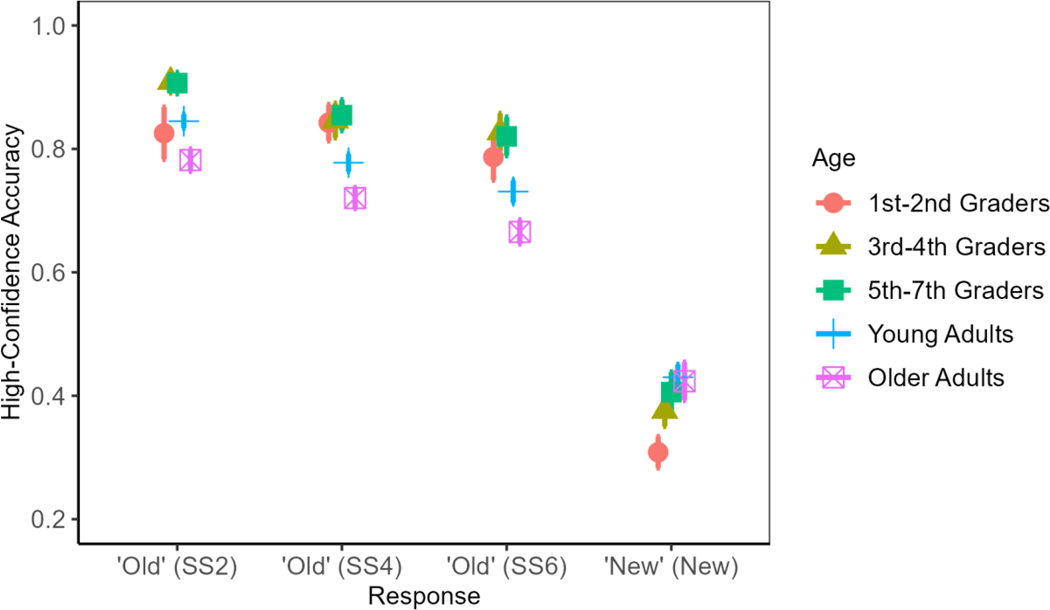
The relation between an individual's memory accuracy and reported confidence in their memories can indicate self-awareness of memory strengths and weaknesses. We provide a lifespan perspective on this confidence-accuracy relation, based on two previously published experiments with 320 participants, including children aged 6-13, young adults aged 18-27, and older adults aged 65-77, across tests of working memory (WM) and long-term memory (LTM). Participants studied visual items in arrays of varying set sizes and completed item recognition tests featuring 6-point confidence ratings either immediately after studying each array (WM tests) or following a long period of study events (LTM tests). Confidence-accuracy characteristic analyses showed that accuracy improved with increasing confidence for all age groups and in both WM and LTM tests. These findings reflect a universal ability across the lifespan to use awareness of the strengths and limitations of one's memories to adjust reported confidence. Despite this age invariance in the confidence-accuracy relation, however, young children were more prone to high-confidence memory errors than other groups in tests of WM, whereas older adults were more susceptible to high-confidence false alarms in tests of LTM. Thus, although participants of all ages can assess when their memories are weaker or stronger, individuals with generally weaker memories are less adept at this confidence-accuracy calibration. Findings also speak to potential different sources of high-confidence memory errors for young children and older adults, relative to young adults. (PsycInfo Database Record (c) 2024 APA, all rights reserved).


Figures

Figure 1.
Figure 1.. Schematic Representation of the Procedure
Note. An outline of a typical trial in working memory (WM; panel A) and long-term memory (LTM: panel B). In the WM task, items were presented around a central fixation cross in arrays of 2, 4, or 6 items (Memory Array in panel A). The presentation duration of a study array was n x 250ms, where n denotes the number of items in the array. Following a 2000ms delay, a WM probe-recognition test occurred (Response Phase in panel A), with one item appearing at the top of the display that was either the same as an item from the previous array or was different. A 6-point rating scale appeared below the item, and participants selected one of the options corresponding to their confidence in whether the item was old or new. After completing all WM trials and following an additional 60 second period of interpolated activity, participants completed LTM probe-recognition tests (panel B), which consisted of a mix of old items from WM arrays which had not been tested on during the WM probe-recognition tests and new items. See online article for color version of figure.
Figure 2.
Figure 2.. Empirical Receiver Operating Characteristic (ROC) Curves
Note. Receiver operating characteristic (ROC) curves that lie closer to the solid diagonal line indicate near-chance discrimination of old and new items, whereas ROC curves that rapidly approach a cumulative hit rate of 1 for low cumulative false alarm rates (near 0) indicate near-perfect discrimination of old and new items. SS2 = set size 2; SS4 = set size 4; SS6 = set size 6; WM = working memory tests (top panels); LTM = long-term memory tests (bottom panels). Participant ages were as follows: 1st-2nd Graders (6-to-8 years old), 3rd-4th Graders (8–10 years old), 5th-7th Graders (10–13 years old), Young Adults (18–27 years old), Older Adults (65–77 years old). See online article for color version of figure.
Figure 3.
Figure 3.. Proportion of Responses at Each Confidence Rating for Each Probe in Working Memory Tests
Note. Error bars represent +/− 1 standard error of the mean. Ratings are ordered as follows: 1 (high-confidence “new” responses), 2 (medium-confidence “new” responses), 3 (low-confidence “new” responses), 4 (low-confidence “old” responses), 5 (medium-confidence “old” responses), 6 (high-confidence “old” responses). SS2 = Set Size 2, SS4 = Set Size 4, SS6 = Set Size 6. See online article for color version of figure.
Figure 4.
Figure 4.. Confidence-Accuracy Characteristic (CAC) Curves for Working Memory Tests
Note. Error bars represent +/− 1 standard error of the mean. Lines between confidence ratings are intended to show the direction of the change in accuracy across adjacent confidence ratings, but the data are measured on a discrete scale. Set Size refers to the number of items (2, 4, or 6) studied concurrently in the study phase of the working memory trial. The confidence rating corresponds to how certain participants were when responding “old” or “new” to test probes in the recognition test. Memory accuracy at each confidence level was computed separately for “old” and “new” recognition responses. For “old” recognition responses, accuracy at each confidence level was calculated as the sum of hits (correct “old” responses to old items) divided by the joint sum of hits and false alarms (incorrect “old” responses to new items) at the respective confidence level. For “new” recognition responses, accuracy at each confidence level was calculated as the sum of correct rejections (correct “new” responses to new items) divided by the joint sum of correct rejections and misses (incorrect “new” responses to old items) at the respective confidence level. See online article for color version of figure.
Figure 5.
Figure 5.. Change in Working Memory Accuracy from Lowest to Highest Endorsed Confidence
Note. Values depict the mean difference in working memory recognition accuracy for “old” (left side) and “new” (right side) responses between the highest and lowest endorsed confidence levels. Error bars represent +/− 1 standard error of the mean. Dashed line at 0.0 corresponds to a point null. SS denotes the set size of the studied array (2, 4, or 6 items). See online article for color version of figure.
Figure 6.
Figure 6.. Proportion of Responses at Each Confidence Rating for Each Probe in Long-Term Memory Tests
Note. Error bars represent +/− 1 standard error of the mean. Ratings are ordered as follows: 1 (high-confidence “new” responses), 2 (medium-confidence “new” responses), 3 (low-confidence “new” responses), 4 (low-confidence “old” responses), 5 (medium-confidence “old” responses), 6 (high-confidence “old” responses). SS indicates the set size (the number of items presented concurrently at encoding) under which the old items were encoded. SS2 = Set Size 2, SS4 = Set Size 4, SS6 = Set Size 6. See online article for color version of figure.
Figure 7.
Figure 7.. Confidence-Accuracy Characteristic (CAC) Curves for Long-Term Memory Tests
Note. Error bars represent +/− 1 standard error of the mean. Lines between confidence ratings are intended to show the direction of the change in accuracy across adjacent confidence ratings, but the data are measured on a discrete scale. SS = Set Size, the number of items (2, 4, or 6) studied concurrently during an earlier study trial. The confidence rating corresponds to how certain participants were when responding “old” or “new” to test probes in the recognition test. Memory accuracy at each confidence level was computed separately for “old” and “new” recognition responses. For “old” recognition responses, accuracy was computed separately based on the set size from which old items were drawn. At each confidence level, accuracy to old items from a given set size was calculated as the proportion of hits (correct “old” responses to old items) at that confidence level divided by the sum of the proportion of hits and proportion of false alarms (incorrect “old” responses to new items) at that confidence level. For “new” recognition responses, accuracy at each confidence level was calculated as the proportion of correct rejections (correct “new” responses to new items) at that confidence level divided by the summed proportion of correct rejections and proportion of misses (incorrect “new” responses to old items, summed across old items from all encoding set sizes) at that confidence level. See online article for color version of figure.
Figure 8.
Figure 8.. Change in Long-Term Memory Accuracy from Lowest to Highest Endorsed Confidence
Note. Values depict the mean difference between highest and lowest endorsed confidence levels in long-term memory recognition accuracy for “old” responses to old items from each set size (SS2, SS4, or SS6) and “new” responses to new items. Error bars represent +/− 1 standard error of the mean. Dashed line at 0.0 corresponds to a point null. Formulas for calculating accuracy are listed in Figure 7 caption. See online article for color version of figure.
Figure 9.
Figure 9.. Change in Memory Accuracy for “Old” Recognition Responses from Lowest to Highest Endorsed Confidence in Tests of Working Memory versus Long-Term Memory
Note. Values depict the mean difference in accuracy (Delta, or Δ) for “old” recognition responses between highest and lowest endorsed level of confidence, separately for tests of working memory (WM) and long-term memory (LTM), within each age group. Error bars represent +/− 1 standard error of the mean. Lines are intended to convey direction of change in Δ between tests of WM and LTM within an age group. SS indicates the encoding set size of the items, with 2, 4, or 6 items per set. See online article for color version of figure.
Figure 10.
Figure 10.. Age-Related Differences in High-Confidence Accuracy in Working Memory
Note. Error bars represent +/− 1 standard error of the mean. Figure depicts how accurate participants were at the highest endorsed confidence rating when responding “old” (left panel) or “new” (right panel) in the working memory tests at each set size (x-axis). See online article for color version of figure.
Figure 11.
Figure 11.. High-Confidence Accuracy in Long-Term Memory
Note. Error bars represent +/− 1 standard error of the mean. Figure depicts how accurate participants were at the highest endorsed confidence rating when responding “old” or “new” in tests of long-term memory. For each type of recognition response, the value in parentheses corresponds to the type of recognition probe for which the response was correct, with “old” recognition responses split by the encoding set size under which old items were studied (SS2, SS4, SS6). See online article for color version of figure.
Figure 12.
Figure 12.. Theoretical Relationship between Memory and Metamemory Monitoring Processes at Encoding or Retrieval Across the Lifespan
Note. The actual memory capabilities represent the average area-under-the-curve (AUC) metric from the tests of working memory and long-term memory of the present study; error bars represent +/− 1 standard error of the mean. See online article for color version of figure.

Similar articles

Cited by

References

    1. Adam KCS, & Vogel EK (2017). Confident failures: Lapses of working memory reveal a metacognitive blindsight. Attention, Perception, & Psychophysics, 79(5), 1506–1523. 10.3758/s13414-017-1331-8 - DOI - PMC - PubMed
    1. Allwood CM, Jonsson A-C, & Granhag PA (2005). The Effects of Source and Type of Feedback on Child Witnesses’ Metamemory Accuracy. Applied Cognitive Psychology, 19(3), 331–344. 10.1002/acp.1071 - DOI
    1. Alvarez JA, & Emory E. (2006). Executive function and the frontal lobes: A meta-analytic review. Neuropsycholigal Review, 16, 17–42. 10.1007/s11065-006-9002-x - DOI - PubMed
    1. Applin JB, & Kibbe MM (2021). Young children monitor the fidelity of visual working memory. Journal of Experimental Psychology: Learning, Memory, and Cognition, 47(5), 808–819. 10.1037/xlm0000971 - DOI - PubMed
    1. Atkinson RC, & Shiffrin RM (1968). Human memory: A proposed system and its control processes. Psychology of Learning and Motivation, 2(4), 89–195. 10.1016/S0079-7421(08)60422-3 - DOI

Publication types