. 2024 Mar 7;9(8):e175462.
doi: 10.1172/jci.insight.175462.

Lack of SPNS1 results in accumulation of lysolipids and lysosomal storage disease in mouse models

Affiliations

Lack of SPNS1 results in accumulation of lysolipids and lysosomal storage disease in mouse models

Hoa Tt Ha et al. JCI Insight. .

Abstract

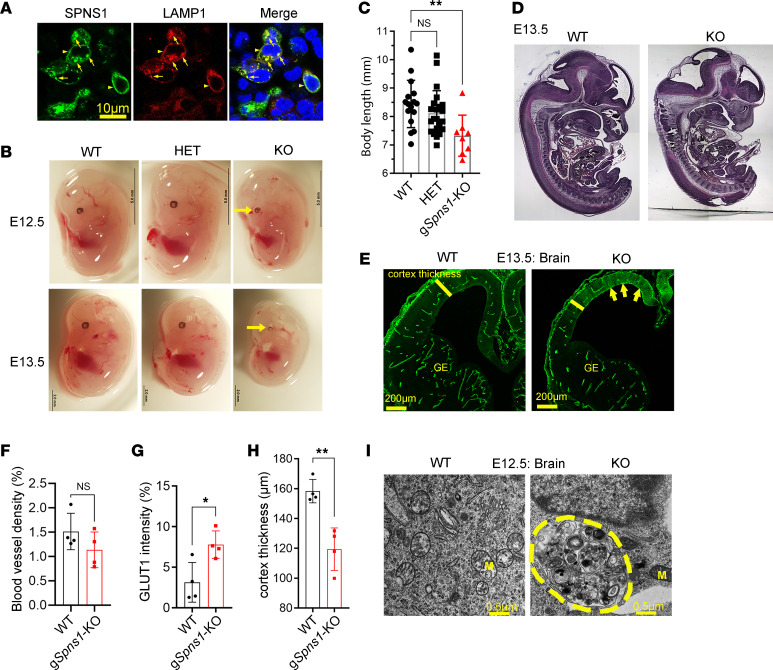
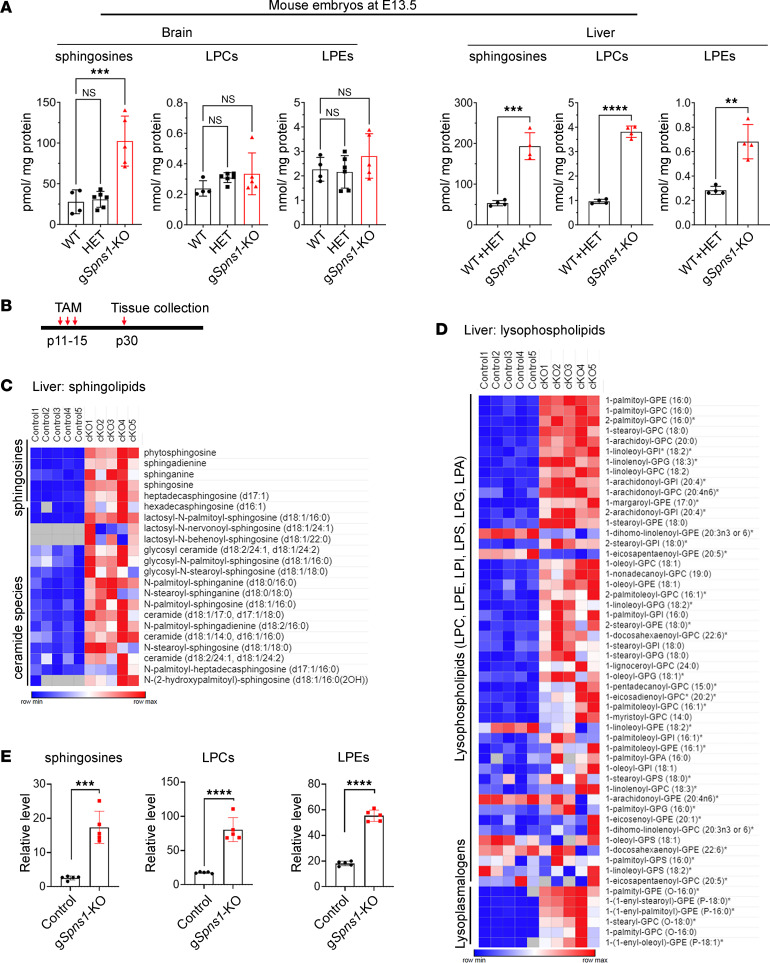
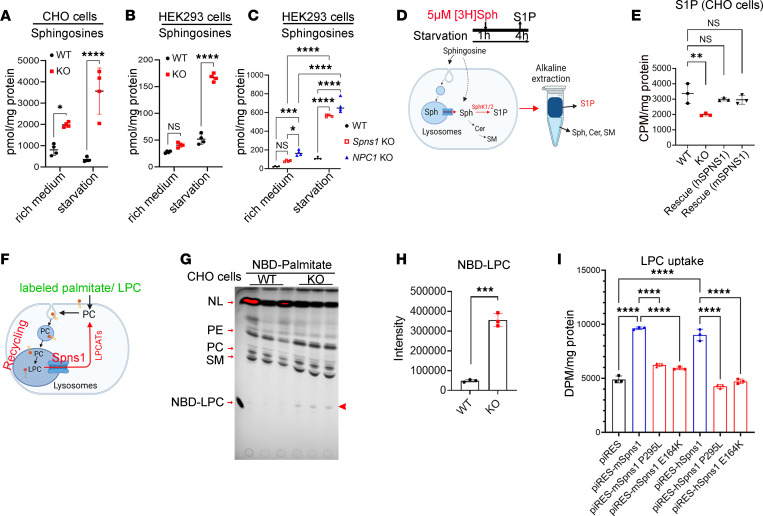
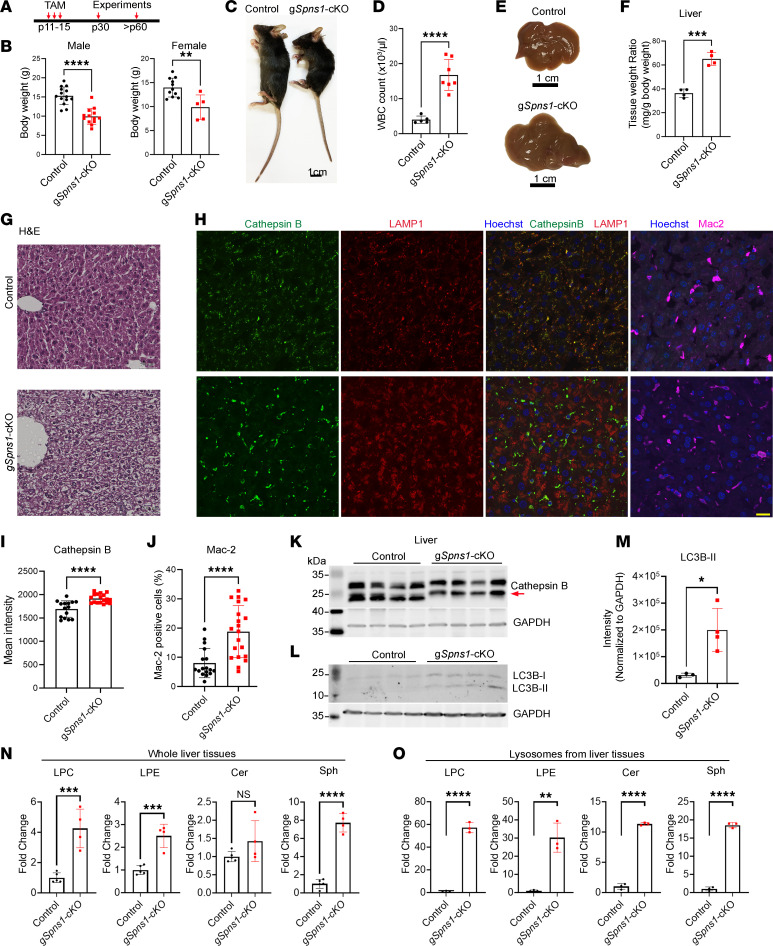
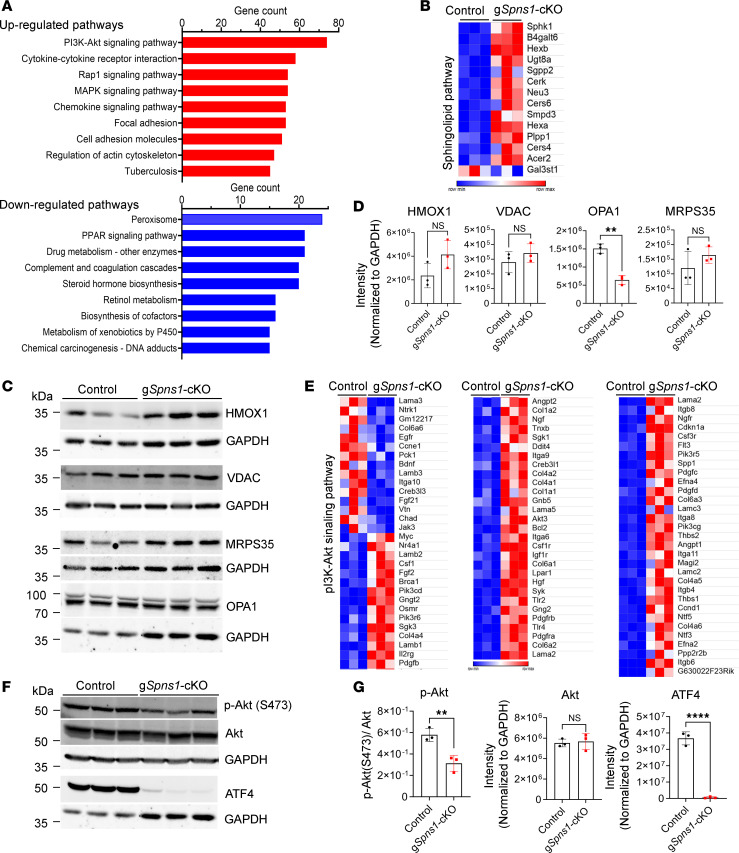
Accumulation of sphingolipids, especially sphingosines, in the lysosomes is a key driver of several lysosomal storage diseases. The transport mechanism for sphingolipids from the lysosome remains unclear. Here, we identified SPNS1, which shares the highest homology to SPNS2, a sphingosine-1-phosphate (S1P) transporter, functions as a transporter for lysolipids from the lysosome. We generated Spns1-KO cells and mice and employed lipidomic and metabolomic approaches to reveal SPNS1 ligand identity. Global KO of Spns1 caused embryonic lethality between E12.5 and E13.5 and an accumulation of sphingosine, lysophosphatidylcholines (LPC), and lysophosphatidylethanolamines (LPE) in the fetal livers. Similarly, metabolomic analysis of livers from postnatal Spns1-KO mice presented an accumulation of sphingosines and lysoglycerophospholipids including LPC and LPE. Subsequently, biochemical assays showed that SPNS1 is required for LPC and sphingosine release from lysosomes. The accumulation of these lysolipids in the lysosomes of Spns1-KO mice affected liver functions and altered the PI3K/AKT signaling pathway. Furthermore, we identified 3 human siblings with a homozygous variant in the SPNS1 gene. These patients suffer from developmental delay, neurological impairment, intellectual disability, and cerebellar hypoplasia. These results reveal a critical role of SPNS1 as a promiscuous lysolipid transporter in the lysosomes and link its physiological functions with lysosomal storage diseases.

Keywords: Aging; Autophagy; Embryonic development; Metabolism; Mouse models.


Conflict of interest statement

Conflict of interest: The authors have declared that no conflict of interest exists.

Figures

Figure 1
Figure 1. SPNS1 is a putative lysosomal transporter that is required for survival in mice.
(A) Localization of SPNS1 in HEK293 cells. Human SPNS1 cDNA was cotransfected with LAMP1-RFP. Spns1 was colocalized with lysosomal marker LAMP1. (B) Representative images of E12.5 and E13.5 of WT, heterozygous (HET), and global Spns1 KO (KO) embryos. Arrows show maldevelopment of the eyes. (C) gSpns1-KO embryos were smaller than WT and HET controls. Each symbol represents 1 embryo (1-way ANOVA; n = 16 for WT, n = 22 for HET, n = 8 for KO; **P < 0.01; data are expressed as mean ± SD). (D) Gross anatomy of a control and gSpns1-KO embryos at E13.5. (E) Representative immunostaining with GLUT1 of the brain vasculature of controls and gSpns1-KO embryos. (F) Quantification of blood vessel density in the brain of control and gSpns1-KO embryos at E13.5. Each symbol represents 1 embryo (2-tailed unpaired t test; n = 4; *P < 0.05; data are expressed as mean ± SD). (G) Quantification of expression of GLUT1 in neocortical regions of gSpns1-KO embryos was significantly reduced. Each symbol represents 1 embryo (2-tailed unpaired t test; n = 4; **P < 0.01; data are expressed as mean ± SD). (H) Cortical thickness of gSpns1-KO embryos was reduced. Each symbol represents 1 embryo. n = 4 for each genotype. (I) Transmission electron microscopic images of brain sections of E12.5 WT and gSpns1-KO embryos. Accumulation of membranous structures (demarcated area) in the cytoplasm of brain cells of gSpns1-KO embryos. M, mitochondria. n = 3 per genotype.
Figure 2
Figure 2. Accumulation of sphingosines and lysoglycerophospholipids in Spns1-KO mice.
(A) Total levels of sphingosines, lysophosphatidylcholines (LPC), and lysophosphatidylethanolamines (LPE) from whole brains and livers of E13.5 WT, heterozygous (HET), and gSpns1-KO embryos. Note that the levels of sphingosine species were elevated in the brains and livers of Spns1-KO embryos, whereas the levels of LPC and LPE were increased in the fetal livers of the KO embryos. (1-way ANOVA for brain samples; n = 4 for WT, n = 6 for HET, and n = 4 for KO; 2-tailed unpaired t test for liver samples; n = 4 for each group; **P < 0.01, ***P < 0.001, ****P < 0.0001; data are expressed as mean ± SD). (B) Illustration of the postnatal deletion strategy of Spns1 using Rosa26Cre-ERT2 mice. (CE) Metabolomic analysis of livers of control and gSpns1-cKO mice. n = 5 mice per genotype. (C and D) Heatmap of sphingolipid and lysoglycerophospholipid species. (E) Metabolomic analysis of sphingosines, LPCs, and LPEs of control and gSpns1-cKO mice (2-tailed unpaired t test; n = 5; ***P < 0.001, ****P < 0.0001; data are expressed as mean ± SD).
Figure 3
Figure 3. SPNS1 is required for sphingosine and LPC release from lysosomes.
(AC) Total levels of sphingosines from WT and Spns1-KO cells with or without starvation condition. WT and Spns1-KO CHO cells (A). WT and Spns1-KO HEK293 cells (B). WT, Spns1-KO, and NPC1-KO HEK293 cells (C). Each symbol represents 1 replicate (A and B, 2-tailed unpaired t test, n = 4; C, 1-way ANOVA, n = 4; *P < 0.05, ***P < 0.001, ****P < 0.0001; data are expressed as mean ± SD). (D) Illustration of [3-3H]-sphingosine transport assays. Cells were starved in medium without amino acids and serum for 1 hour, andthey were then added with radioactive sphingosine and incubated until collecting for radioactive S1P isolation from other sphingolipids (Sph, Cer, and SM) for quantification. S1P, Sphingosine-1-phosphate; Sph, Sphingosine; Cer, Ceramide; SM, Sphingomyelin. (E) Radioactive S1P levels (upper phase) from WT, Spns1-KO, and rescue CHO cells with mouse SPNS1 (mSPNS1) or human SPNS1 (hSPNS1). Each symbol represents 1 replicate. One-way ANOVA; n = 3; *P < 0.05, **P < 0.01, ***P < 0.001; data are expressed as mean ± SD). (F) Illustration of NBD-palmitate labeling experiment. (G) Thin-layer chromatography (TLC) analysis of NBD-labeled phospholipids after 24 hours of pulse-labeling with NBD-palmitate in WT and Spns1-KO CHO cells. Arrowhead indicates NBD-LPC band. NL, neutral lipids. (H) Quantification of NBD-LPC from the TLC plate (2-tailed unpaired t test; n = 3; ***P < 0.001; data are expressed as mean ± SD). (I) LPC transport activity of mouse (mSPNS1), human SPNS1 (hSPNS1) in HEK293 cells, and the missense mutation P295L. E164K was used as a control. piRESv2-EGFP was used as a mock control. Transfected HEK293 cells were incubated with 10 μM [14C] LPC for 20 minutes and collected for quantification of radioactive signals. Each symbol represents 1 replicate (1-way ANOVA; n = 3; ****P < 0.001; data are expressed as mean ± SD).
Figure 4
Figure 4. Spns1-KO mice exhibit lysosomal storage phenotypes.
(A) Illustration of the postnatal deletion strategy of Spns1 using Rosa26Cre-ERT2 mice. (B) Reduction of body weights of gSpns1-cKO male and female mice 2 weeks after tamoxifen treatment. Each symbol represents 1 mouse. (C) Representative images of a control and a gSpns1-cKO mouse. (D) Increased number of white blood cells (WBC) in gSpns1-cKO mice compared with controls. Each symbol represents 1 mouse. (E) Representative images of livers from a control and a gSpns1-cKO mouse. (F) Increased liver weights in gSpns1-cKO mice compared with the controls of the same age. Each symbol represents 1 mouse. (G) Representative images of H&E staining of liver sections from control and gSpns1-cKO mice. Livers of gSpns1-cKO mice were presented a foamy phenotype. n = 3 per genotype. Scale bar: 50 μm. (H) Representative of immunostaining images of liver sections from control and gSpns1-cKO mice with cathepsin B and LAMP1 or with Mac-2 for macrophages. Scale bar: 20 μm. n = 3 per genotype. (I) Quantification of cathepsin B fluorescence intensity from H. (J) Numeration of Mac-2+ cells from H. Each symbol represents one section from n = 3 mice per genotype. (K and L) Western blot analysis of cathepsin B and LC3B proteins from whole liver protein lysates of control and gSpns1-cKO mice. Cathepsin B processing was defective in the livers of gSpns1-cKO mice (arrow). n = 4 per genotype. (M) Quantification of total LC3B-II bands from L. (N and O) The levels of lysophosphatidylcholine (LPC), lysophosphatidylethanolamine (LPE), ceramides, and sphingosines from whole livers and lysosomal fractions (F1 and F2) of control and gSpns1-cKO mice, respectively. n = 4–5 for whole liver. n = 3 per genotype for lysosomes. *P < 0.05; **P < 0.01; ***P < 0.001; ****P < 0.0001. Data are expressed as mean ± SD. Statistical significance was determined by 2-tailed unpaired t test.
Figure 5
Figure 5. Alteration of ATF4 and p-Akt signaling in livers of Spns1-KO mice.
(A) RNA-Seq analysis of control and gSpns1-cKO livers. The graphs illustrate the most significantly affected pathways in gSpns1-KO livers identified by the Kyoto Encyclopedia of Genes and Genomes (KEGG) pathway analysis. (B) Increased expression levels of mRNA for genes in sphingolipid metabolism. Expression of the genes in the sphingolipid pathway was significantly upregulated in livers of gSpns1-cKO mice. (C) Western blot analysis of mitochondrial markers: HMOX1, VDAC, MRPS35, and OPA1 in livers of control and gSpns1-cKO. n = 3 per genotype. (D) Quantification of expression levels of protein bands in C. Expression of OPA1 was significantly reduced in gSpns1-cKO livers. (E) Differential expression levels of genes in the PI3K/AKT signaling pathway. Many genes in the PI3K/AKT signaling pathway were differentially expressed in the gSpns1-cKO livers. (F and G) Western blot analysis of ATF4, p-Akt, and total Akt in control and gSpns1-CKO livers. n = 3 per genotype. OPA1 and ATF4 were probed on a same membrane and shared GAPDH control. (G) Quantification of total expressions of proteins in F after normalization to GAPDH. **P < 0.01; ****P < 0.0001. Data are expressed as mean ± SD. Statistical significance was determined by 2-tailed unpaired t test.

Similar articles

Cited by

References

    1. Platt FM, et al. Lysosomal storage diseases. Nat Rev Dis Primers. 2018;4(1):27. doi: 10.1038/s41572-018-0025-4. - DOI - PubMed
    1. Breiden B, Sandhoff K. Lysosomal glycosphingolipid storage diseases. Annu Rev Biochem. 2019;88:461–485. doi: 10.1146/annurev-biochem-013118-111518. - DOI - PubMed
    1. Platt FM. Sphingolipid lysosomal storage disorders. Nature. 2014;510(7503):68–75. doi: 10.1038/nature13476. - DOI - PubMed
    1. Kolter T, Sandhoff K. Sphingolipid metabolism diseases. Biochim Biophys Acta. 2006;1758(12):2057–2079. doi: 10.1016/j.bbamem.2006.05.027. - DOI - PubMed
    1. Hannun YA, Obeid LM. Sphingolipids and their metabolism in physiology and disease. Nat Rev Mol Cell Biol. 2018;19(3):175–191. doi: 10.1038/nrm.2017.107. - DOI - PMC - PubMed

Publication types