. 2024 Mar 26;43(3):113927.
doi: 10.1016/j.celrep.2024.113927. Epub 2024 Mar 6.

ALK upregulates POSTN and WNT signaling to drive neuroblastoma

Affiliations

ALK upregulates POSTN and WNT signaling to drive neuroblastoma

Miller Huang et al. Cell Rep. .

Abstract

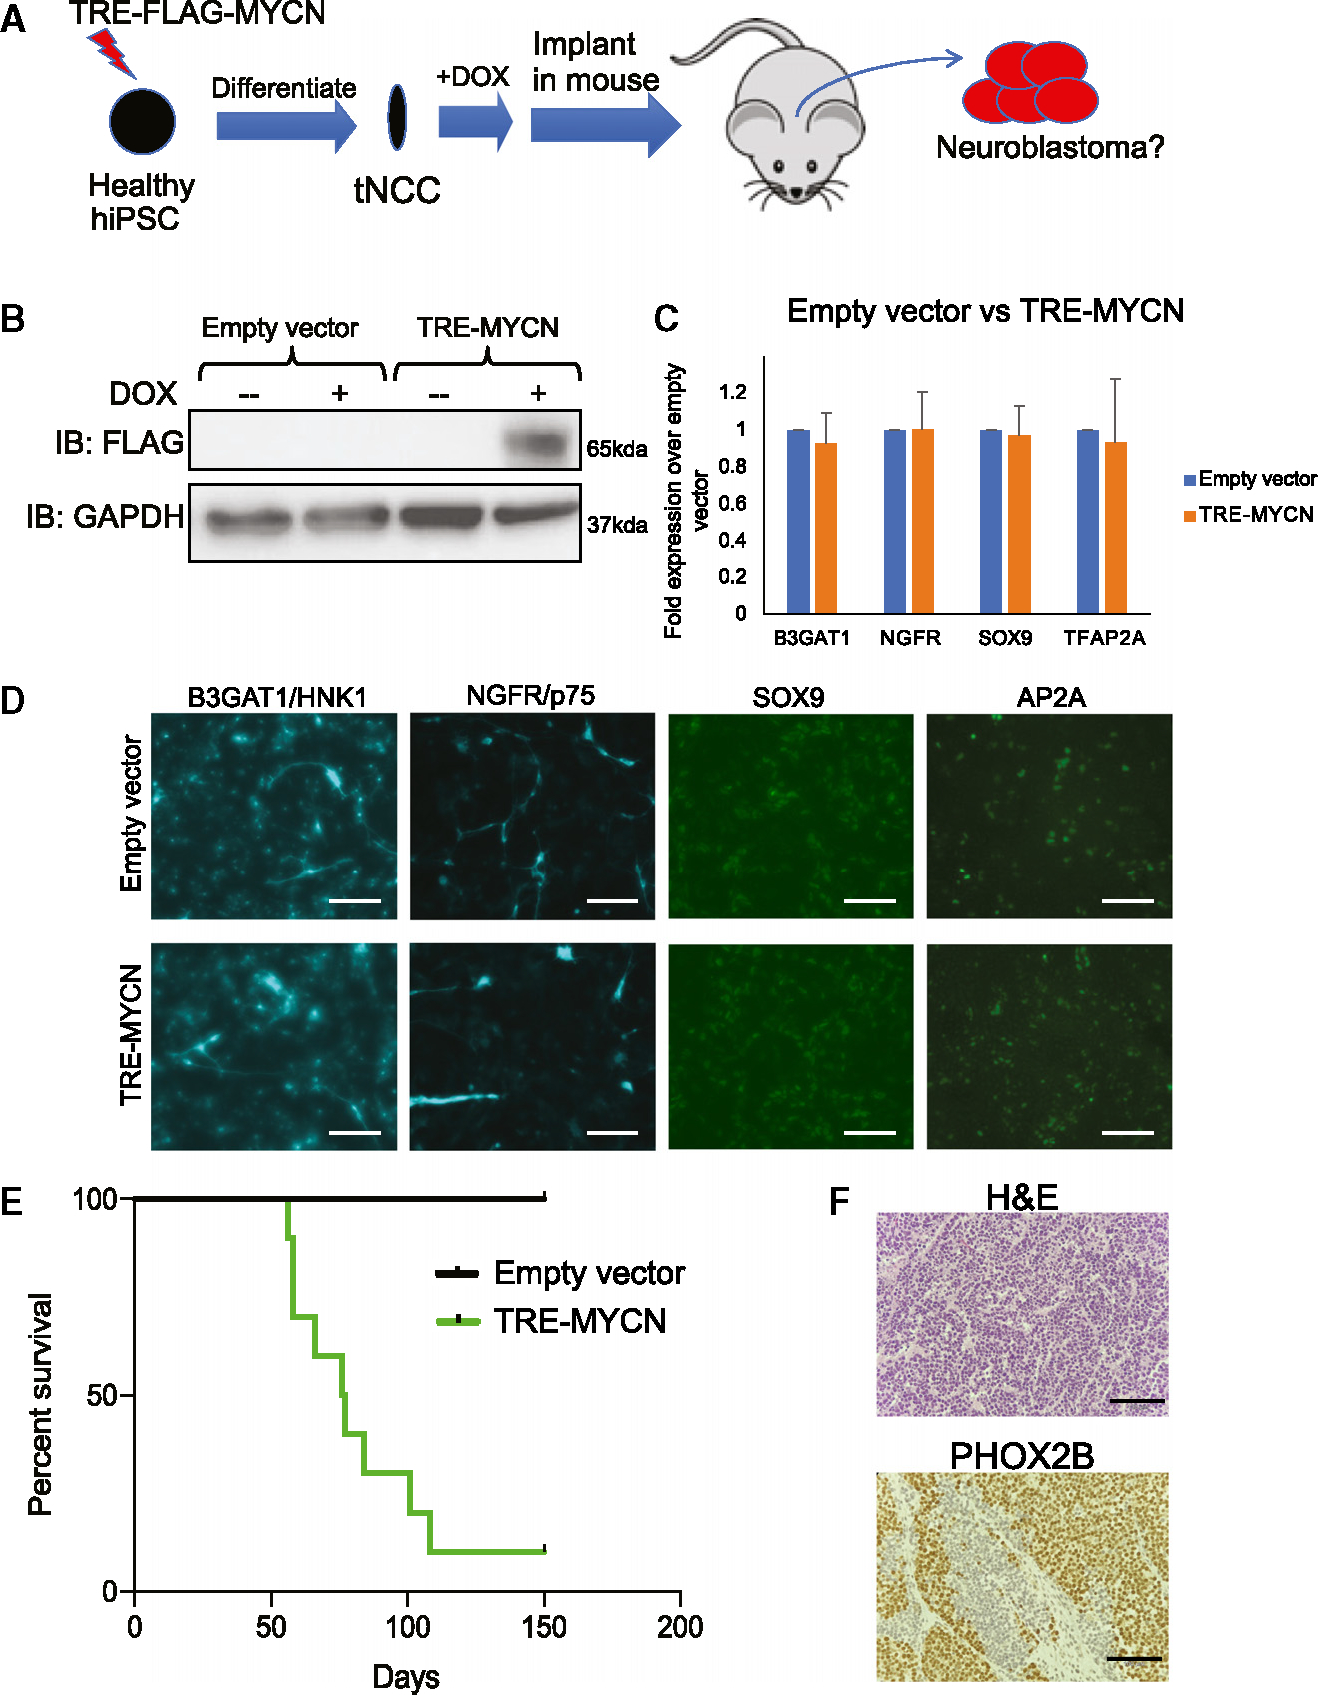
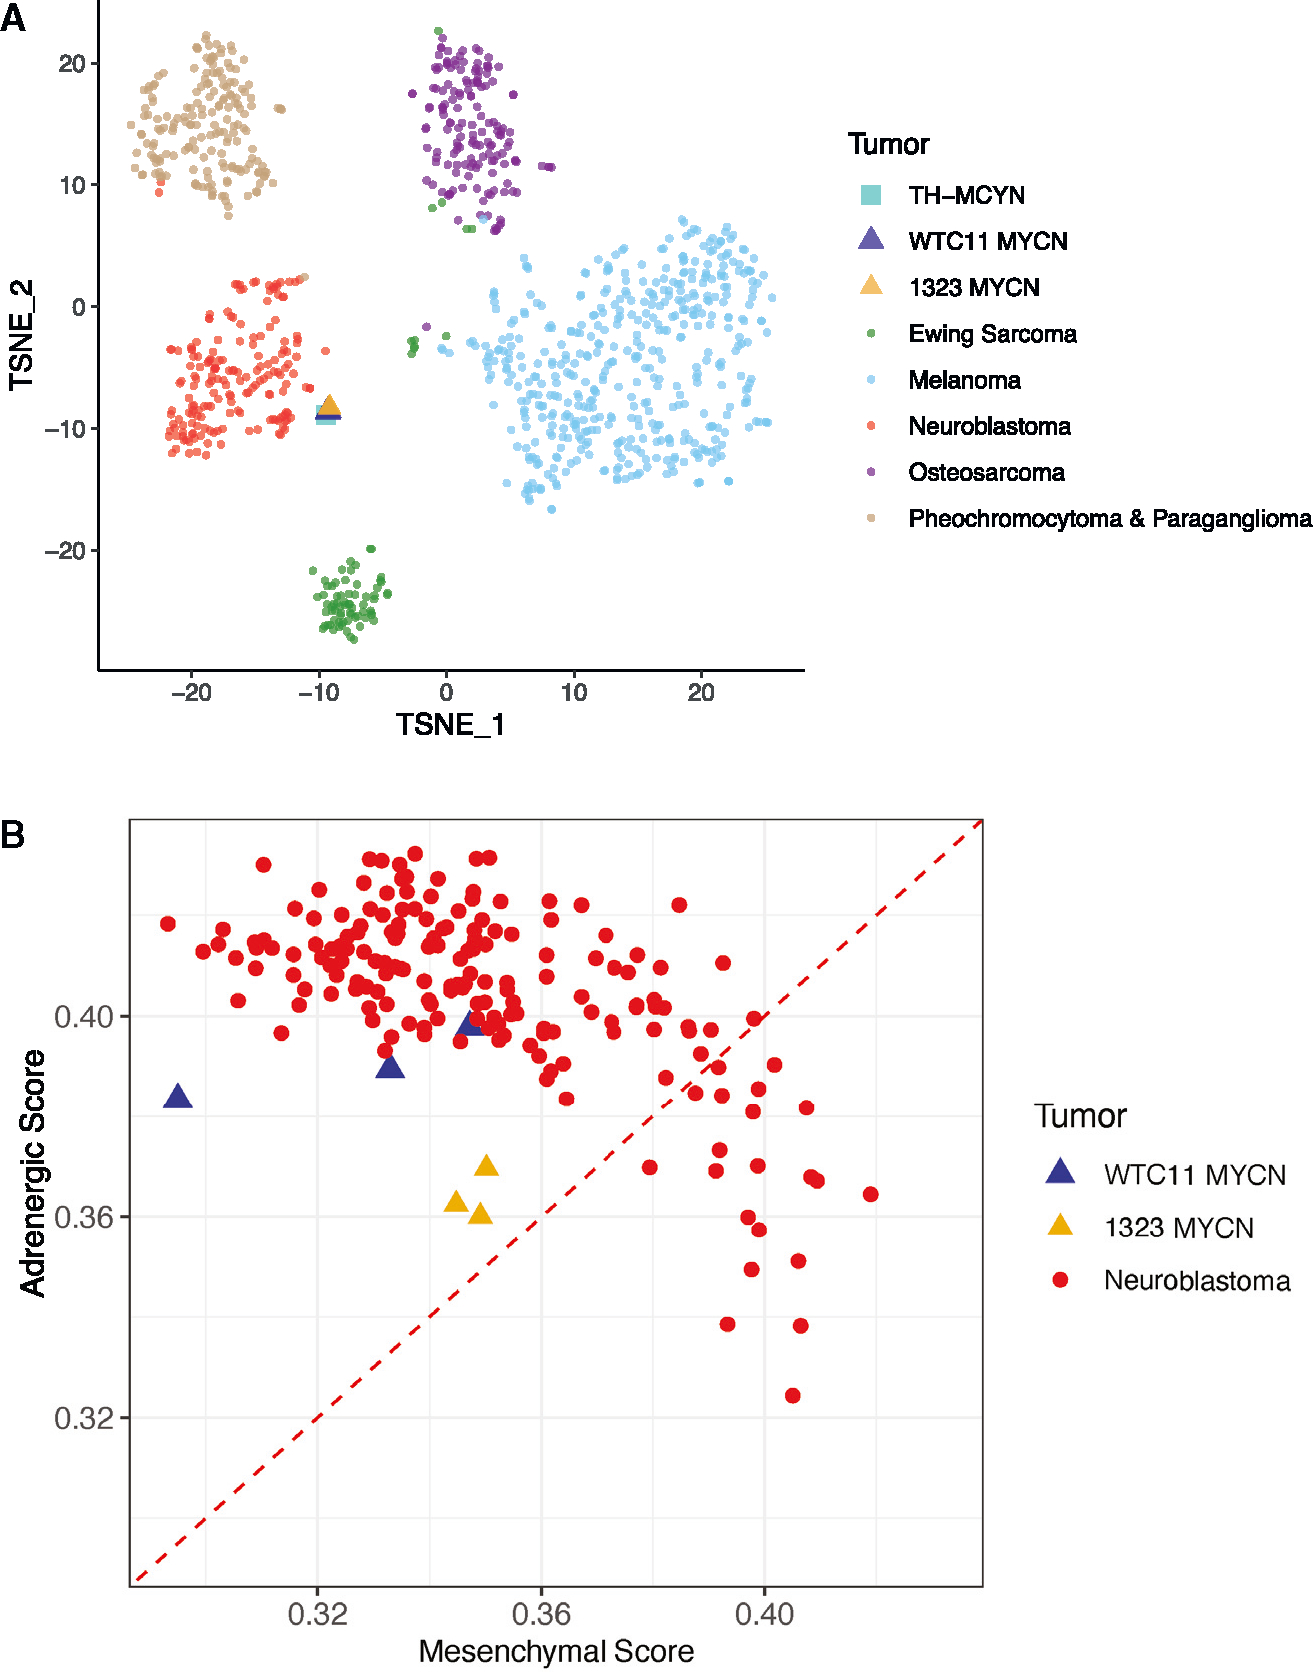
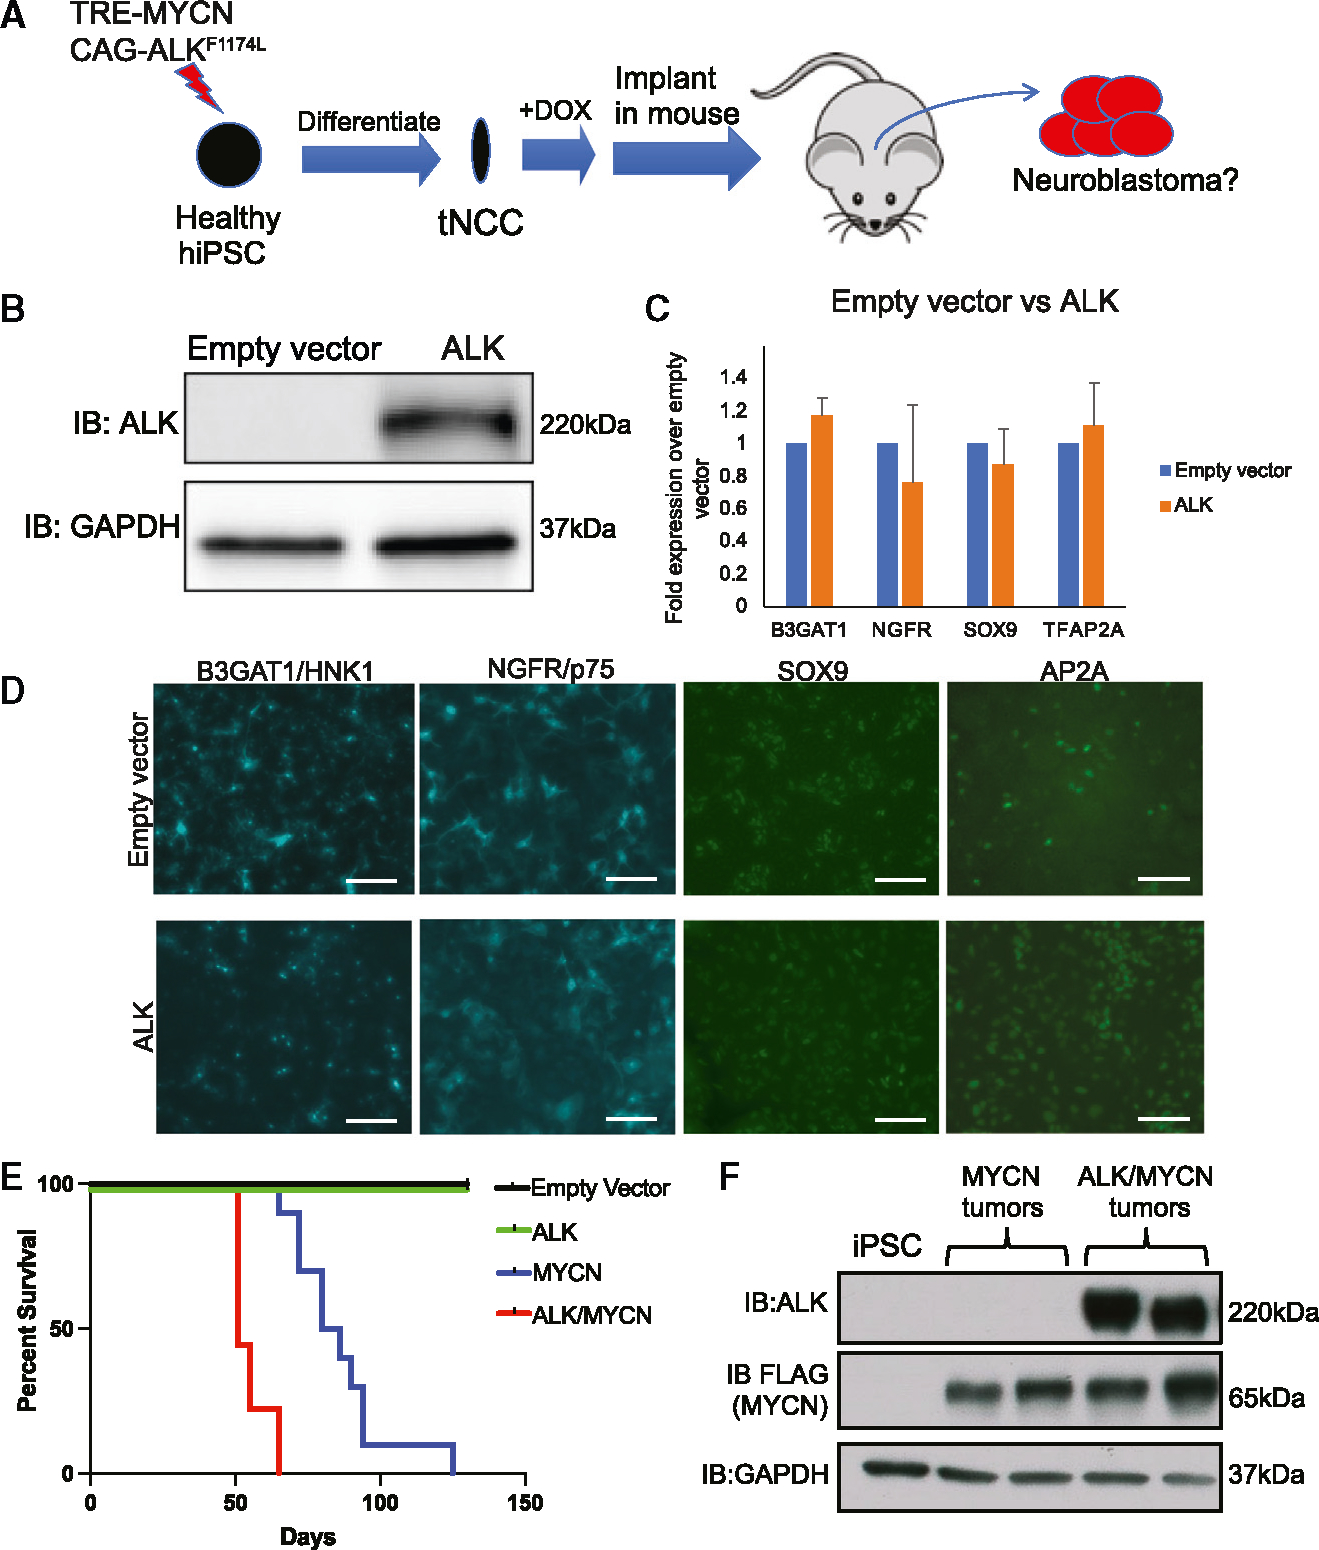
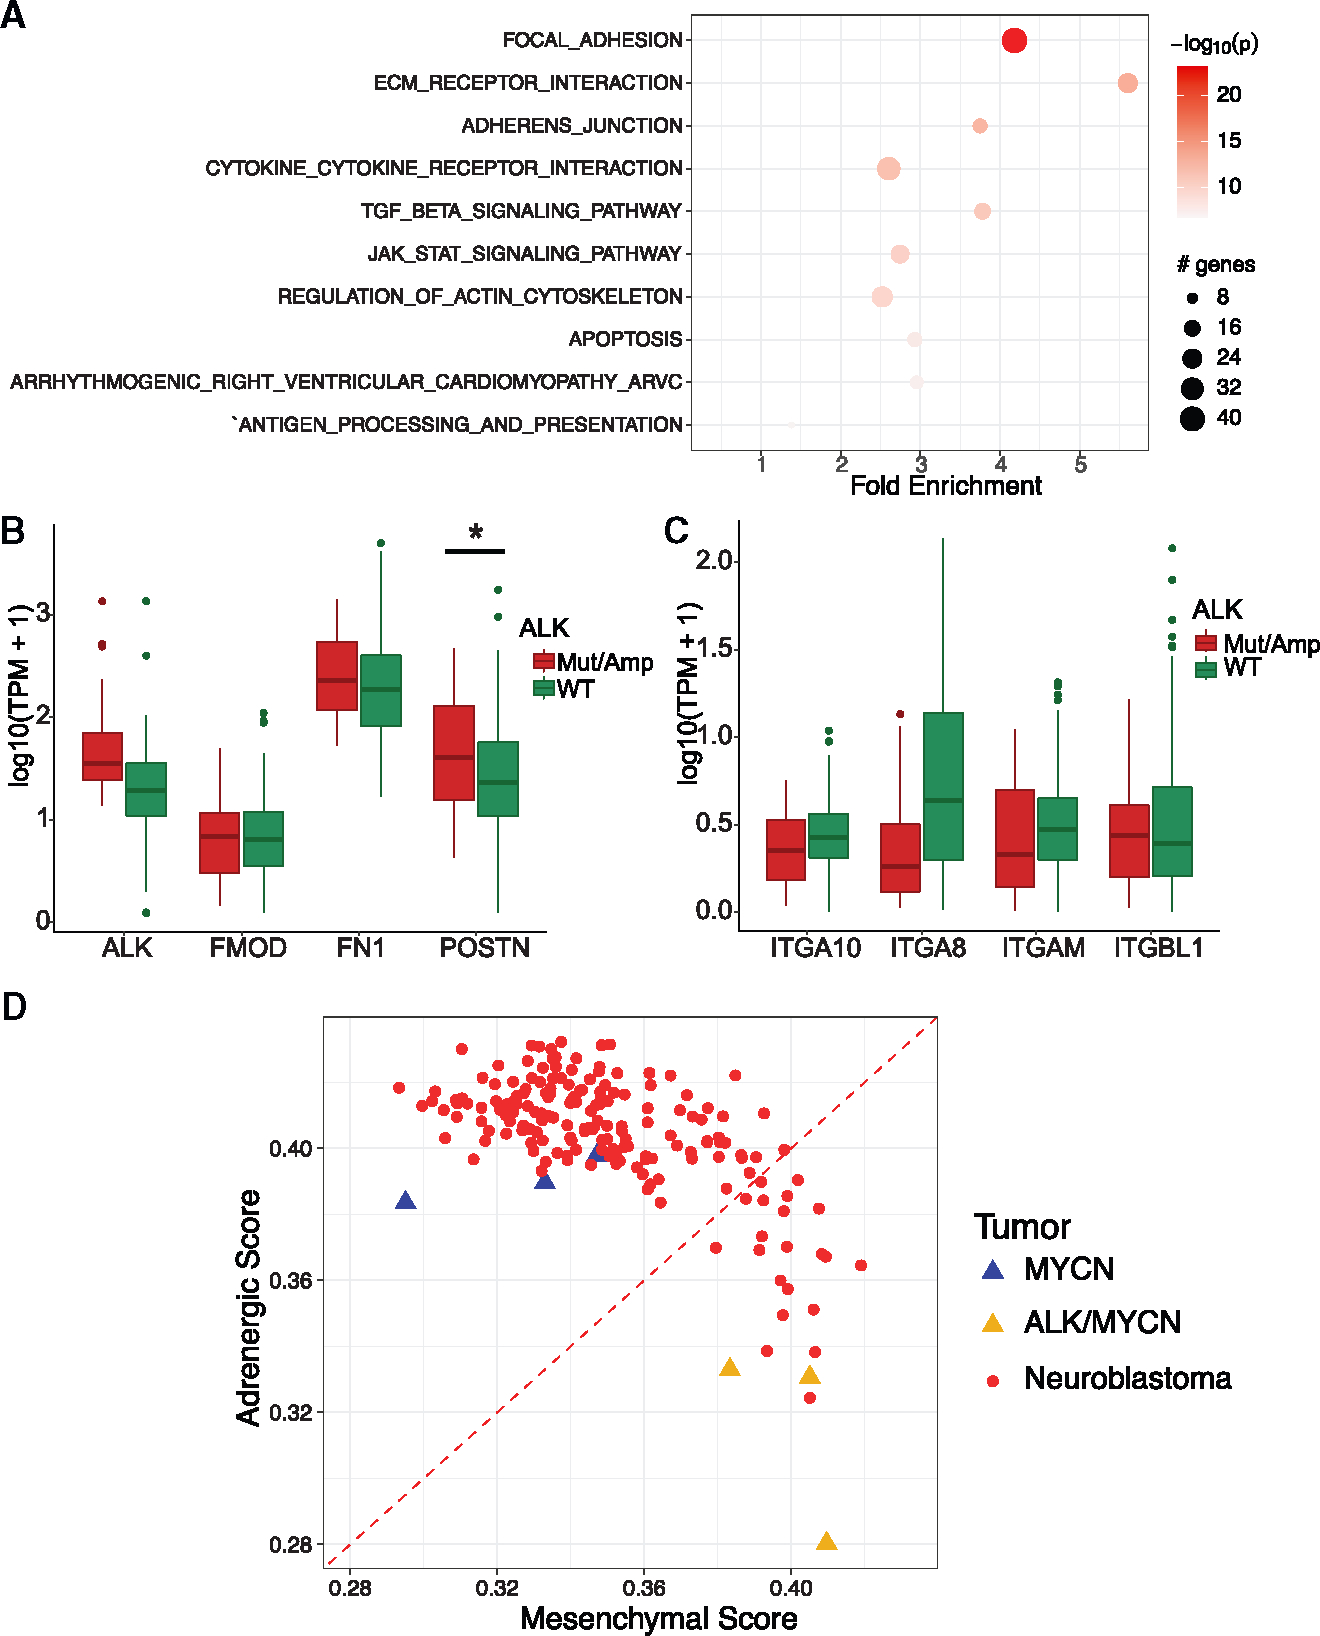
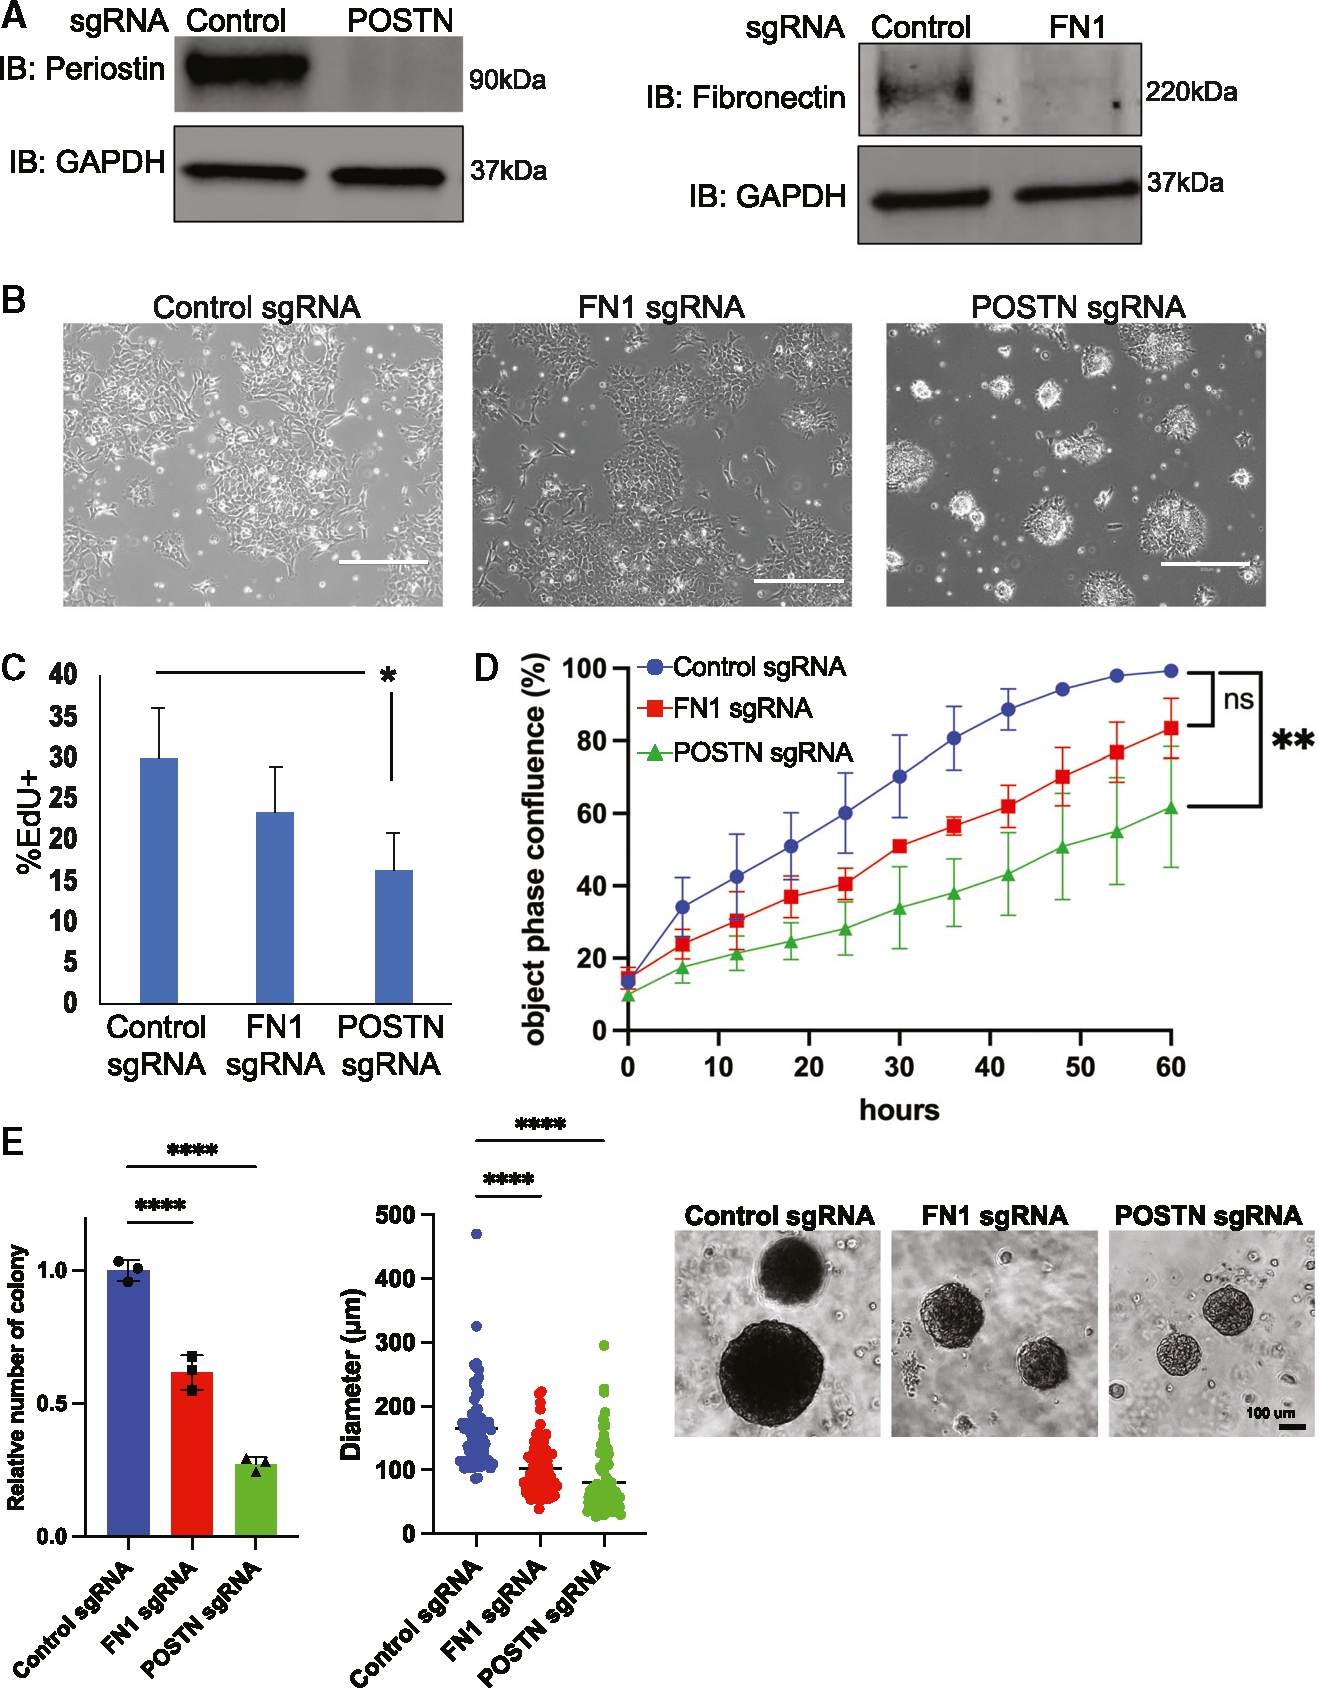
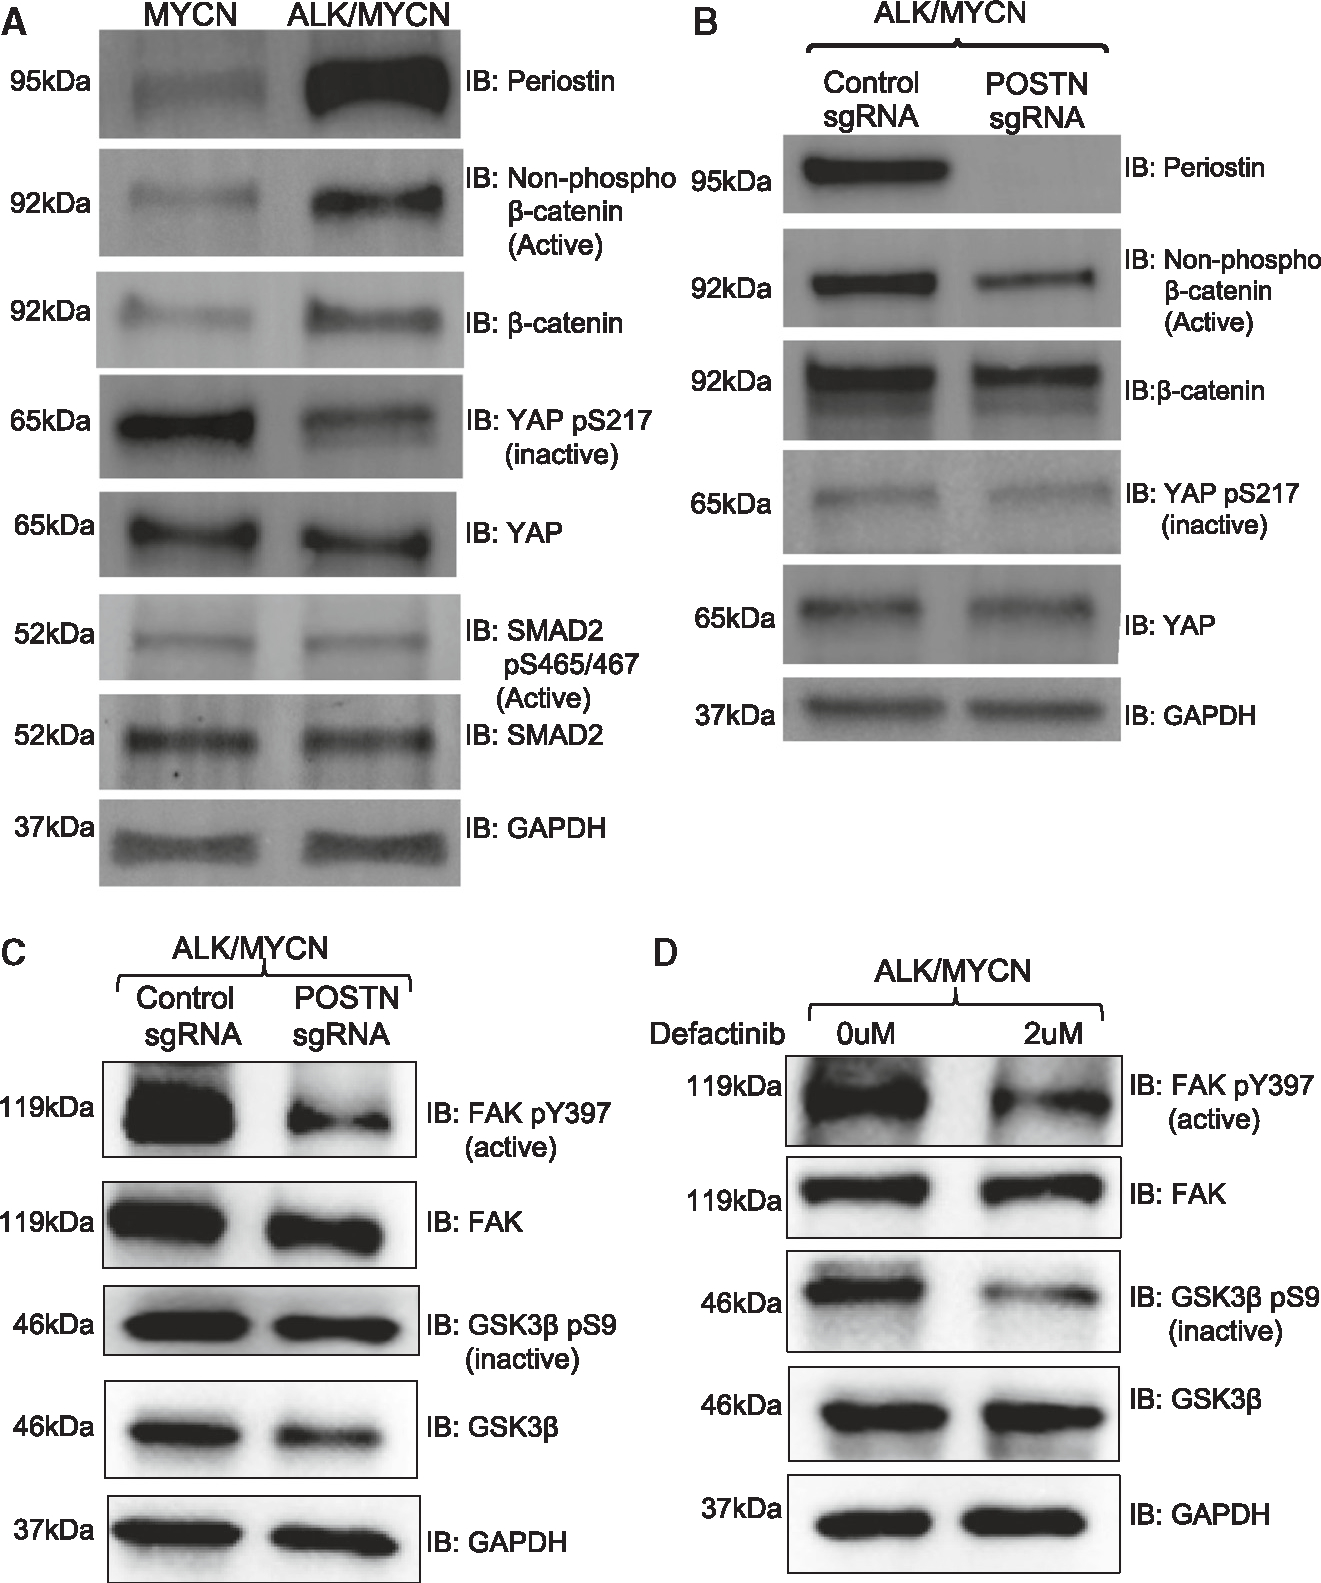
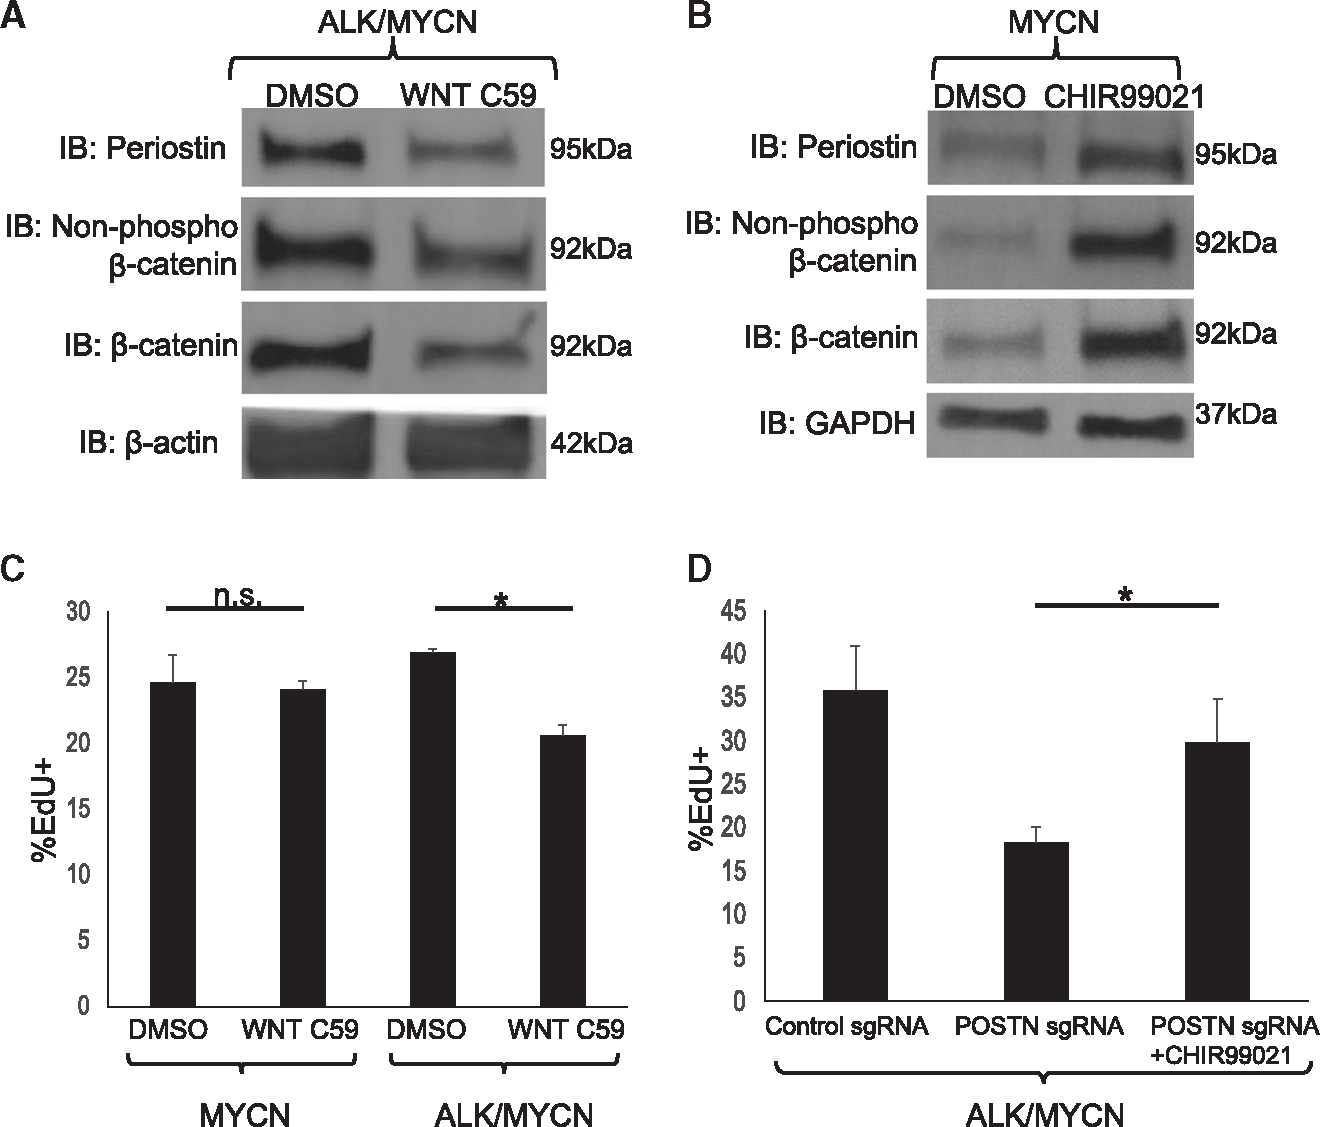
Neuroblastoma is the most common extracranial solid tumor of childhood. While MYCN and mutant anaplastic lymphoma kinase (ALKF1174L) cooperate in tumorigenesis, how ALK contributes to tumor formation remains unclear. Here, we used a human stem cell-based model of neuroblastoma. Mis-expression of ALKF1174L and MYCN resulted in shorter latency compared to MYCN alone. MYCN tumors resembled adrenergic, while ALK/MYCN tumors resembled mesenchymal, neuroblastoma. Transcriptomic analysis revealed enrichment in focal adhesion signaling, particularly the extracellular matrix genes POSTN and FN1 in ALK/MYCN tumors. Patients with ALK-mutant tumors similarly demonstrated elevated levels of POSTN and FN1. Knockdown of POSTN, but not FN1, delayed adhesion and suppressed proliferation of ALK/MYCN tumors. Furthermore, loss of POSTN reduced ALK-dependent activation of WNT signaling. Reciprocally, inhibition of the WNT pathway reduced expression of POSTN and growth of ALK/MYCN tumor cells. Thus, ALK drives neuroblastoma in part through a feedforward loop between POSTN and WNT signaling.

Keywords: ALK; CP: Cancer; MYCN; POSTN; WNT; human pluripotent stem cells; neuroblastoma.


Conflict of interest statement

Declaration of interests W.C.G. and N.N. are employees and shareholders at Revolution Medicines (Redwood City, CA, USA). W.A.W. is a co-founder of StemSynergy Therapeutics.

Figures

Figure 1.
Figure 1.. MYCN mis-expression drives neuroblastoma formation in vivo.
(A) Schematic showing a doxycycline (dox)-inducible FLAG-MYCN (TRE-MYCN) lentivirus vector is transduced into human iPSCs, differentiated toward tNCCs, treated with dox, and implanted orthotopically into immunocompromised NSG mice. (B) Western blot showing FLAG-tagged MYCN expression can by modulated with addition of 0.1 μg/mL dox for 24 h. (C and D) Empty vector and TRE-MYCN iPSCs were differentiated toward tNCCs and analyzed for expression of B3GAT1/HNK1, NGFR/p75, SOX9, and TFAP2A/AP2A via (C) RT-qPCR (n = 3, error bars represent standard error of mean) and (D) immunofluorescence. Scale bar: 90 μm. (E) Kaplan-Meier survival curve of mice injected with empty vector or TRE-MYCN tNCCs and fed with dox chow (n = 10). p < 0.05 (log-rank test). (F) Immunohistochemical staining for H&E and PHOX2B in TRE-MYCN tumors. Scale bar: 190 μm. See also Figures S1 and S2.
Figure 2.
Figure 2.. MYCN-driven iPSC-derived tNCC tumors resemble adrenergic neuroblastoma.
(A) RNA was extracted from tumors derived fromWTC11 and 1323 TRE-MYCN tNCCs and analyzed by RNA-seq. Transcriptome profiles of human WTC11 and 1323 tumors and mouse TH-MYCN tumors were compared against human neural crest-derived tumors (Ewing sarcoma, melanoma, neuroblastoma, osteosarcoma, pheochromocytoma, and paraganglioma). (B) Transcriptomes of WTC11 and 1323 TRE-MYCN tumors were compared against neuroblastoma tumors based on the adrenergic score vs. mesenchymal score. See also Figures S1 and S2.
Figure 3.
Figure 3.. ALKF1174L cooperates with MYCN to accelerate tumorigenesis.
(A) Schematic of iPSCs transduced with inducible MYCN expression and/or ALKF1174L and implanted in renal capsules of NSG mice. (B) Western blot validating expression of ALK inALKF1174L iPSCs. (C and D) Empty vector and ALK iPSCs were differentiated toward tNCCs and analyzed for expression of B3GAT1/HNK1, NGFR/p75, SOX9, and TFAP2A/AP2A via (C) RT-qPCR (n = 3, error bars represent standard error of mean) and (D) immunofluorescence. Scale bar: 90 μm. (E) Kaplan-Meier survival curve of mice injected withempty vector (black), ALK tNCCs (green), MYCN tNCCs (blue), or MYCN/ALK tNCCs (red) (n = 10 per group). p < 0.05 between MYCN and MYCN/ALK groups by log-rank test. (F) Western blot analysis validating expression of ALK and MYCN in two separate MYCN and ALK/MYCN tumors. See also Figures S3 and S4.
Figure 4.
Figure 4.. ALK-driven tumors upregulate expression of ECM proteins and resemble mesenchymal neuroblastoma.
(A) Gene Ontology analysis showing KEGG database pathways enriched in ALK/MYCN tumors compared to MYCN alone. (B and C) Comparison between ALK amplified/mutant (red) against ALK wild type (green) for expression of (B) ECM genes FMOD, FN1, and POSTN and (C) integrin genes ITGA10, ITGA8, ITGAM, and ITGBL1. Data were obtained from the TARGET and GMKF databases. Error bars represent 95% confidence interval. There were 301 ALK wild-type samples and 24 ALK-amplified/-mutant samples, and statistical differences between the two groups was calculated using Wilcoxon rank-sum test. *p < 0.05. (D) Transcriptomes of MYCN and ALK/MYCN tumors were compared against neuroblastoma tumors based on the adrenergic score vs. mesenchymal score. See also Table S1 and Figure S5.
Figure 5.
Figure 5.. POSTN, but not FN1, is required for ALK/MYCN tumor cell adhesion and growth.
(A) ALK/MYCN tumor lines were transduced with dCas9-BFP-KRAB (CRISPR interference [CRISPRi]) and either control sgRNA, FN1 sgRNA, or POSTN sgRNA. Knockdown of FN1 and POSTN was validated by western blot. (B) ALK/MYCN tumor cells with control, FN1, and POSTN sgRNAs were plated for 24 h on uncoated tissue culture-treated dishes. Scale bar = 380 μm (C) ALK/MYCN tumor cells with control, FN1, and POSTN sgRNAs were treated with 10 μM EdU for 1 h and analyzed by flow cytometry for the percentage of cells that stain positive for EdU. Bar graph shows the average of EdU+ cells in three independent experiments. Error bars represent standard error mean. *p < 0.05 (D) Phase objective confluence calculated by IncuCyte for ALK/MYCN tumor cells with control, FN1, or POSTN sgRNA over 60 h. Each datapoint represents mean confluence ± standard deviation (n = 4 for each tumor cell line. **p < 0.01, unpaired t test). (E) ALK/MYCN tumor cells with control, FN1, and POSTN sgRNAs were cultured in soft agar for 3 weeks. Bars represent the mean ± SD (n = 3 for each tumor cell line); ****p < 0.0001. The scale bar shows 100 μm. See also Figure S6.
Figure 6.
Figure 6.. POSTN is required for ALK-mediated activation of WNT signaling.
(A) MYCN and ALK/MYCN tumor lines were analyzed by western blot for expression of POSTN, active form of β-catenin (non-phosphorylated at S33/S37/T41), active SMAD2 (phosphorylated at S465/467), and inactive YAP (phosphorylated at S127) expression and WNT signaling. (B and C) ALK/MYCN with control sgRNA or POSTN sgRNA tumor lines were analyzed by western blot for (B) activation of WNT and YAP signaling and (C) activation of FAK and inhibition of GSK3β. (D) ALK/MYCN tumor cells were treated with or without the FAK inhibitor defactinib (2 μM) for 48 h and analyzed by western blot for FAK and GSK3β activity. See also Figures S7–S9.
Figure 7.
Figure 7.. Activation of WNT increases POSTN expression and promotes growth of tumor cells.
(A) ALK/MYCN tumor cells are treated with DMSO or 10 μM WNT-C59 for 24 h and analyzed by western blot for POSTN, non-phosphorylated β-catenin, and β-catenin. (B) MYCN tumor cells were treated with DMSO or 3 μM CHIR99021 for 24 h and analyzed by western blot for POSTN, non-phosphorylated β-catenin, and β-catenin. (C) MYCN and ALK/MYCN tumor cells were treated with DMSO or 10 μM WNT C59 for 48 h and analyzed for EdU incorporation. *p < 0.05, n = 3, error bars represent standard error mean. (D) ALK/MYCN tumor cells with POSTN sgRNA were treated with DMSO or 3 μM CHIR99021 for 24 h and analyzed for EdU incorporation. *p < 0.05, n = 3, error bars represent standard error mean. See also Figure S10.

Similar articles

Cited by

References

    1. Matthay KK, Maris JM, Schleiermacher G, Nakagawara A, Mackall CL,Diller L, Weiss WA, Neuroblastoma. Nat Rev Dis Primers.11 October 2016;2:16078. doi:10.1038/nrdp.2016.78 - DOI - PubMed
    1. van Groningen T, Koster J, Valentijn LJ, Zwijnenburg DA, Akogul N,Hasselt NE, Broekmans M, Haneveld F, Nowakowska NE, Bras J, et al. (2017). Neuroblastoma is composed of two super-enhancer-associated differentiation states. Nat. Genet. 49, 1261–1266. 10.1038/ng.3899. - DOI - PubMed
    1. van Groningen T, Akogul N, Westerhout EM, Chan A, Hasselt NE, Zwijnenburg DA, Broekmans M, Stroeken P, Haneveld F, Hooijer GKJ, et al.,. A NOTCH feed-forward loop drives reprogramming from adrenergic to mesenchymal state in neuroblastoma. Nat. Commun.. 04 April 2019;10:1530. doi:10.1038/s41467-019-09470-w - DOI - PMC - PubMed
    1. Rothstein M, Bhattacharya D, Simoes-Costa M. The molecular basis of neural crest axial identity. Dev. Biol.. 12 January 2018;444 Suppl 1:S170–S180. doi:10.1016/j.ydbio.2018.07.026 - DOI - PMC - PubMed
    1. Huber K (2015). Segregation of neuronal and neuroendocrine differentiation in the sympathoadrenal lineage. Cell Tissue Res. 359, 333–341. 10.1007/s00441-014-1947-0. - DOI - PubMed

Publication types

MeSH terms

Substances