. 2024 Mar 12;121(11):e2315989121.
doi: 10.1073/pnas.2315989121. Epub 2024 Mar 7.

CD38-RyR2 axis-mediated signaling impedes CD8+ T cell response to anti-PD1 therapy in cancer

Affiliations

CD38-RyR2 axis-mediated signaling impedes CD8+ T cell response to anti-PD1 therapy in cancer

Anwesha Kar et al. Proc Natl Acad Sci U S A. .

Abstract

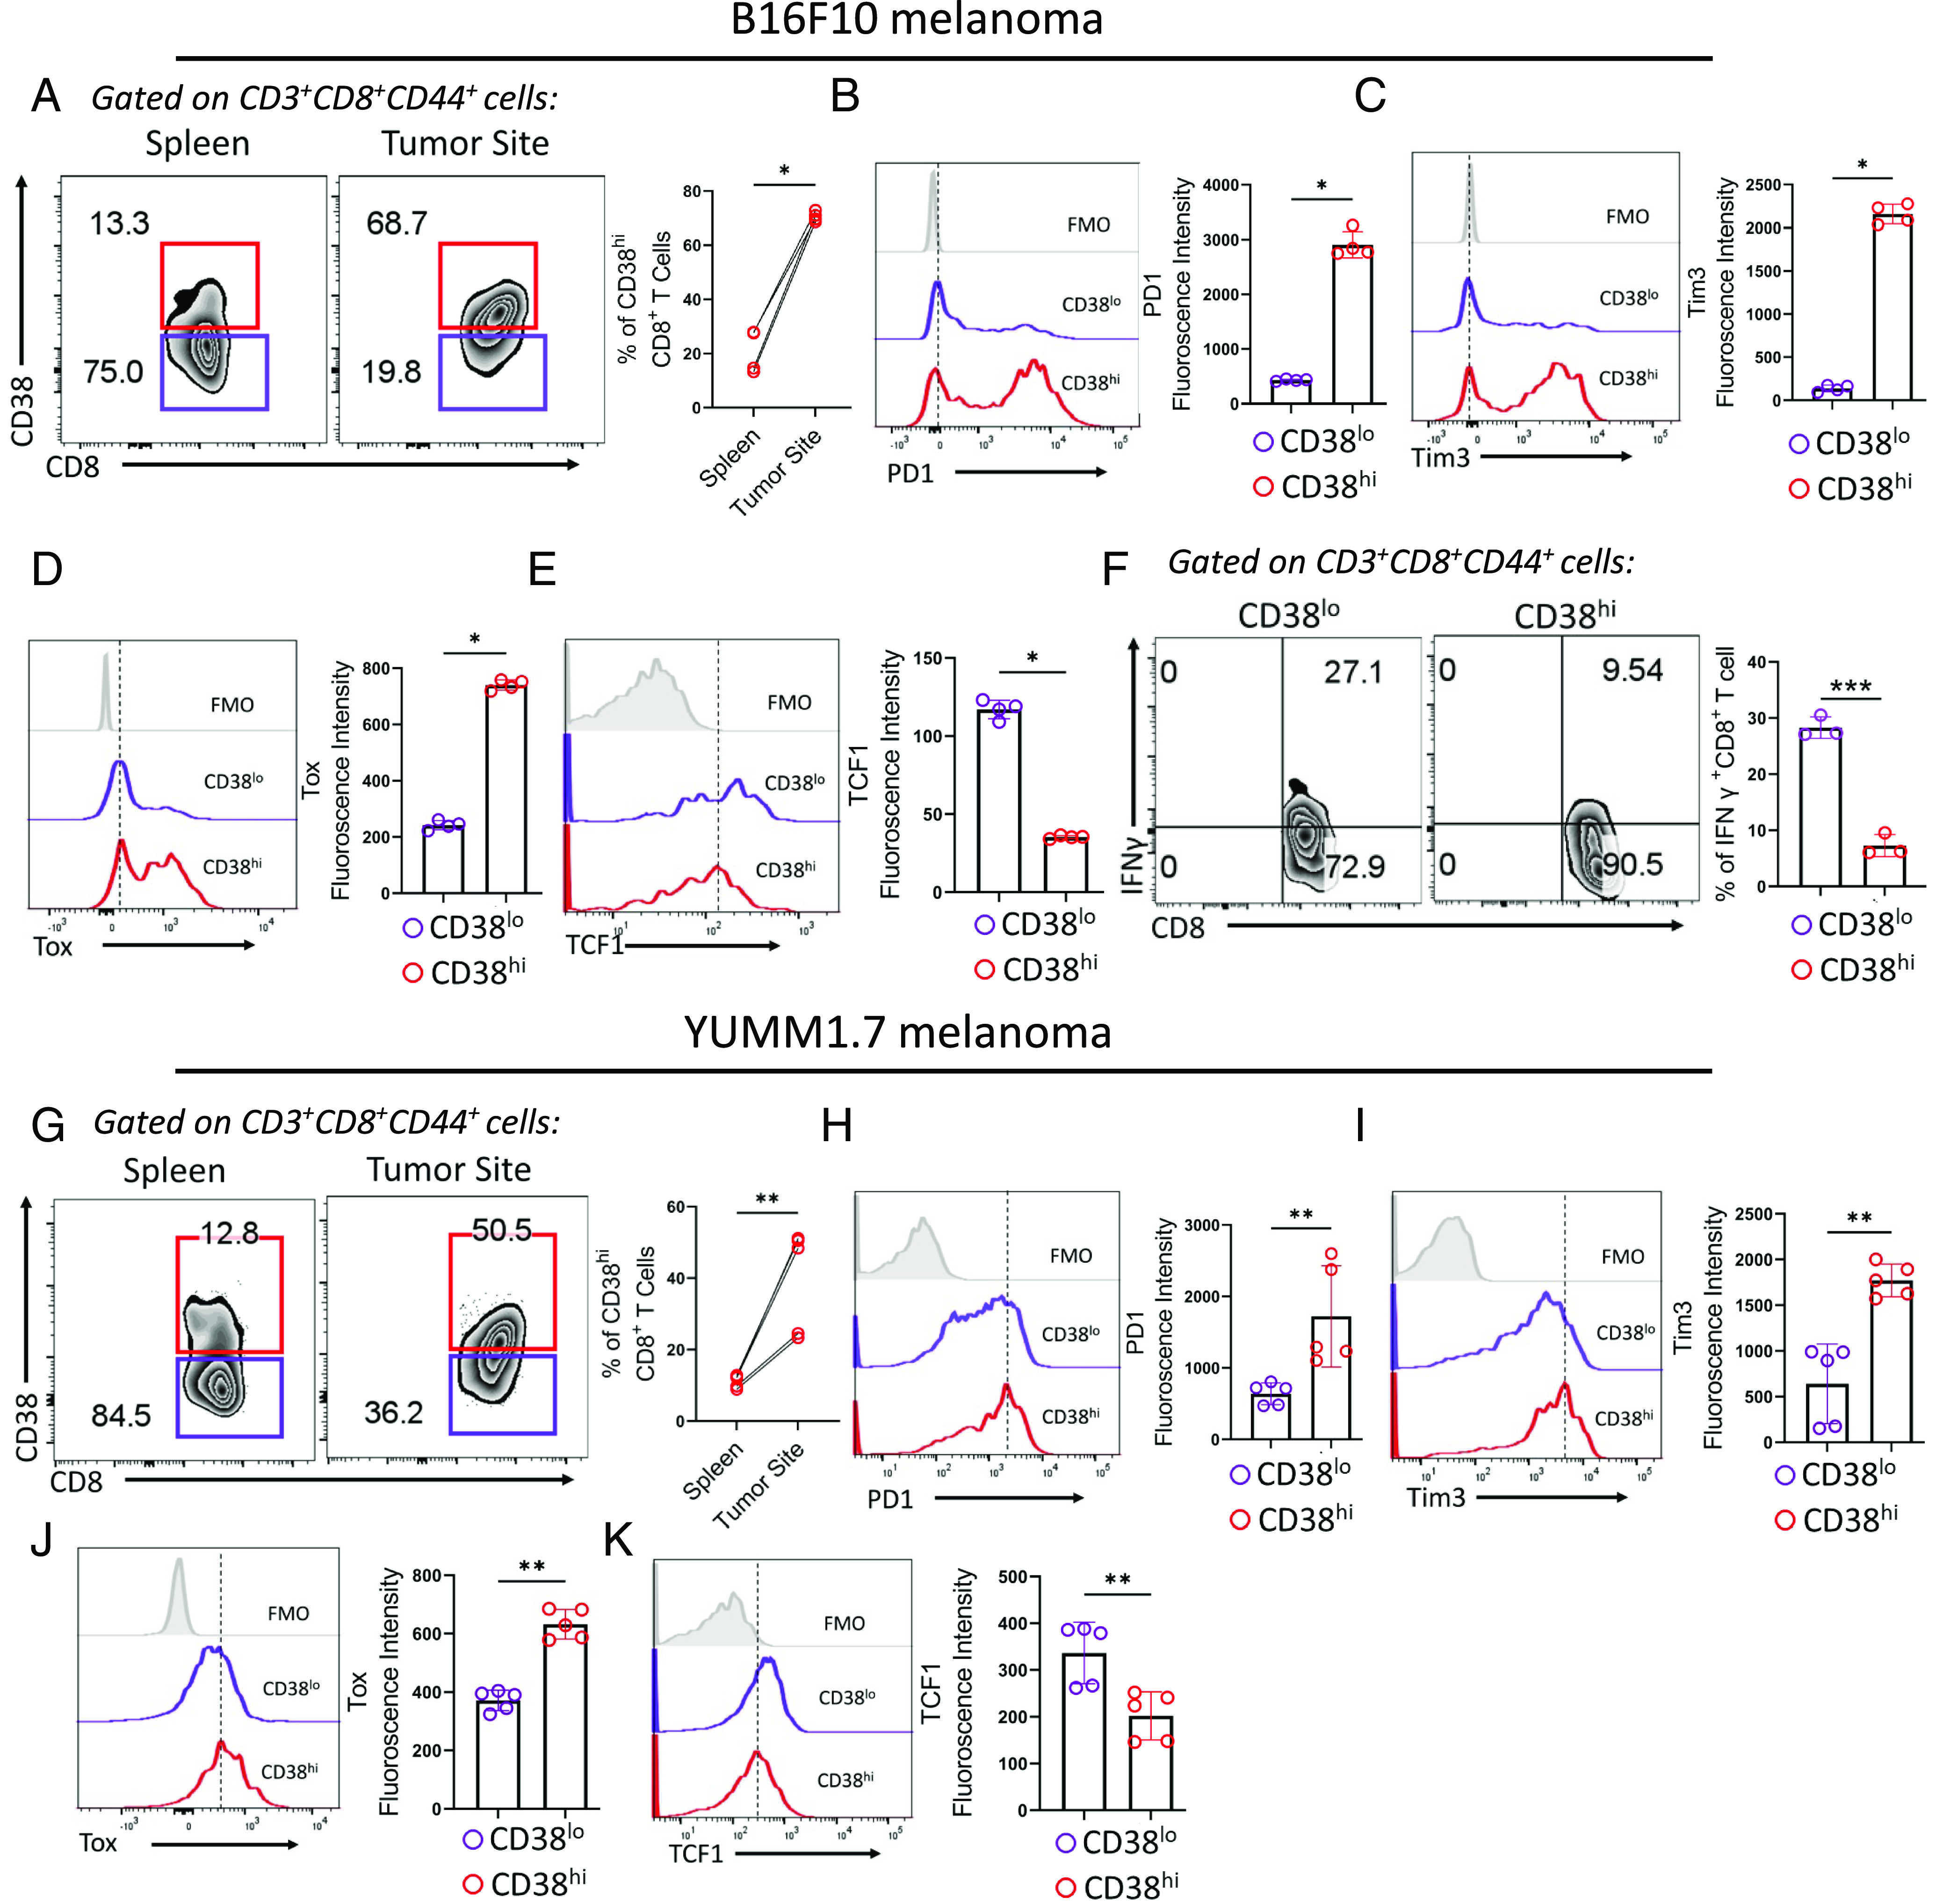
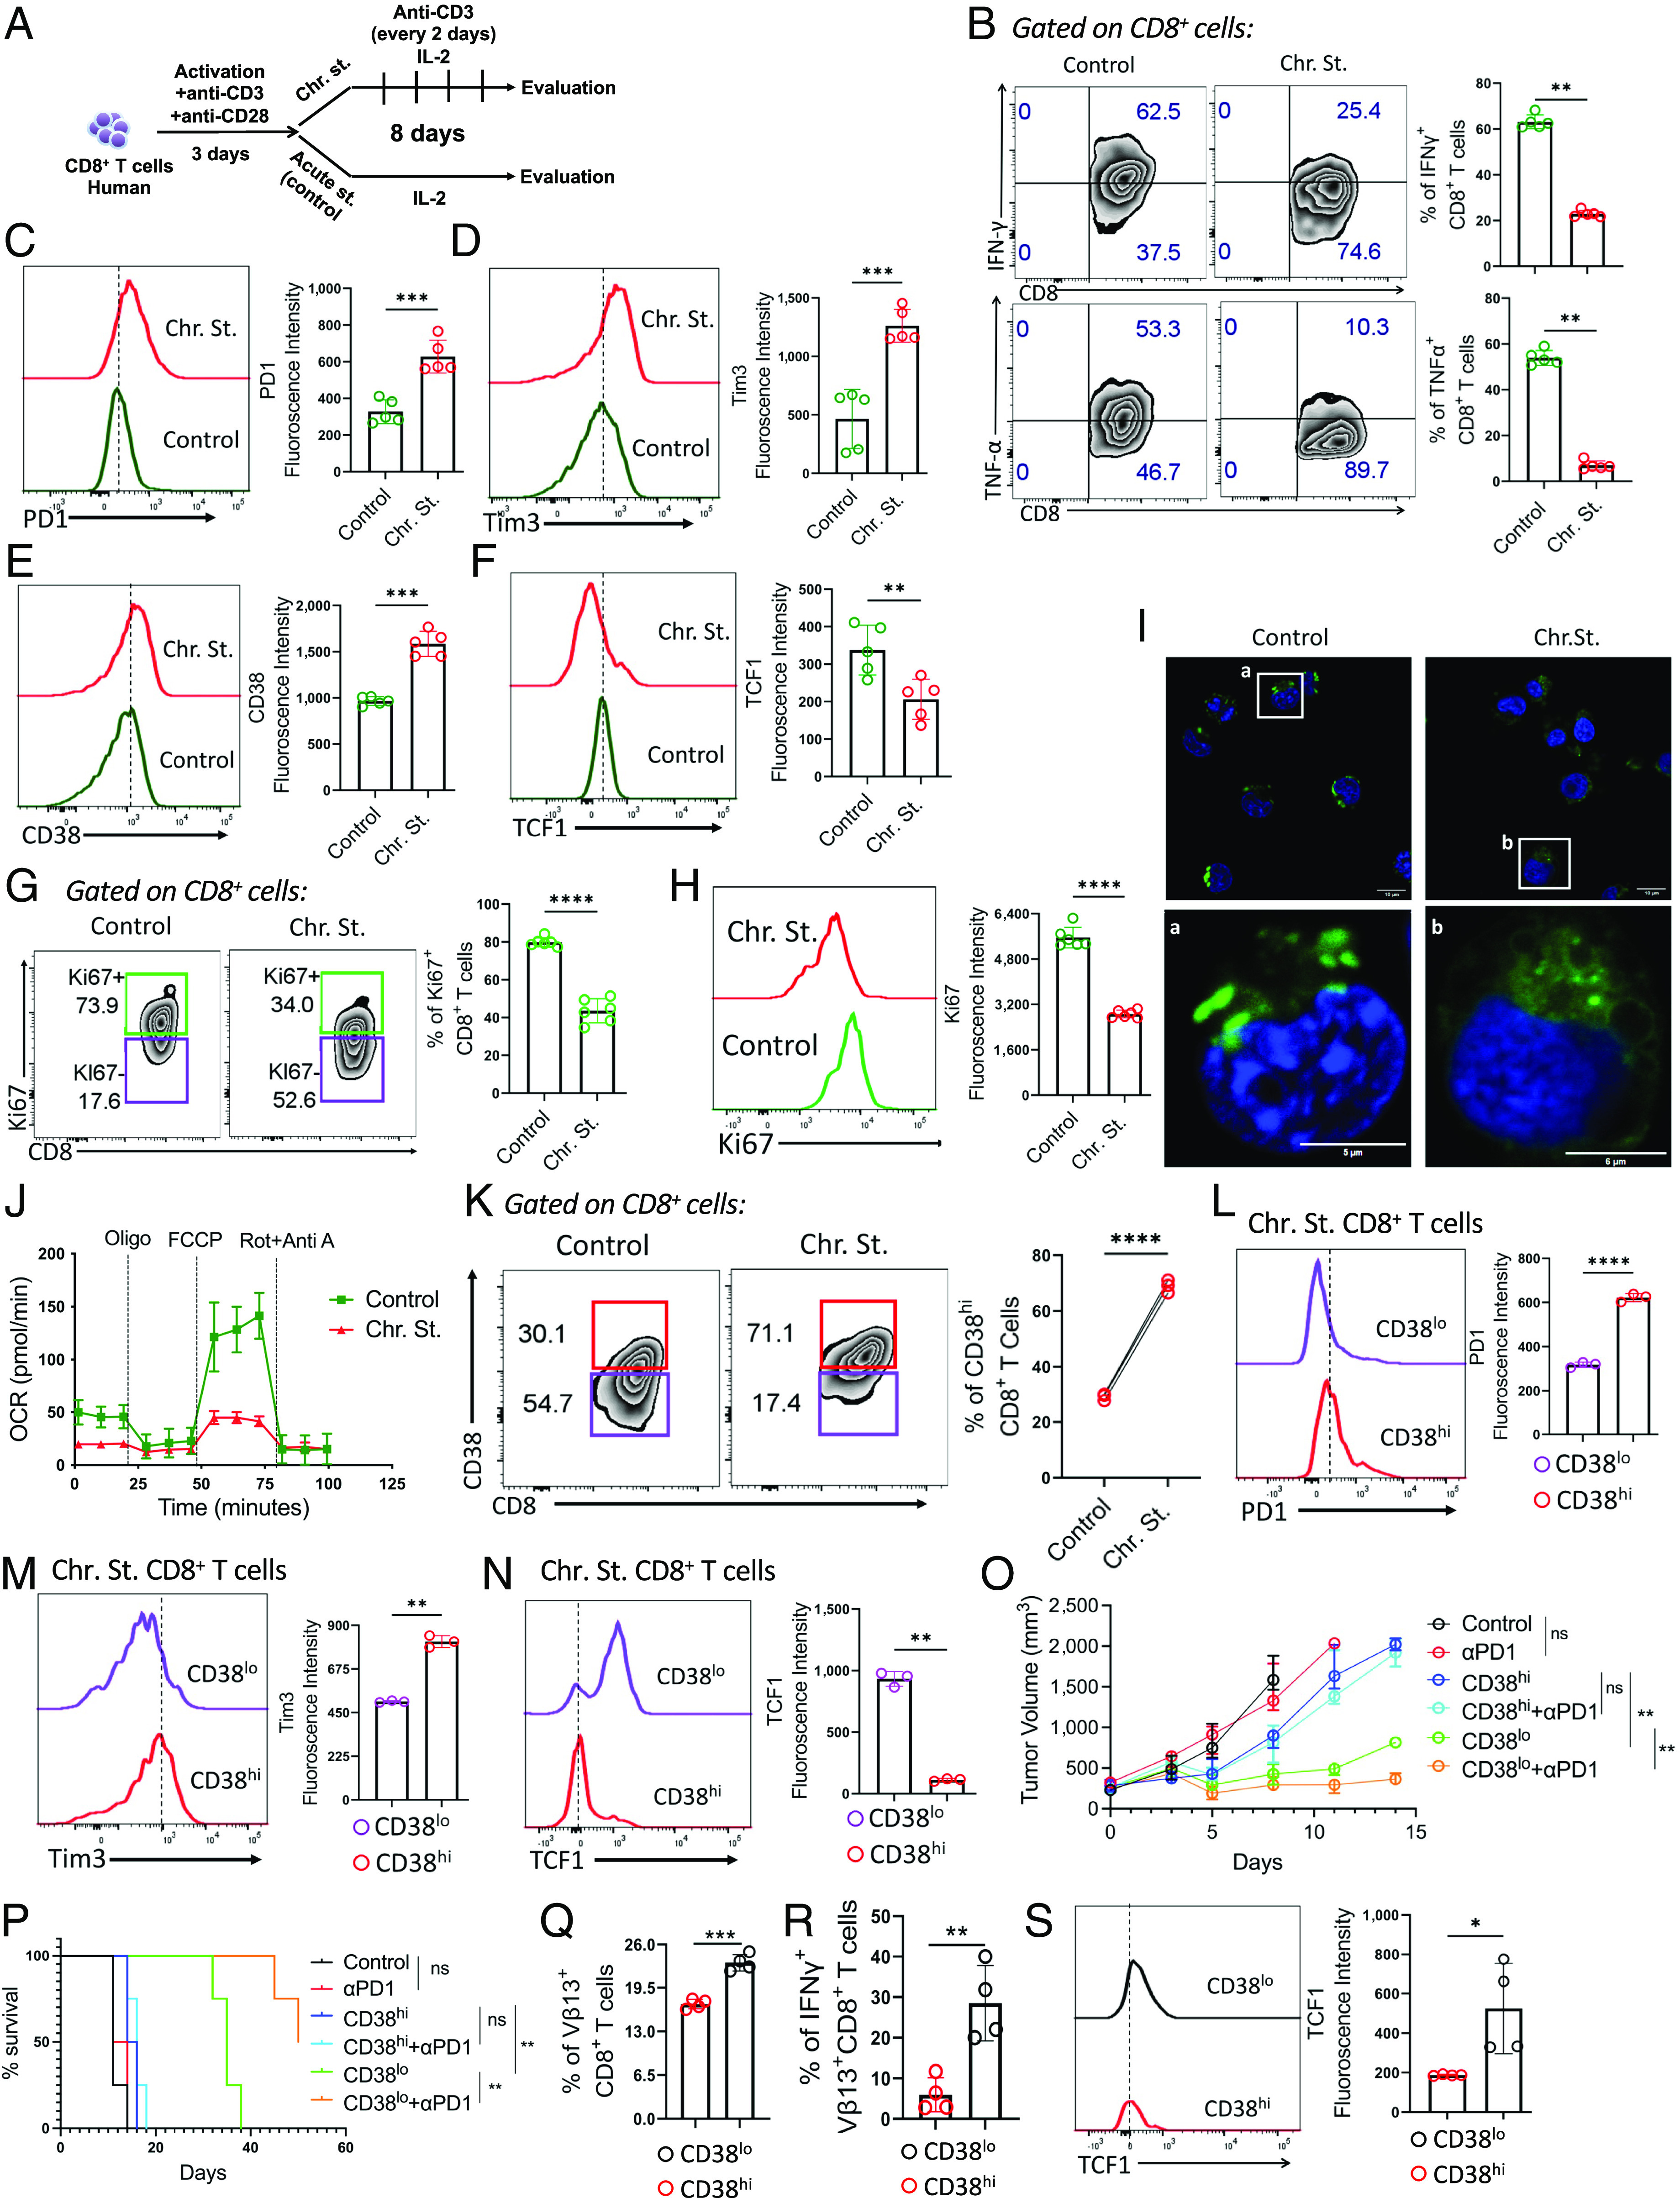
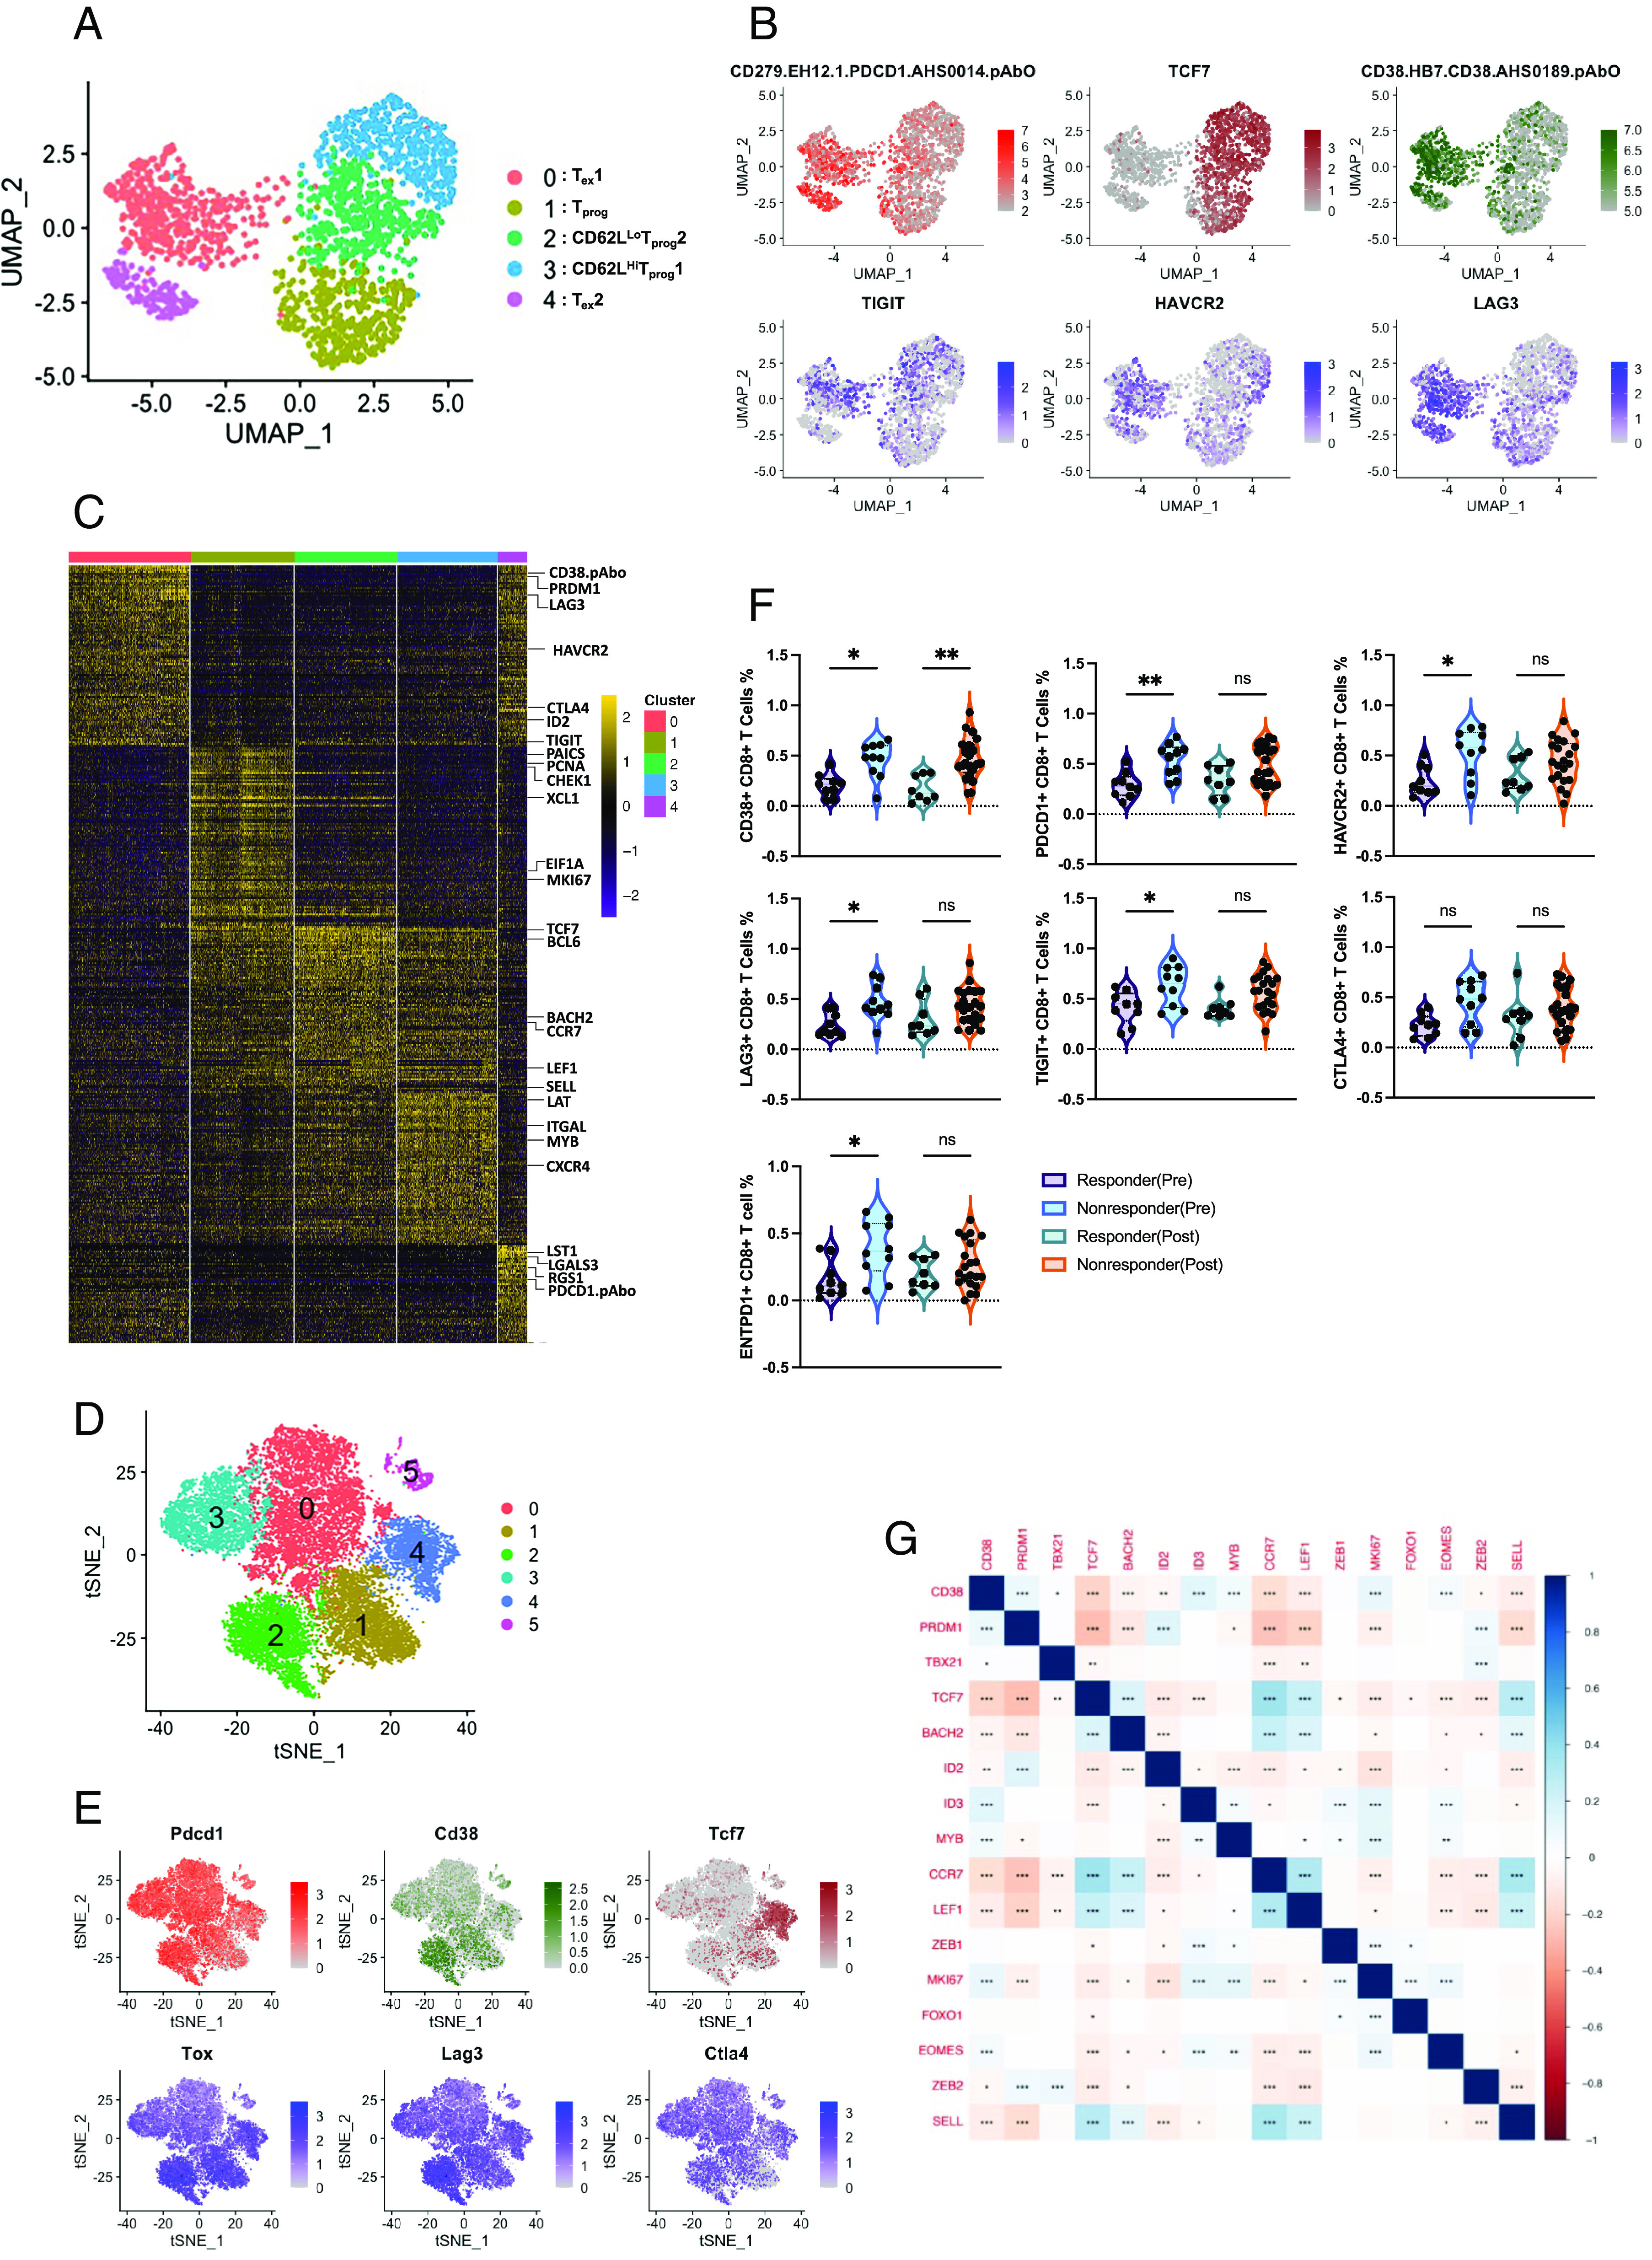
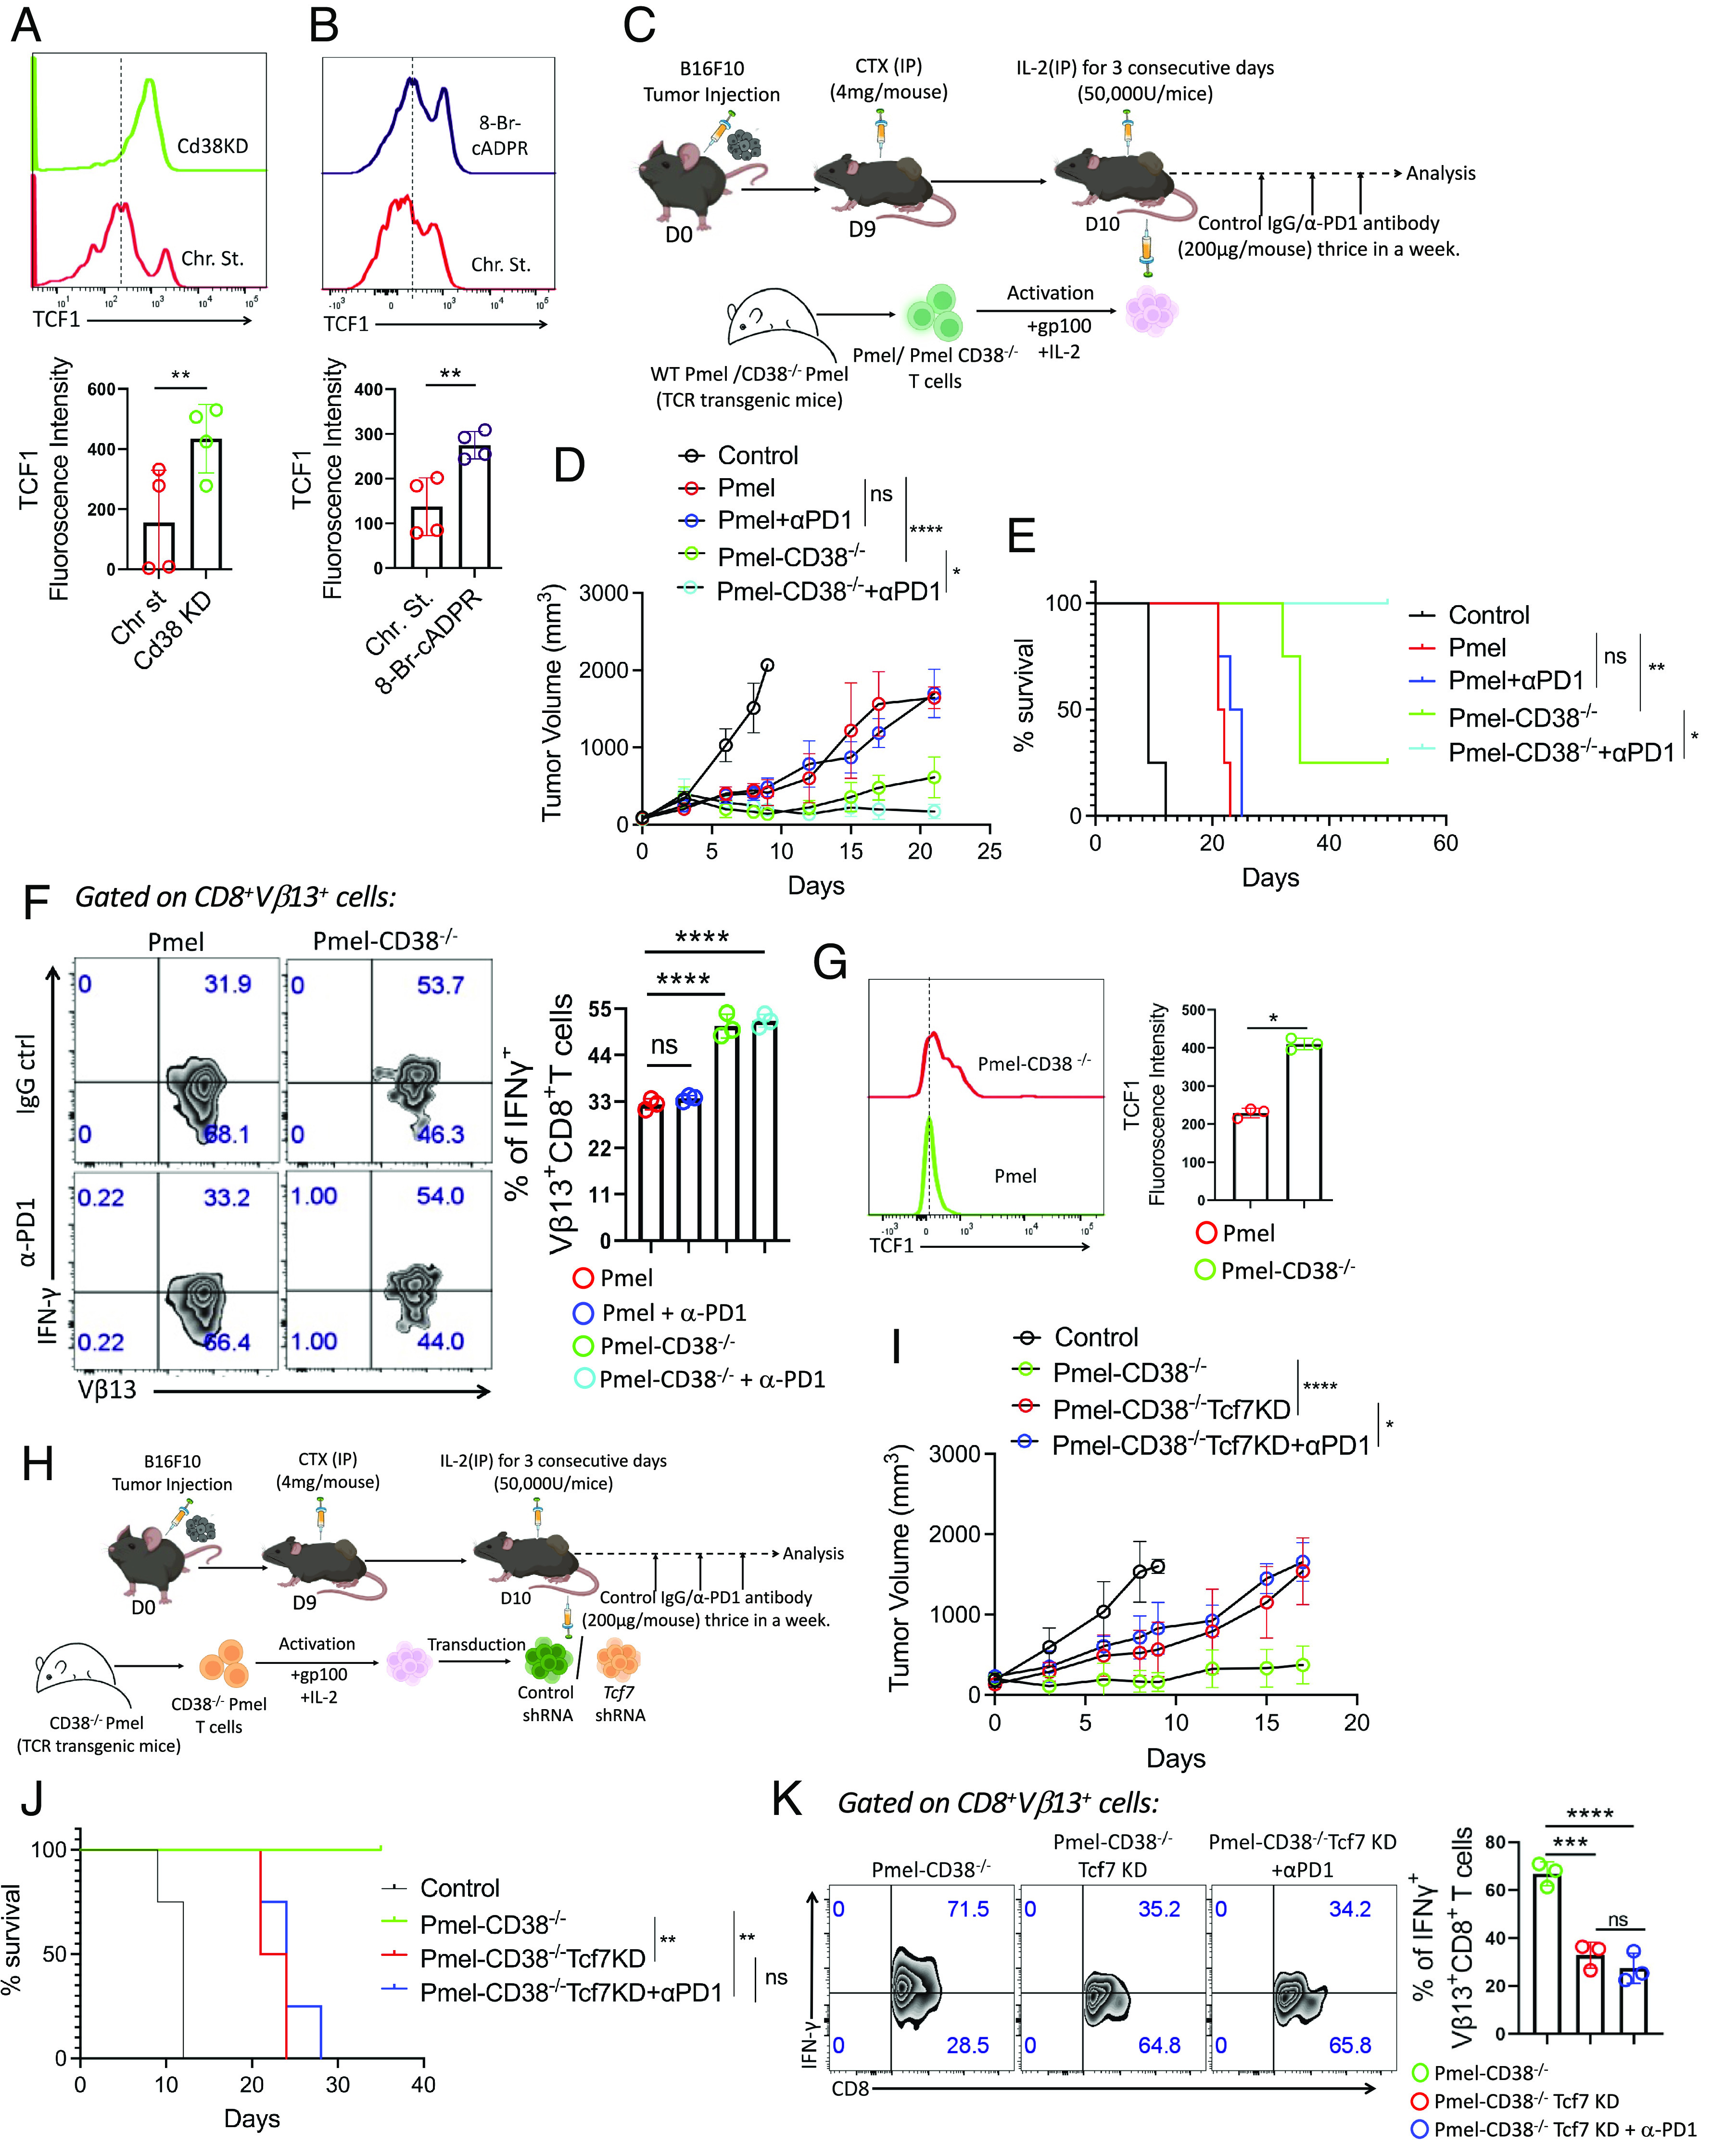
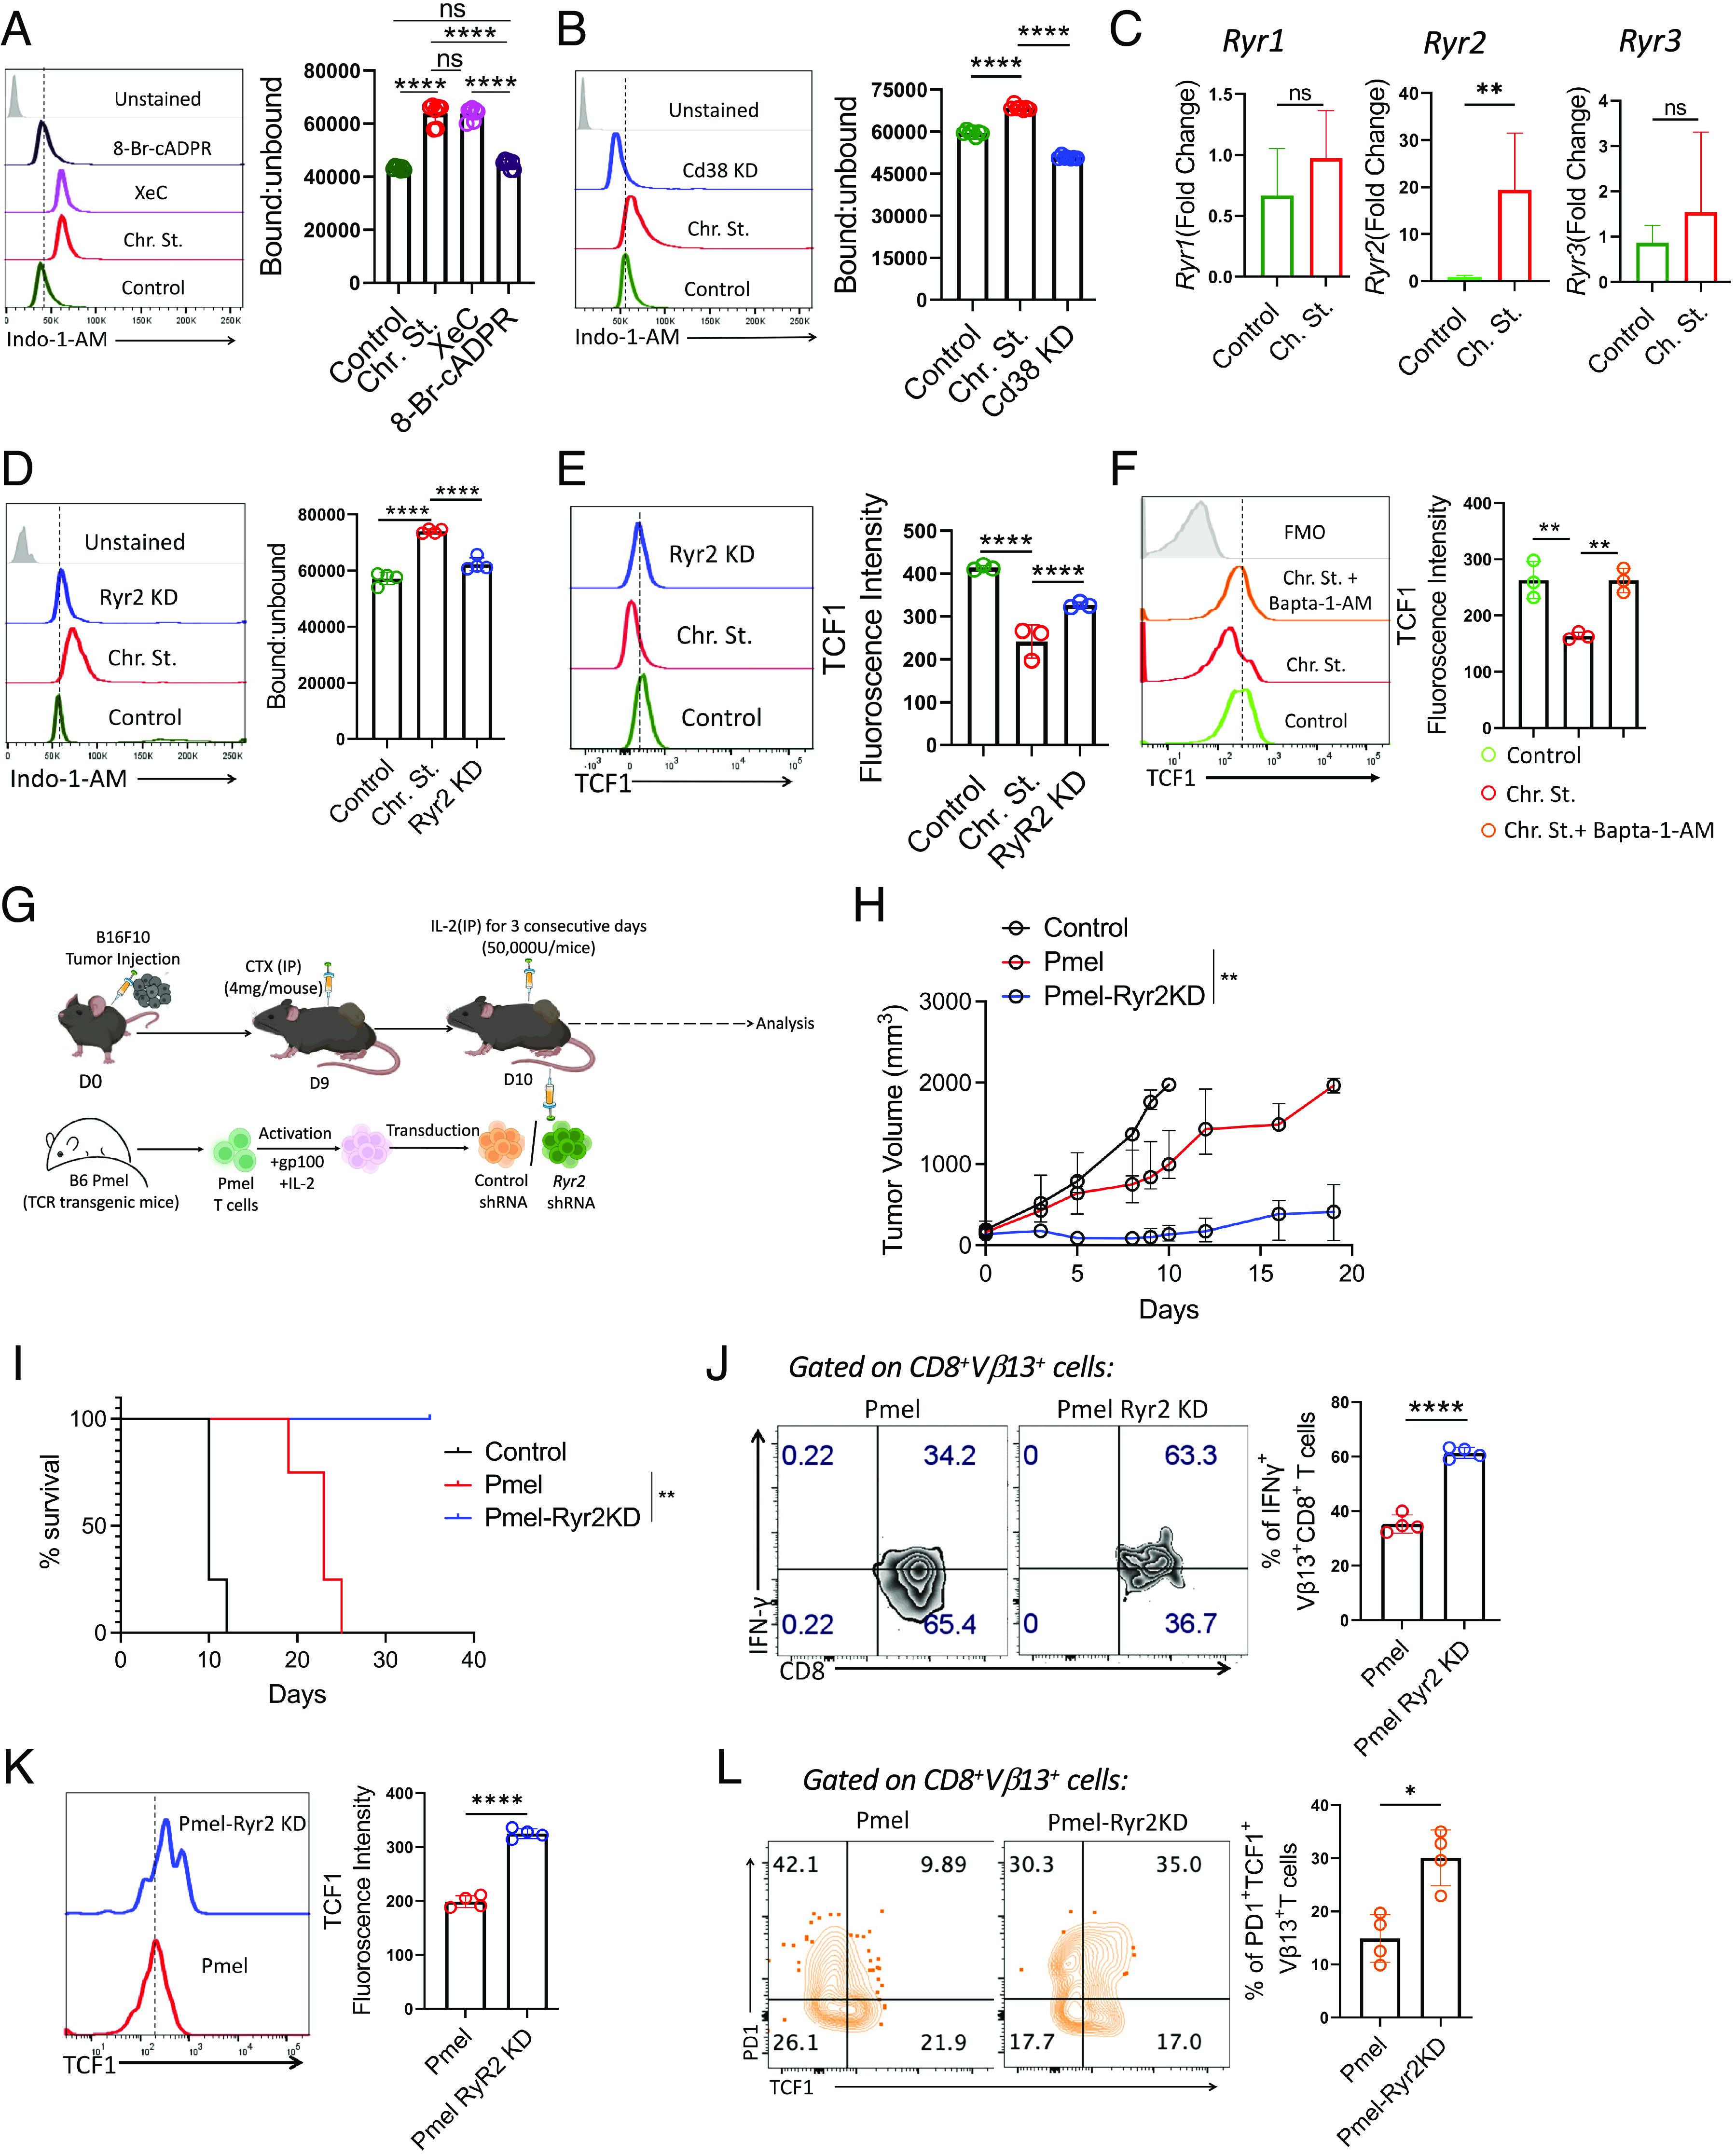
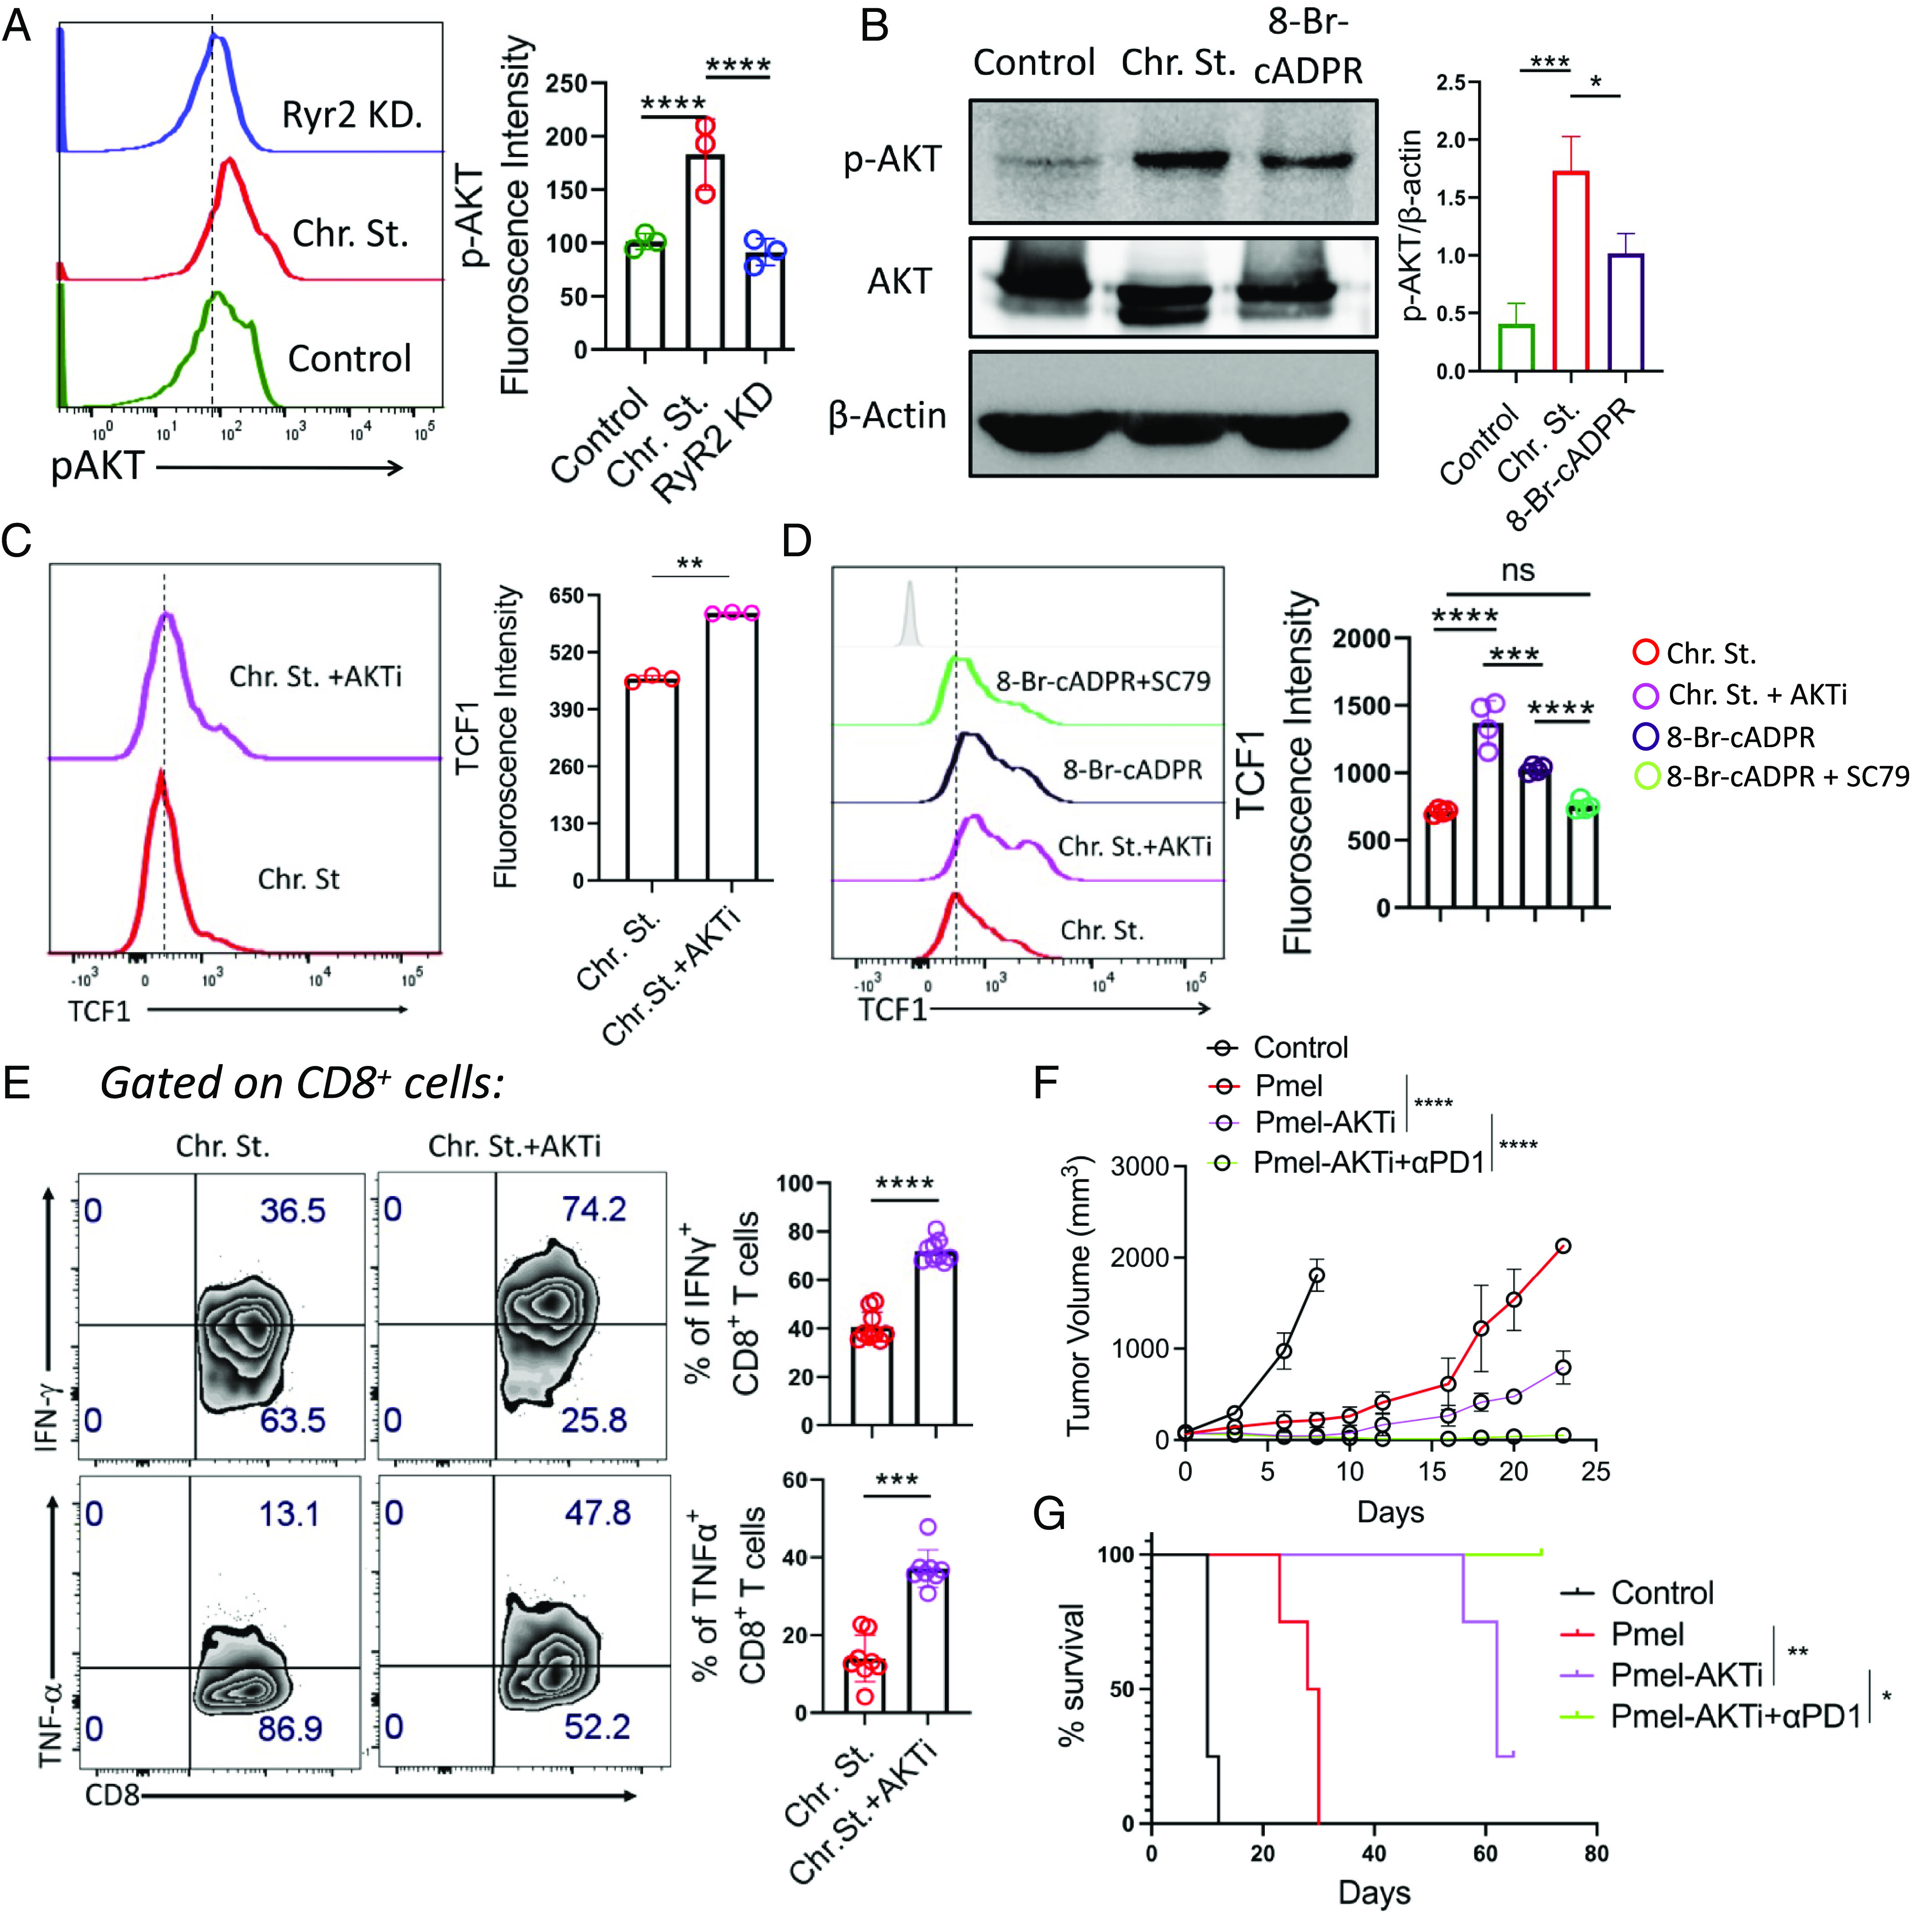
PD1 blockade therapy, harnessing the cytotoxic potential of CD8+ T cells, has yielded clinical success in treating malignancies. However, its efficacy is often limited due to the progressive differentiation of intratumoral CD8+ T cells into a hypofunctional state known as terminal exhaustion. Despite identifying CD8+ T cell subsets associated with immunotherapy resistance, the molecular pathway triggering the resistance remains elusive. Given the clear association of CD38 with CD8+ T cell subsets resistant to anti-PD1 therapy, we investigated its role in inducing resistance. Phenotypic and functional characterization, along with single-cell RNA sequencing analysis of both in vitro chronically stimulated and intratumoral CD8+ T cells, revealed that CD38-expressing CD8+ T cells are terminally exhausted. Exploring the molecular mechanism, we found that CD38 expression was crucial in promoting terminal differentiation of CD8+ T cells by suppressing TCF1 expression, thereby rendering them unresponsive to anti-PD1 therapy. Genetic ablation of CD38 in tumor-reactive CD8+ T cells restored TCF1 levels and improved the responsiveness to anti-PD1 therapy in mice. Mechanistically, CD38 expression on exhausted CD8+ T cells elevated intracellular Ca2+ levels through RyR2 calcium channel activation. This, in turn, promoted chronic AKT activation, leading to TCF1 loss. Knockdown of RyR2 or inhibition of AKT in CD8+ T cells maintained TCF1 levels, induced a sustained anti-tumor response, and enhanced responsiveness to anti-PD1 therapy. Thus, targeting CD38 represents a potential strategy to improve the efficacy of anti-PD1 treatment in cancer.

Keywords: CD38; T cell exhaustion; anti-PD1 resistance.


Conflict of interest statement

Competing interests statement:The authors declare no competing interest.

Figures

Fig. 1.
Fig. 1.
Phenotypic and functional characterization of intratumoral CD38-expressing CD8+ T cells. (A) Frequency of CD38hi CD8+ T cells in B6 mice bearing 15 d subcutaneously established B16-F10 melanoma. The scatter plot represents the cumulative data of four independent experiments. (BE) Expression of (B) PD1, (C) Tim3, (D) Tox, and (E) TCF1 in intratumoral CD8+ T cell stratified based on CD38 expression. Adjacent bar plots represent cumulative data of median fluorescence intensity from four independent experiments. (F) Intracellular IFNγ production by intratumoral CD38hiCD8+ and CD38loCD8+ T cells. The bar plot is representative of three independent experiments. (G) Abundance of CD38hi CD8+ T cells in B6 mice bearing 15 d subcutaneously established murine YUMM1.7 melanoma model. The adjacent scatter plot represents the cumulative data of five independent experiments. (HK) Intratumoral CD38hi and CD38lo CD8+ T cells from YUMM1.7 bearing mice were assessed for (H) PD1, (I) Tim3, (J) Tox, and (K) TCF1. Adjacent bar plots represent cumulative data of median (HJ) or mean (K) fluorescence intensity from five independent experiments. *P < 0.05; **P < 0.01; ***P < 0.005; ****P < 0.0001; ns, nonsignificant.
Fig. 2.
Fig. 2.
Chronic TCR stimulation drives the expression of CD38 on T cells. (A) Schematic diagram representing the protocol used for generating control or chronic CD8+ T cells from healthy human donors. (BH) Control or chronic CD8+ T cells were assessed for (B) production of intracellular cytokines, expression of (C) PD1, (D) Tim3, (E) CD38, (F) TCF1, (G) frequency of Ki67+ CD8 T cells, and (H) Ki67 expression. (I) Confocal microscopic image representing distinct mitochondrial morphology stained with MitoTracker Green (in green). Nuclei were stained with DAPI (in blue). The Lower panels show the magnified images of the cells in the white box drawn in the Upper panels. (J) Oxygen consumption rate (OCR) under basal condition and in response to indicated mitochondrial inhibitors. (K) Control and chronically stimulated CD8+ T cells were evaluated for the frequency of CD38hi CD8+ T cells. (LN) Expression of (L) PD1, (M) Tim3, and (N) TCF1 in CD38hi and CD38lo CD8+ T cells obtained from chronically stimulated CD8+ T cells. (O) Assessment of tumor growth after adoptive transfer of CD38hi and CD38lo Pmel T cells, either with control IgG or in combination with anti-PD1 antibody in mice bearing B16-F10 melanoma tumor. (P) KM curves for time-to-killing for experimental conditions are shown. (QS) Adoptively transferred Vβ13+ Pmel T cells retrieved from the tumor site were assessed for (Q) persistence, (R) intracellular IFNγ production, and (S) expression of TCF1. Bar plots adjacent to figures represent cumulative data of (B) frequency of cytokine-positive cells from five, (CF) mean fluorescence intensity from five, (G) frequency of cells from six, (H) mean fluorescence intensity from six, (J) three, (K) frequency of cells from three, (L and M) mean fluorescence intensity from three, (N) median fluorescence intensity from three, and (S) mean fluorescence intensity from four independent experiments. *P < 0.05; **P < 0.01; ***P < 0.005; ****P < 0.0001; ns, nonsignificant.
Fig. 3.
Fig. 3.
CD38hiCD8+ T cells exhibit a distinct transcriptomic signature. (A) UMAP visualization of the scRNA-seq clusters of chronically stimulated CD8+ T cells from 2 donors. (B) Single-cell transcription levels of representative genes illustrated in the UMAP plot. Transcription levels and protein expression are color-coded: red (PD1), brown (TCF7), and green (CD38); for the Bottom panel: blue, expressed; gray, not expressed. (C) Heat map showing the top hundred differentially expressed genes (ranked by log2 fold change) of all identified clusters. (D) tSNE visualization of the scRNA-seq clusters of murine CD8+ T cells from 2 samples: GSE122712 (gp33 tetramer+ CD8+ T cells isolated on day 28 post-infection from mice chronically infected with Lymphocytic choriomeningitis (LCMV) clone 13 and GSE122675 (tumor infiltrating CD8+ T cells from B16-OVA mouse melanoma tumor). (E) Single-cell transcription levels of representative genes illustrated in the tSNE plot. Transcription levels are color-coded: red (Pdcd1), brown (Tcf7), and green (CD38); for Bottom panel: blue, expressed and gray, not expressed. (F) Frequency of respective marker expressing CD8+ T cells (1 log normalized count as the threshold) in pre and post-treatment tumor lesions from responder and non-responder groups, as determined by scRNA-seq analysis (One-way ANOVA, *P < 0.05; **P < 0.01; ***P < 0.005; ****P < 0.0001; ns, nonsignificant). (G) Spearman correlation plot for genes of interest. Correlation with a P-value < 0.05 was considered significant. (*P < 0.05; **P < 0.01; ***P < 0.005; ****P < 0.0001; ns, nonsignificant).
Fig. 4.
Fig. 4.
Inhibition of CD38 restores TCF1 expression and responsiveness to anti-PD1 therapy. (A and B) TCF1 expression in chronically expanded CD8+ T cells: (A) transduced with either control shRNA or CD38 shRNA, and (B) treated with either vehicle control or 8-Br-cADPR. Bottom panels represent cumulative data of median fluorescence intensity from four independent experiments. (C) Schematic representation of the ACT protocol where C57BL/6 mice (n = 4 mice/group) with subcutaneously established B16-F10 tumor adoptively transferred with 0.75 × 10⁶ WT Pmel or CD38−/− Pmel T cells with or without anti-PD1 treatment (200 μg/mouse, thrice a week) and were evaluated for: (D) tumor growth, and (E) survival. (F and G) Assessment of (F) intracellular cytokine production, and (G) TCF1 expression in CD8+Vβ13+ T cells obtained from the tumor site. (H) Schematic representation of the adoptive transfer strategy of Pmel-CD38−/− and Pmel-CD38−/− Tcf7KD T cells with or without anti-PD1 treatment in mice (n = 4) subcutaneously established B16-F10 melanoma tumor. (I) Mean tumor volume at different time points is presented. (J) KM curves for time-to-killing for experimental conditions are shown. (K) IFNγ production by intratumoral CD8+Vβ13+ T cells and the Bottom panel represent the cumulative data from three different mice. *P < 0.05; **P < 0.01; ***P < 0.005; ****P < 0.0001; ns, nonsignificant.
Fig. 5.
Fig. 5.
CD38 induces elevation of intracellular Ca2+ levels through the cADPR–RyR2 axis. (A and B) Intracellular calcium level as measured by ratio of bound to unbound Indo-1-AM in A control and chronically stimulated T cells treated either with XeC (5 µM) or 8-Br-cADPR (2.5 µM), (B) control and chronically stimulated T cells transduced either with control shRNA or CD38 shRNA. (C) Transcript levels of Ryr1, Ryr2, and Ryr3. (D and E) Control and chronically stimulated T cells transduced either with control shRNA or Ryr2 shRNA were assessed for (D) intracellular calcium level as measured by the ratio of bound to unbound Indo-1-AM and (E) expression of TCF1. (F) Control and chronic stimulated CD8+ T cells treated with or without Bapta-1-AM (13 µM) were evaluated for the expression of TCF1. (G) Schematic presentation of the experimental strategy and the differences observed in (H) tumor growth and (I) survival of tumor-bearing mice when subcutaneously established B16-F10 tumor in C57BL/6 mice (n = 4 mice/group) were treated by adoptively transferring 0.75 × 10⁶ Pmel T cells transduced with either control shRNA or Ryr2 shRNA. (J and K) Vβ13+CD8+ T cells retrieved from the tumor site were evaluated for (J) intracellular production of IFNγ, and (K) expression of TCF1. (L) Frequencies of tumor-derived Vβ13+CD8+ T cells expressing PD1 and TCF1. Adjacent bars represent cumulative data from (A and B) seven, (C and D) four, (E and F) cumulative data of mean fluorescence intensity from three, (L) frequency of PD1+TCF1+ T cells from four independent experiments. *P < 0.05; **P < 0.01; ***P < 0.005; ****P < 0.0001; ns, nonsignificant.
Fig. 6.
Fig. 6.
CD38–RyR2 axis, by promoting AKT activation, impedes TCF1 expression in exhausted T cells. (A and B) Expression of p-AKT level (Ser473) in (A) control and chronically stimulated T cells transduced with either control shRNA or Ryr2 shRNA by flow cytometry and (B) control and chronically stimulated T cells treated with either vehicle control or 8-Br-cADPR by western blot. (C and D) TCF1 expression in (C) chronically stimulated T cells treated with or without AKTi and (D) chronically stimulated T cells treated with either AKTi or 8-Br-cADPR or 8-Br-cADPR+SC-79. (E) Chronically stimulated CD8+ T cells expanded in the presence or absence of AKTi were checked for their cytokine production by flow cytometry. (F and G) C57BL/6 mice (n = 4/group) bearing B16-F10 tumor were either kept untreated or adoptively transferred with 0.75 × 10⁶ Pmel T cells activated in the presence or absence of AKTi. Groups of mice receiving Pmel-AKTi T cells were either administered with control IgG or Anti-PD1 antibody (200 μg/mouse, thrice per week). (F) Data in the figure demonstrate the mean tumor volume at different time points. (G) KM curves for time-to-killing for experimental conditions are shown. Data are representative of (A) three (cumulative data of mean fluorescence intensity), (B) three, (C) three (cumulative data of mean fluorescence intensity), (D) four (cumulative data of median fluorescence intensity, and (E) eight independent experiments. *P < 0.05; **P < 0.01; ***P < 0.005; ****P < 0.0001; ns, nonsignificant.

References

    1. Thommen D. S., Schumacher T. N., T cell dysfunction in cancer. Cancer Cell 33, 547–562 (2018). - PMC - PubMed
    1. Schietinger A., et al. , Tumor-specific T cell dysfunction is a dynamic antigen-driven differentiation program initiated early during tumorigenesis. Immunity 45, 389–401 (2016). - PMC - PubMed
    1. McLane L. M., Abdel-Hakeem M. S., Wherry E. J., CD8 T cell exhaustion during chronic viral infection and cancer. Annu. Rev. Immunol. 37, 457–495 (2019). - PubMed
    1. Scharping N. E., et al. , Mitochondrial stress induced by continuous stimulation under hypoxia rapidly drives T cell exhaustion. Nat. Immunol. 22, 205–215 (2021). - PMC - PubMed
    1. Vardhana S. A., et al. , Impaired mitochondrial oxidative phosphorylation limits the self-renewal of T cells exposed to persistent antigen. Nat. Immunol. 21, 1022–1033 (2020). - PMC - PubMed

MeSH terms

Substances