

EEG as a potential ground truth for the assessment of cognitive state in software development activities: A multimodal imaging study
- PMID: 38452019
- PMCID: PMC10919648
- DOI: 10.1371/journal.pone.0299108
EEG as a potential ground truth for the assessment of cognitive state in software development activities: A multimodal imaging study
Abstract
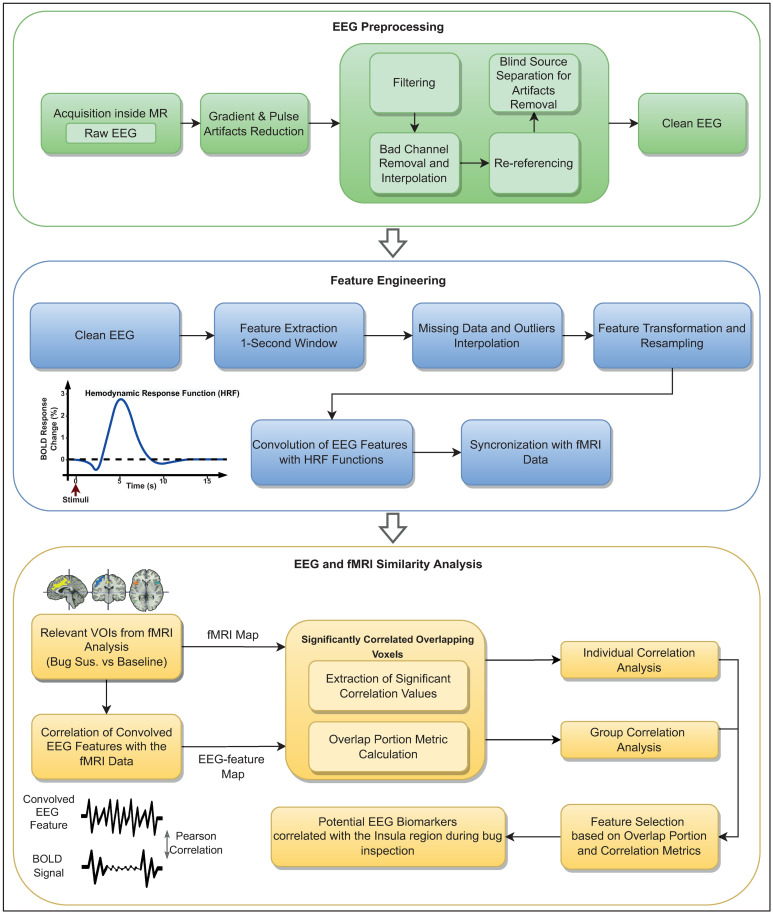
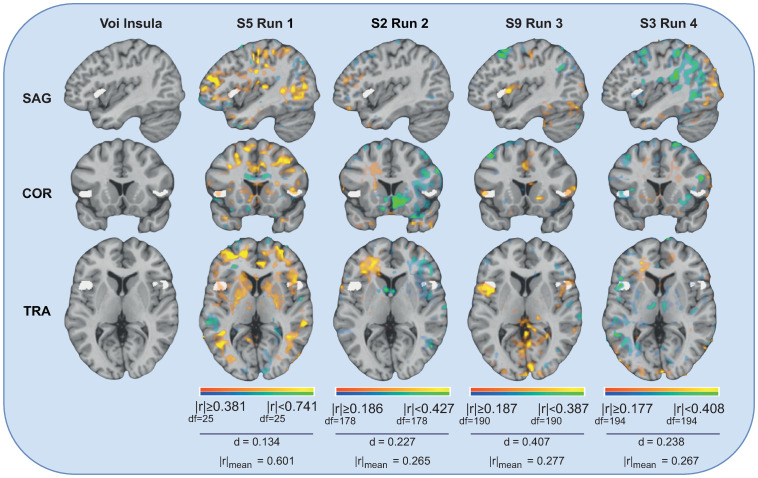
Cognitive human error and recent cognitive taxonomy on human error causes of software defects support the intuitive idea that, for instance, mental overload, attention slips, and working memory overload are important human causes for software bugs. In this paper, we approach the EEG as a reliable surrogate to MRI-based reference of the programmer's cognitive state to be used in situations where heavy imaging techniques are infeasible. The idea is to use EEG biomarkers to validate other less intrusive physiological measures, that can be easily recorded by wearable devices and useful in the assessment of the developer's cognitive state during software development tasks. Herein, our EEG study, with the support of fMRI, presents an extensive and systematic analysis by inspecting metrics and extracting relevant information about the most robust features, best EEG channels and the best hemodynamic time delay in the context of software development tasks. From the EEG-fMRI similarity analysis performed, we found significant correlations between a subset of EEG features and the Insula region of the brain, which has been reported as a region highly related to high cognitive tasks, such as software development tasks. We concluded that despite a clear inter-subject variability of the best EEG features and hemodynamic time delay used, the most robust and predominant EEG features, across all the subjects, are related to the Hjorth parameter Activity and Total Power features, from the EEG channels F4, FC4 and C4, and considering in most of the cases a hemodynamic time delay of 4 seconds used on the hemodynamic response function. These findings should be taken into account in future EEG-fMRI studies in the context of software debugging.
Copyright: © 2024 Medeiros et al. This is an open access article distributed under the terms of the Creative Commons Attribution License, which permits unrestricted use, distribution, and reproduction in any medium, provided the original author and source are credited.
Conflict of interest statement
The authors have declared that no competing interests exist.
Figures


References
-
- McConnell SC. Code Complete: A Practical Handbook of Software Construction. Microsoft Press; 2004.
-
- Shah SMA, Morisio M, Torchiano M. The impact of process maturity on defect density. In: Proceedings of the 2012 ACM-IEEE International Symposium on Empirical Software Engineering and Measurement. IEEE; 2012. p. 315–318.
-
- Boehm B, Port D, Jain A, Basili V. Achieving CMMI Level 5 improvements with MBASE and the CeBASE method. CrossTalk. 2002;15(5):9–16.
-
- Honda N, Yamada S. Empirical Analysis for High Quality SW Development. Ameri Jour Op Research. 2012. doi: 10.4236/ajor.2012.21004 - DOI
-
- Zhang H. An investigation of the relationships between lines of code and defects. In: 2009 IEEE International Conference on Software Maintenance. IEEE; 2009. p. 274–283.
MeSH terms
LinkOut - more resources
Full Text Sources
Miscellaneous
