

Multiple genetic loci influence vaccine-induced protection against Mycobacterium tuberculosis in genetically diverse mice
- PMID: 38452145
- PMCID: PMC10950258
- DOI: 10.1371/journal.ppat.1012069
Multiple genetic loci influence vaccine-induced protection against Mycobacterium tuberculosis in genetically diverse mice
Abstract
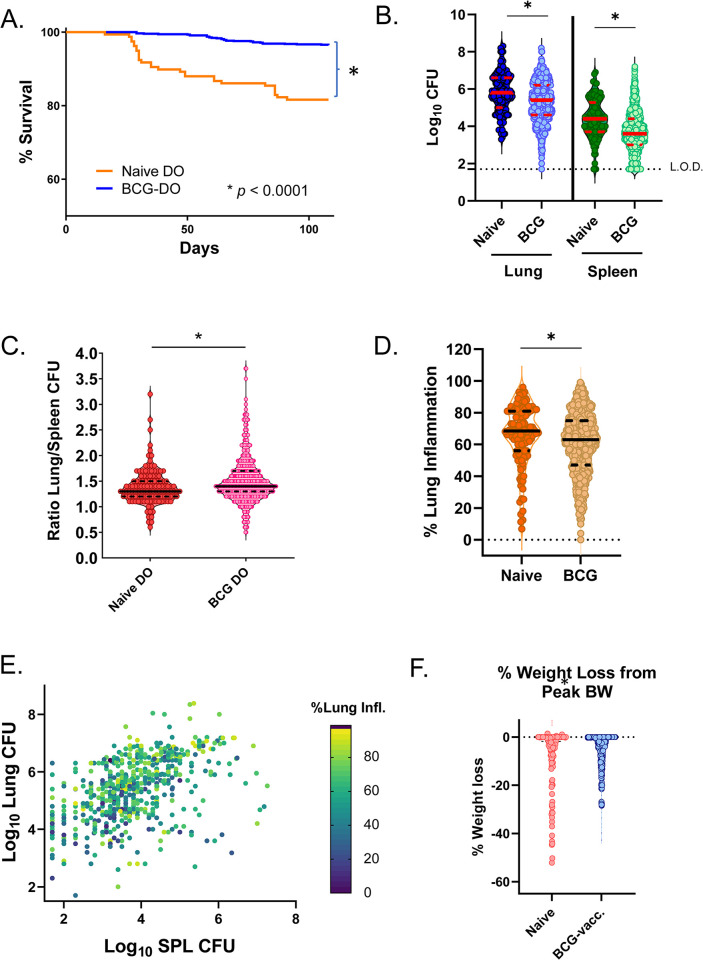
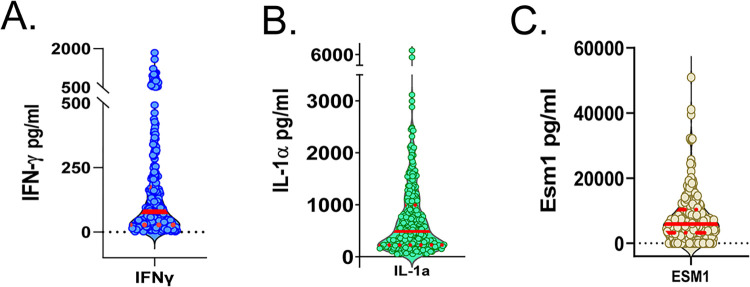
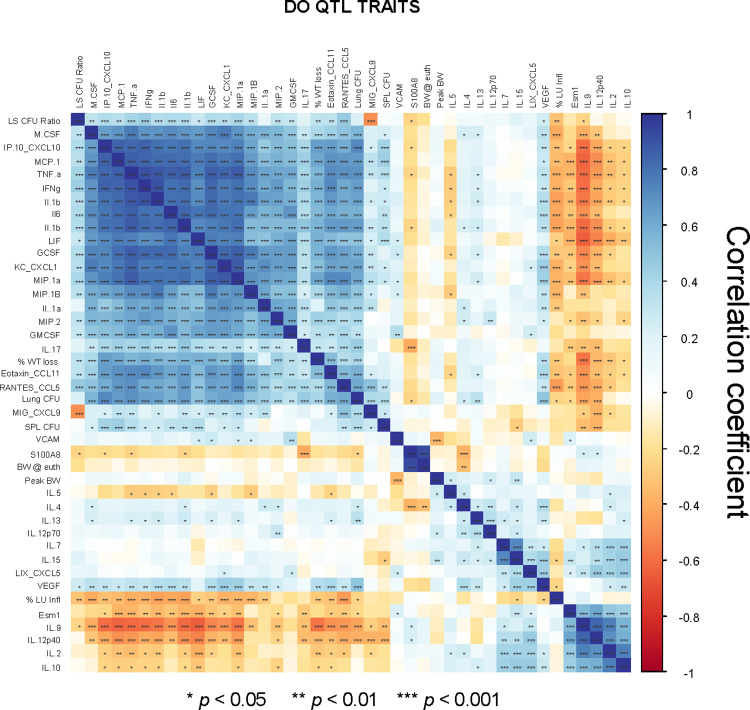
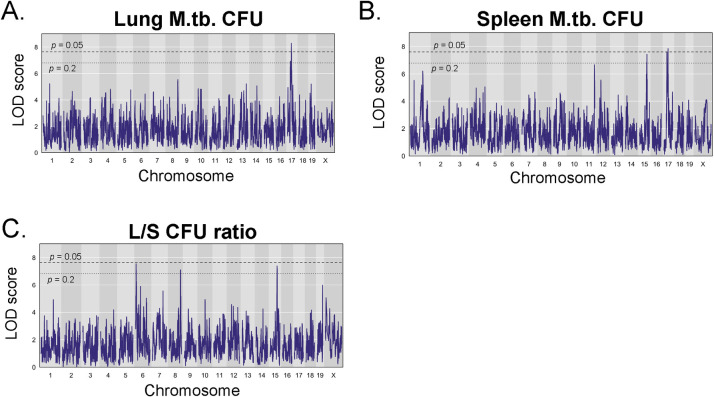
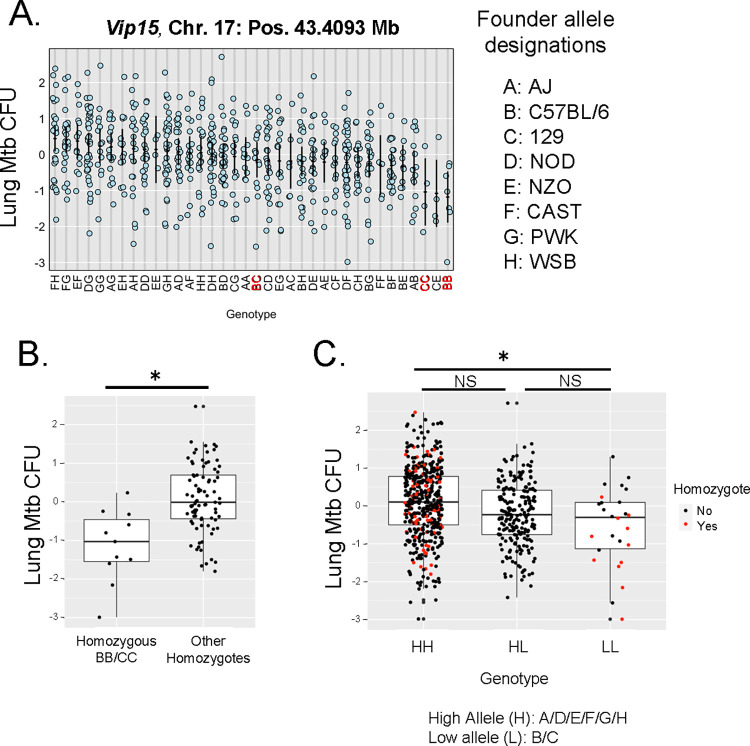
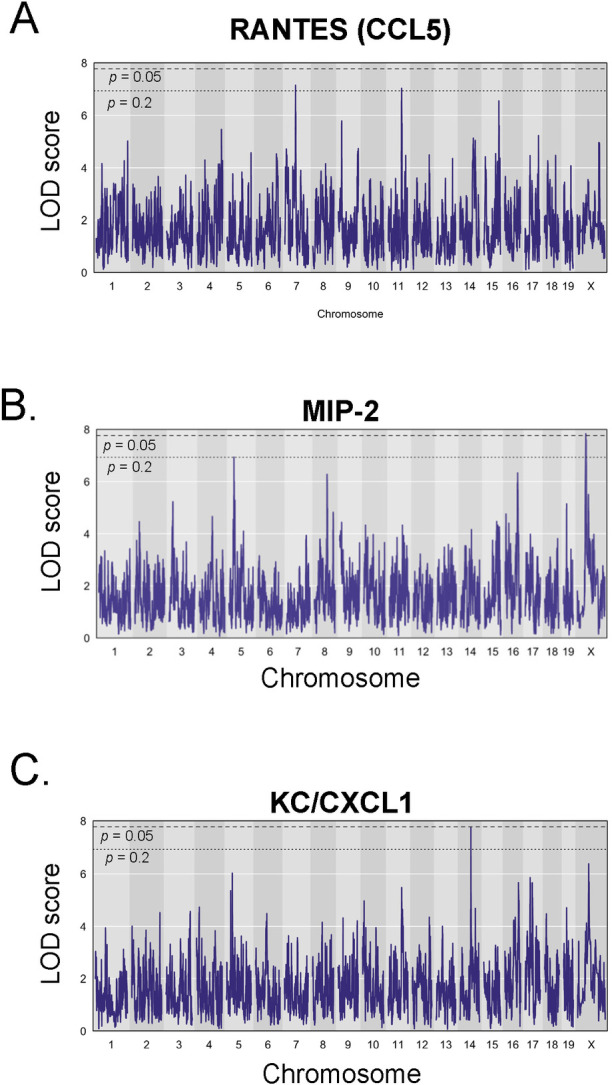
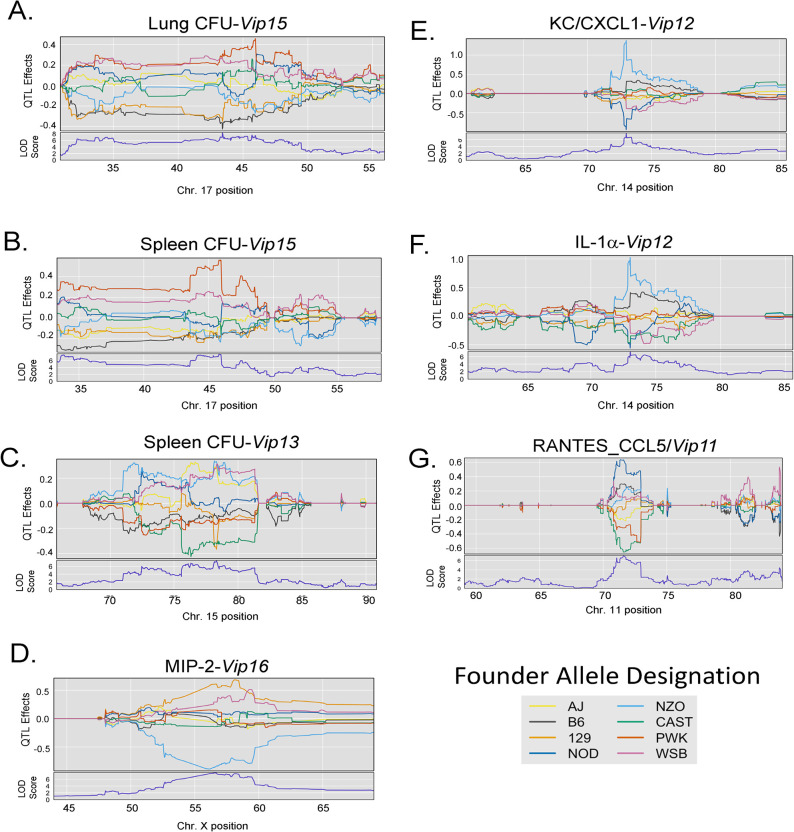
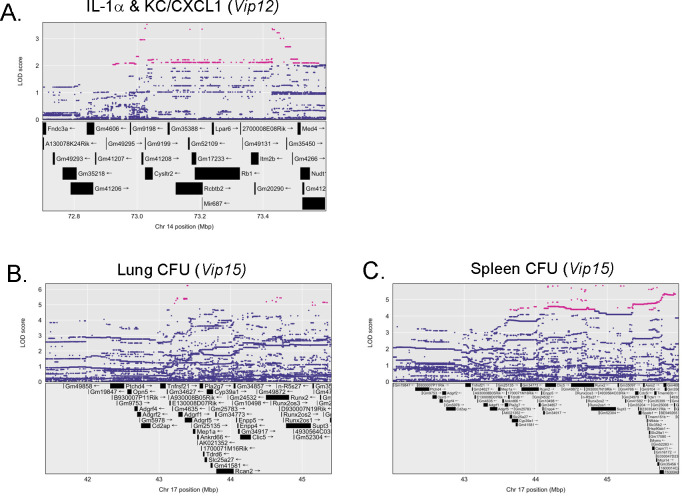
Mycobacterium tuberculosis (M.tb.) infection leads to over 1.5 million deaths annually, despite widespread vaccination with BCG at birth. Causes for the ongoing tuberculosis endemic are complex and include the failure of BCG to protect many against progressive pulmonary disease. Host genetics is one of the known factors implicated in susceptibility to primary tuberculosis, but less is known about the role that host genetics plays in controlling host responses to vaccination against M.tb. Here, we addressed this gap by utilizing Diversity Outbred (DO) mice as a small animal model to query genetic drivers of vaccine-induced protection against M.tb. DO mice are a highly genetically and phenotypically diverse outbred population that is well suited for fine genetic mapping. Similar to outcomes in people, our previous studies demonstrated that DO mice have a wide range of disease outcomes following BCG vaccination and M.tb. challenge. In the current study, we used a large population of BCG-vaccinated/M.tb.-challenged mice to perform quantitative trait loci mapping of complex infection traits; these included lung and spleen M.tb. burdens, as well as lung cytokines measured at necropsy. We found sixteen chromosomal loci associated with complex infection traits and cytokine production. QTL associated with bacterial burdens included a region encoding major histocompatibility antigens that are known to affect susceptibility to tuberculosis, supporting validity of the approach. Most of the other QTL represent novel associations with immune responses to M.tb. and novel pathways of cytokine regulation. Most importantly, we discovered that protection induced by BCG is a multigenic trait, in which genetic loci harboring functionally-distinct candidate genes influence different aspects of immune responses that are crucial collectively for successful protection. These data provide exciting new avenues to explore and exploit in developing new vaccines against M.tb.
Copyright: This is an open access article, free of all copyright, and may be freely reproduced, distributed, transmitted, modified, built upon, or otherwise used by anyone for any lawful purpose. The work is made available under the Creative Commons CC0 public domain dedication.
Conflict of interest statement
The authors have declared that no competing interests exist.
Figures
Similar articles
-
Listeria-Vectored Multiantigenic Tuberculosis Vaccine Enhances Protective Immunity against Aerosol Challenge with Virulent Mycobacterium tuberculosis in BCG-Immunized C57BL/6 and BALB/c Mice.mBio. 2022 Jun 28;13(3):e0068722. doi: 10.1128/mbio.00687-22. Epub 2022 Jun 1. mBio. 2022. PMID: 35642945 Free PMC article.
-
[Novel vaccines against M. tuberculosis].Kekkaku. 2006 Dec;81(12):745-51. Kekkaku. 2006. PMID: 17240920 Review. Japanese.
-
The Diversity Outbred Mouse Population Is an Improved Animal Model of Vaccination against Tuberculosis That Reflects Heterogeneity of Protection.mSphere. 2020 Apr 15;5(2):e00097-20. doi: 10.1128/mSphere.00097-20. mSphere. 2020. PMID: 32295871 Free PMC article.
-
Tuberculosis Susceptibility and Vaccine Protection Are Independently Controlled by Host Genotype.mBio. 2016 Sep 20;7(5):e01516-16. doi: 10.1128/mBio.01516-16. mBio. 2016. PMID: 27651361 Free PMC article.
-
Protection against tuberculosis by Bacillus Calmette-Guérin (BCG) vaccination: A historical perspective.Med. 2022 Jan 14;3(1):6-24. doi: 10.1016/j.medj.2021.11.006. Epub 2021 Dec 31. Med. 2022. PMID: 35590145 Review.
Cited by
-
A review of the efficacy of clinical tuberculosis vaccine candidates in mouse models.Front Immunol. 2025 May 29;16:1609136. doi: 10.3389/fimmu.2025.1609136. eCollection 2025. Front Immunol. 2025. PMID: 40510368 Free PMC article. Review.
-
Immune correlates of protection as a game changer in tuberculosis vaccine development.NPJ Vaccines. 2024 Oct 30;9(1):208. doi: 10.1038/s41541-024-01004-w. NPJ Vaccines. 2024. PMID: 39478007 Free PMC article. Review.
-
Noncanonical T cell responses are associated with protection from tuberculosis in mice and humans.J Exp Med. 2025 Jul 7;222(7):e20241760. doi: 10.1084/jem.20241760. Epub 2025 Apr 7. J Exp Med. 2025. PMID: 40192640
-
The Impact of Animal Models and Strain Standardization on the Evaluation of Tuberculosis Vaccine Efficacy.Vaccines (Basel). 2025 Jun 21;13(7):669. doi: 10.3390/vaccines13070669. Vaccines (Basel). 2025. PMID: 40733646 Free PMC article. Review.
References
-
- Kerner G, Laval G, Patin E, Boisson-Dupuis S, Abel L, Casanova JL, et al.. Human ancient DNA analyses reveal the high burden of tuberculosis in Europeans over the last 2,000 years. American Journal of Human Genetics. 2021;108(3):517–24. doi: 10.1016/j.ajhg.2021.02.009 WOS:000629143200016. - DOI - PMC - PubMed
MeSH terms
Substances
Grants and funding
LinkOut - more resources
Full Text Sources
Medical
Molecular Biology Databases
Miscellaneous
