. 2024 Jan 8;18(1):wrae035.
doi: 10.1093/ismejo/wrae035.

High niche specificity and host genetic diversity of groundwater viruses

Affiliations

High niche specificity and host genetic diversity of groundwater viruses

Emilie Gios et al. ISME J. .

Abstract

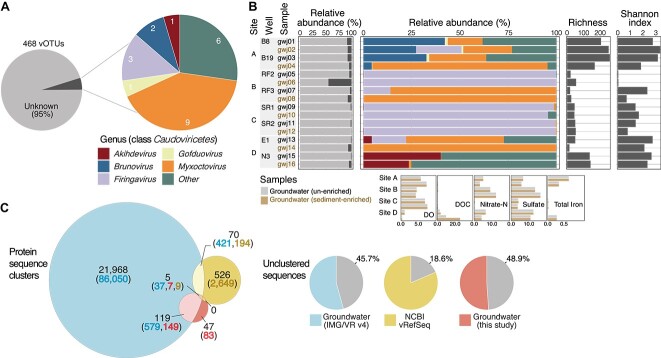
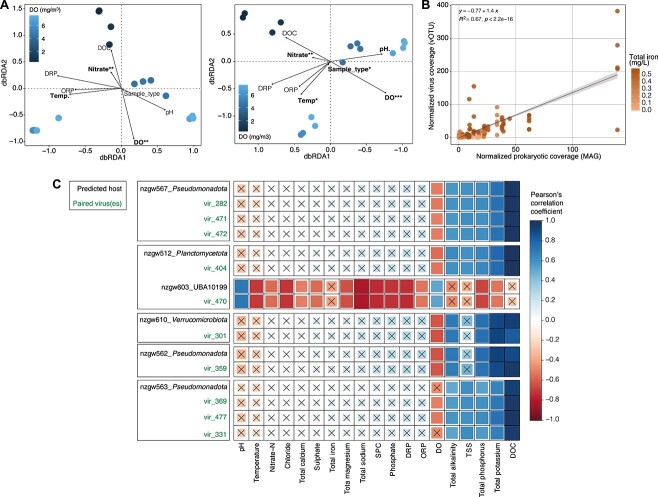
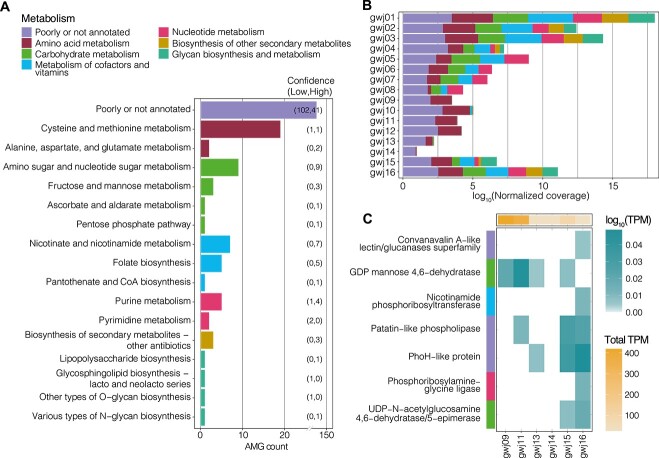
Viruses are key members of microbial communities that exert control over host abundance and metabolism, thereby influencing ecosystem processes and biogeochemical cycles. Aquifers are known to host taxonomically diverse microbial life, yet little is known about viruses infecting groundwater microbial communities. Here, we analysed 16 metagenomes from a broad range of groundwater physicochemistries. We recovered 1571 viral genomes that clustered into 468 high-quality viral operational taxonomic units. At least 15% were observed to be transcriptionally active, although lysis was likely constrained by the resource-limited groundwater environment. Most were unclassified (95%), and the remaining 5% were Caudoviricetes. Comparisons with viruses inhabiting other aquifers revealed no shared species, indicating substantial unexplored viral diversity. In silico predictions linked 22.4% of the viruses to microbial host populations, including to ultra-small prokaryotes, such as Patescibacteria and Nanoarchaeota. Many predicted hosts were associated with the biogeochemical cycling of carbon, nitrogen, and sulfur. Metabolic predictions revealed the presence of 205 putative auxiliary metabolic genes, involved in diverse processes associated with the utilization of the host's intracellular resources for biosynthesis and transformation reactions, including those involved in nucleotide sugar, glycan, cofactor, and vitamin metabolism. Viruses, prokaryotes overall, and predicted prokaryotic hosts exhibited narrow spatial distributions, and relative abundance correlations with the same groundwater parameters (e.g. dissolved oxygen, nitrate, and iron), consistent with host control over viral distributions. Results provide insights into underexplored groundwater viruses, and indicate the large extent to which viruses may manipulate microbial communities and biogeochemistry in the terrestrial subsurface.

Keywords: aquifer; auxiliary metabolic gene; bacteriophage; biogeochemical cycles; groundwater; virus.


Conflict of interest statement

The authors declare no competing interests.

Figures

Figure 1
Figure 1
Abundance and diversity of groundwater viral communities. (A) Predicted taxonomy of groundwater vOTUs based on protein clustering with viral sequences from NCBI vRefSeq sequences v201. (B) Relative abundance of unclassified vOTUs (top left); relative abundance of taxonomically classified viruses only (top middle); richness and Shannon index based on the total groundwater vOTU representative sequences (top right). Groundwater chemistry (bottom left, units mg/l for DO, and g/m3 for other analytes). (C) Summary of protein sharing network (Fig. S3) between high-quality groundwater vOTUs in this study (n = 468), NCBI vRefSeq sequences v201 (n = 3502), and all groundwater viral sequences from IMG/VR v4 (n = 160 465). In the Venn diagram, numbers of viral clusters obtained using vConTACT2 are given in black font. Numbers of genomes in clusters are given in parentheses, including those shared from each dataset as shown in the Venn diagram overlaps (blue-filled font = groundwater IMG/VR; yellow-filled font = NCBI vRefSeq; red-filled font = groundwater this study). Pie charts show the proportions of unclustered viral genomes per dataset represented by gray shading. Sequences considered as unclustered were characterized by vConTACT2 as “outliers”, “singletons”, “overlap” cluster status. Numbers of unclustered genomes for each dataset: Groundwater IMG/VR (n = 73 378), NCBI vRefSeq (n = 650), groundwater vOTUs in this study (n = 229).
Figure 2
Figure 2
Impact of groundwater parameters on total viral communities and host-virus relationship. (A) Distance-based redundancy analysis (dbRDA) of bray-Curtis dissimilarities between 16 groundwater viral communities based on normalized coverage data (viral community fraction only, left plot), and 16 groundwater prokaryotic communities based on normalized coverage data (prokaryotic community fraction only, right plot). Samples are colored according to groundwater dissolved oxygen (DO) concentrations (mg/m3). The vectors indicate fitted environmental variables significantly correlated to dbRDA coordinates (permutation test, permutations = 999; .P <0.1, *P<0.05, **P <0.01, ***P <0.001). Percentage of variance explained: 24.51 (dbRDA1) and 19.16 (dbRDA2). (B) Normalized coverages of each of the vOTU-host pairs that also showed significant (P <0.05) Pearson’s correlation to groundwater total iron content. The regression line was placed based on fitting the host versus virus pair abundance data to a linear model, and the shaded area represents 95% confidence interval. Data points are additionally colored by sample total iron content. Percentage of variance explained: 22.73 (dbRDA1) and 19.67 (dbRDA2). (C) Example of Pearson’s correlation coefficients (for top 10 pairs exhibiting the most consistent correlations with groundwater physicochemistries; Table S8) for host lineages and their viruses (one to three per host), correlated with environmental and geochemical measurements (significant when P <0.05; non-significant correlations are depicted with an “x”).
Figure 3
Figure 3
Host-virus linkages and relative abundance patterns. (A) Phylogenetic trees of the recovered bacterial (unrooted) and archaeal (rooted at midpoint) MAGs. Trees are based on either 120 concatenated bacterial marker genes or 122 concatenated archaeal marker genes from GTDB-Tk. Scale bar indicates the number of substitutions per site. The number of viruses infecting members of each lineage are indicated as numbers in orange circles (inner bubble). The red circled numbers indicate the number of viral genomes binned within a predicted host genome (outer bubble). (B) Overall relative abundance profiles (summed across all samples) of groundwater vOTUs and their putative hosts grouped by the host taxonomy at phylum level. (C) Significant Pearson’s correlation between relative abundances of vOTUs and their putative hosts. Regression line was placed based on fitting data to a linear model (gray shading = 95% confidence interval), and dashed line indicates 1:1 correlation.
Figure 4
Figure 4
Biogeochemical cycling potential of putative prokaryotic hosts. Heatmap showing the completeness of metabolic pathways (columns) encoded by the putative hosts identified as most probable (colored by phylum; Table S6). KEGG KO of genes required for various metabolic and biosynthetic functions shown here were parsed using KEGG-decoder. Number of vOTUs linked to each host indicated in salmon color.
Figure 5
Figure 5
Expression of viral replication-related genes. Total TPM for genes involved in viral replication across samples (columns). Numbers in parentheses represent the total number of genes expressed for each category (rows). Orange bubbles on top show the total numbers of active vOTUs (log scaled).
Figure 6
Figure 6
Impact of groundwater parameters on overall viral transcriptional activity. (A) Number of significant Pearson’s correlations (P <0.05) between groundwater physicochemical parameters and TPM values at the gene (left) and vOTU (right) levels. (B) Comparison between viral and prokaryotic community metrics. From top to bottom: Pie charts showing relative abundance (normalized genome coverages from metagenomic read mapping to MAGs and vOTUs); bar charts showing TPM (from metatranscriptomic read mapping to MAGs and vOTUs), Shannon index, and species richness (MAGs and vOTUs); and a heat map showing key groundwater physicochemical parameters scaled from 0 to 1.
Figure 7
Figure 7
Virus-encoded AMG repertoire and expression. (A) Number AMGs identified in the recovered viral genomes based on KEGG pathways. Bars are colored based on KEGG metabolic categories. (B) Relative abundance of the identified AMGs across all 16 groundwater samples (based on vOTU normalized contig coverage). (C) Total TPM (all viral gene expression) across samples (top), and expression of AMGs shown as TPM values per AMG (bottom). Predicted AMGs expressed were, as shown from top to bottom: vir_472_43, vir_15_120, vir_20_197, vir_323_17, vir_146_43, vir_253_14, vir_243_51. Associated DO contents were 6.83 mg/L for sample gwj09 and 7.5 mg/l for gwj11 (oxic groundwater), and 1.06 mg/l for gwj13–14 and 0.37 mg/l for gwj15–16 (dysoxic). Samples with odd numbers are groundwater; those with even numbers (e.g. gwj16) are biomass-enriched groundwater (collected post down-well sonication to release sediment and biofilms into groundwater).
Figure 8
Figure 8
Examples of groundwater viral genomes harboring AMGs. Viral genomes selected illustrate a variety of AMG functions, and transcriptionally active AMGs. The linear genome maps indicate the location of putative AMGs, viral replication-related genes, and transcriptionally active genes (black outlines in top two maps).

References

    1. Breitbart M, Bonnain C, Malki K. et al. Phage puppet masters of the marine microbial realm. Nat Microbiol 2018;3:754–66. 10.1038/s41564-018-0166-y. - DOI - PubMed
    1. Suttle CA. The significance of viruses to mortality in aquatic microbial communities. Microb Ecol 1994;28:237–43. 10.1007/BF00166813. - DOI - PubMed
    1. Brum JR, Hurwitz BL, Schofield O. et al. Seasonal time bombs: dominant temperate viruses affect Southern Ocean microbial dynamics. ISME J 2016;10:437–49. 10.1038/ismej.2015.125. - DOI - PMC - PubMed
    1. Breitbart M, Thompson LR, Suttle CA. et al. Exploring the vast diversity of marine viruses. Oceanography 2007;20:135–9. 10.5670/oceanog.2007.58. - DOI
    1. Thompson LR, Zeng Q, Kelly L. et al. Phage auxiliary metabolic genes and the redirection of cyanobacterial host carbon metabolism. Proc Natl Acad Sci USA 2011;108:E757–64. 10.1073/pnas.1102164108. - DOI - PMC - PubMed