. 2024 Apr 24;52(7):3837-3855.
doi: 10.1093/nar/gkae164.

DNA fragility at topologically associated domain boundaries is promoted by alternative DNA secondary structure and topoisomerase II activity

Affiliations

DNA fragility at topologically associated domain boundaries is promoted by alternative DNA secondary structure and topoisomerase II activity

Heather M Raimer Young et al. Nucleic Acids Res. .

Abstract

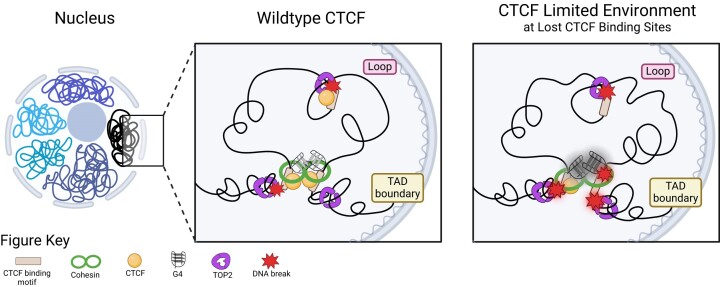
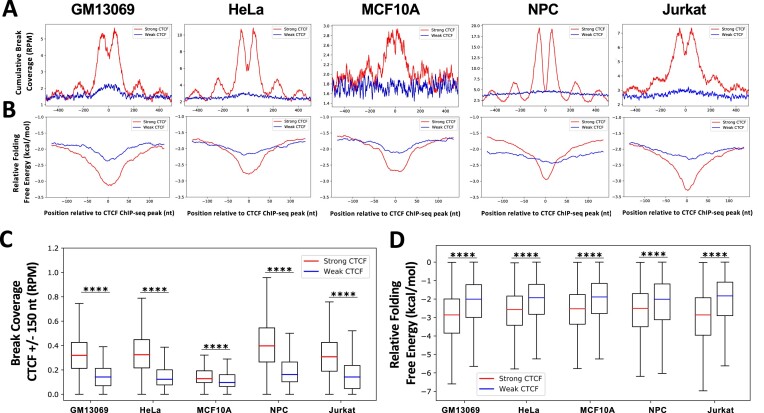
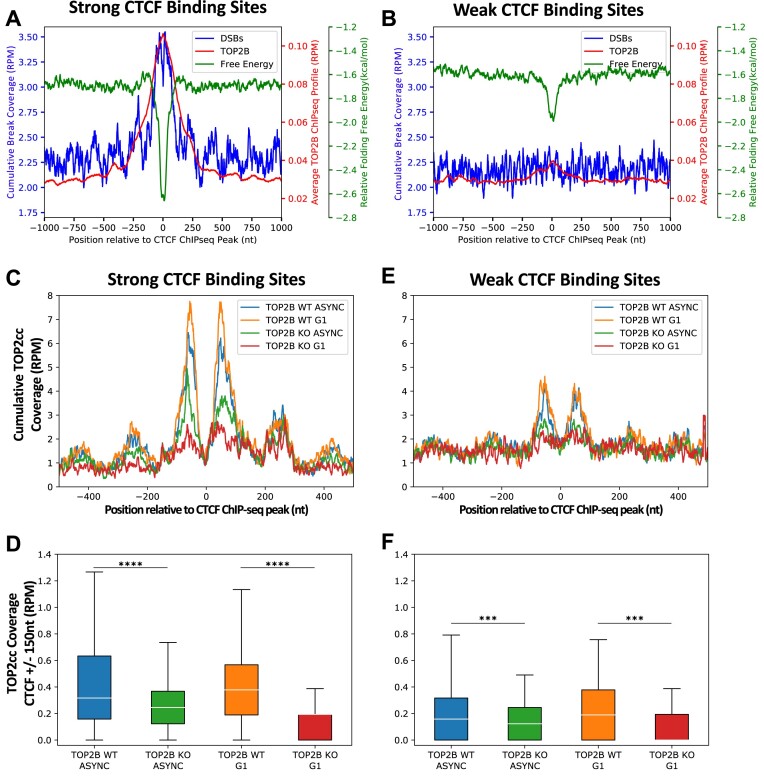
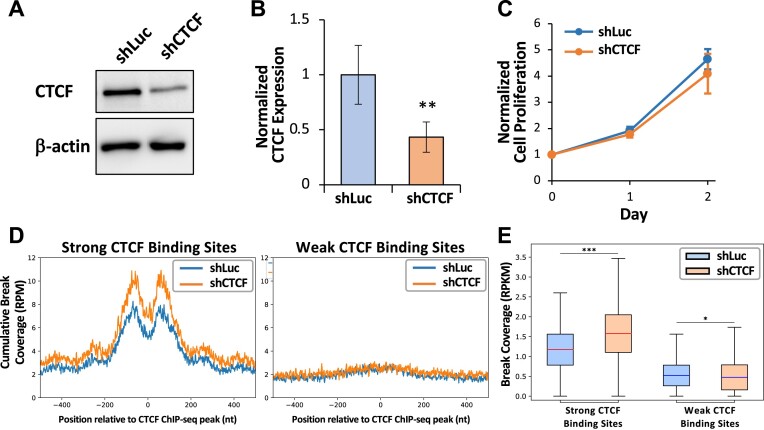
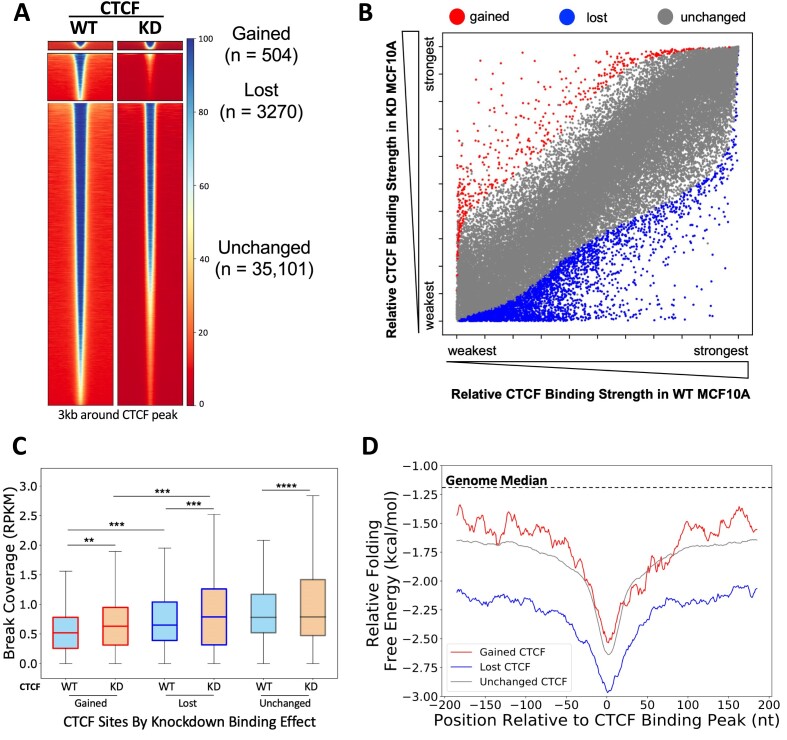
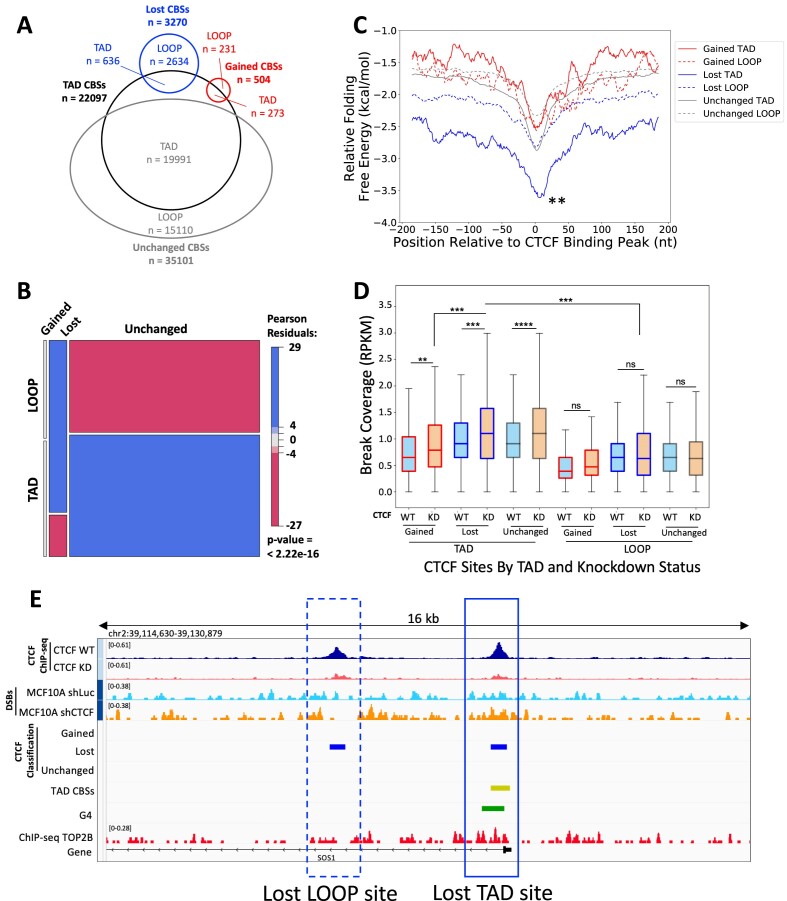
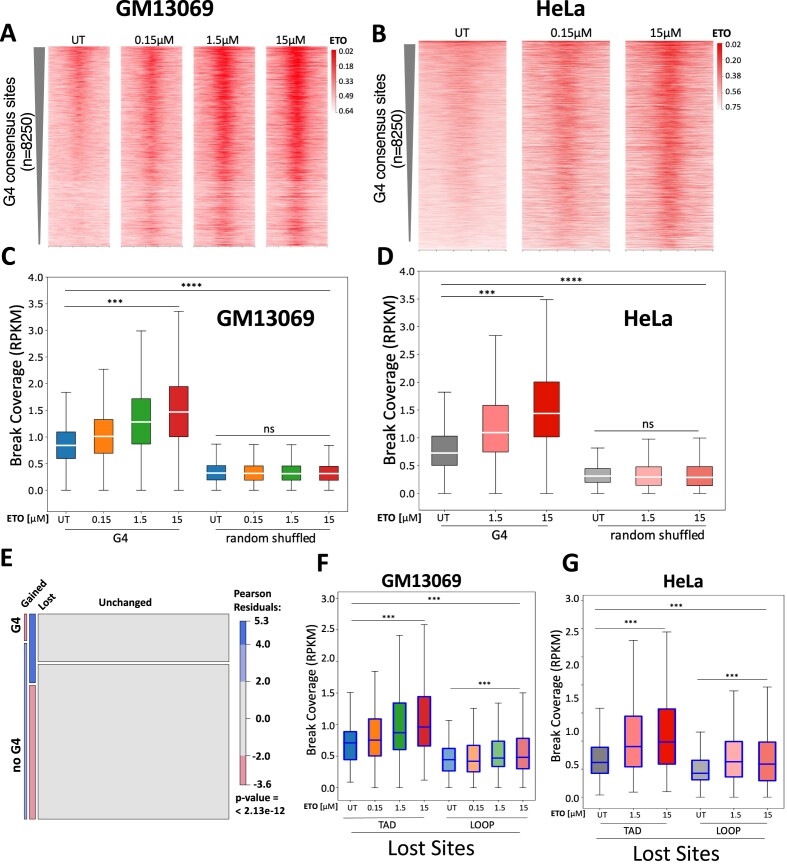
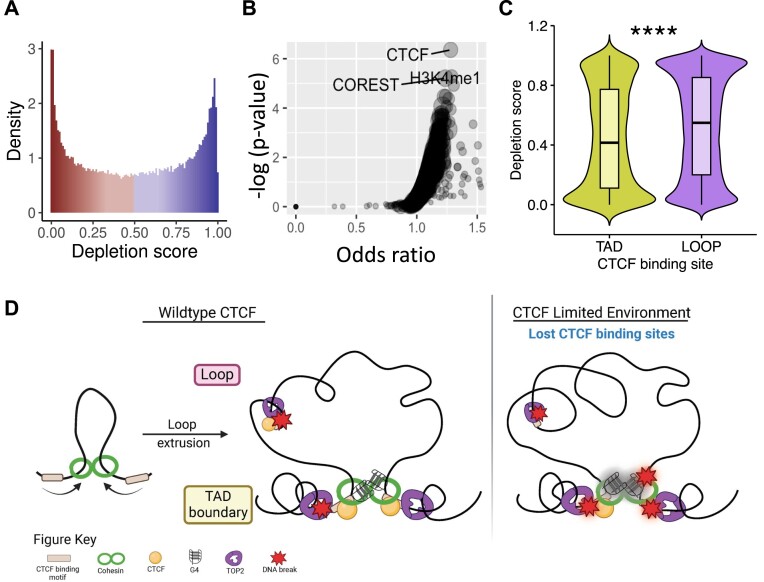
CCCTC-binding factor (CTCF) binding sites are hotspots of genome instability. Although many factors have been associated with CTCF binding site fragility, no study has integrated all fragility-related factors to understand the mechanism(s) of how they work together. Using an unbiased, genome-wide approach, we found that DNA double-strand breaks (DSBs) are enriched at strong, but not weak, CTCF binding sites in five human cell types. Energetically favorable alternative DNA secondary structures underlie strong CTCF binding sites. These structures coincided with the location of topoisomerase II (TOP2) cleavage complex, suggesting that DNA secondary structure acts as a recognition sequence for TOP2 binding and cleavage at CTCF binding sites. Furthermore, CTCF knockdown significantly increased DSBs at strong CTCF binding sites and at CTCF sites that are located at topologically associated domain (TAD) boundaries. TAD boundary-associated CTCF sites that lost CTCF upon knockdown displayed increased DSBs when compared to the gained sites, and those lost sites are overrepresented with G-quadruplexes, suggesting that the structures act as boundary insulators in the absence of CTCF, and contribute to increased DSBs. These results model how alternative DNA secondary structures facilitate recruitment of TOP2 to CTCF binding sites, providing mechanistic insight into DNA fragility at CTCF binding sites.


Figures

Graphical Abstract
Graphical Abstract
Figure 1.
Figure 1.
DSBs and highly stable alternative DNA secondary structures are significantly enriched at strong CTCF binding sites in multiple cell types. (A) DSBs were mapped in three untreated nonmalignant (MCF10A, GM13039 and NPC) and two untreated cancer cell lines (HeLa and Jurkat). CTCF binding strength was defined based on ChIP-seq signal for each cell line, and binding sites with CTCF motifs were identified and used here. DSBs are enriched at the top 10% strongest CTCF binding sites (strong, red), but not at the 10% weakest CTCF binding sites (weak, blue) in untreated GM13069 (n = 3529), HeLa (n = 5386), MCF10A (n = 4878), NPC (n = 6912) and Jurkat (n = 5593) cells, as demonstrated by cumulative DSB coverage (RPM) (±500 nt) at these sites. (B) DNA sequences around strong CTCF binding sites (red) (±150 nt) form more energetically favorable DNA secondary structures (ΔG, kcal/mol) than sequences around weak sites (blue), as determined by folding predictions of single-stranded DNA using ViennaRNA with DNA thermodynamic parameters and a 30-nt sliding window with a 1-nt step; a low ΔG (kcal/mol) indicates that sequences are more favorable to form the structure. (C) Read-normalized DSB coverage (RPM) was significantly greater at the strong (red) versus the weak (blue) CTCF binding peak sites (±150 nt) for each cell line. (D) Relative folding free energy was significantly more stable at the strong (red) versus the weak (blue) CTCF binding peaks (±150 nt) for each cell line. Boxes denote 25th and 75th percentiles, middle lines show medians and whiskers span from 5% to 95%; ****P ∼ 0, two-sample, Kolmogorov–Smirnov test.
Figure 2.
Figure 2.
TOP2 preferentially binds and cleaves DNA at strong CTCF binding sites. (A) Cumulative DSBs from MCF10A (RPM), average TOP2B binding from MCF10A (RPM) and relative free energy of alternative DNA secondary structure formation (kcal/mol) were assessed at the strong CTCF binding sites in MCF10A (n = 6011) showing an overlap of TOP2B binding, DSB accumulation and energetically favorable structures at these CTCF binding sites. (B) Cumulative DSBs from MCF10A (RPM), average TOP2B binding from MCF10A (RPM) and relative free energy of alternative DNA secondary structure formation (kcal/mol) were assessed at the weak CTCF binding sites in MCF10A (n = 6011) showing a low degree of overlap between TOP2B binding secondary structure formation at these CTCF binding sites and low DSB accumulation. (C) Cumulative TOP2cc coverage (RPM) was calculated at single-nucleotide positions of the top 10% strong CTCF binding sites (n = 1973; ±500 nt) for asynchronous WT (blue), asynchronous TOP2B knockout (green), G1 WT (orange) and G1 TOP2B knockout (red) RPE-1 cells. (D) Quantification of TOP2cc coverage at strong CTCF binding sites (n = 1973; ±150 nt) demonstrates that TOP2B knockout, in asynchronous and G1 cells, significantly reduced TOP2cc accumulation. (E) Cumulative TOP2cc coverage (RPM) was calculated at single-nucleotide positions of the weak (bottom 10%) CTCF binding sites (n = 1973; ±500 nt) for asynchronous WT (blue), asynchronous TOP2B knockout (green), G1 WT (orange) and G1 TOP2B knockout (red) RPE-1 cells. (F) Quantification of TOP2cc coverage at weak CTCF binding sites (n = 1973; ±150 nt). Boxes denote 25th and 75th percentiles, middle lines show medians and whiskers span from 5% to 95%; ***P< 0.001 and ****P ∼ 0, Wilcoxon rank sum test.
Figure 3.
Figure 3.
CTCF knockdown significantly increases DSB enrichment at the strong CTCF binding sites in MCF10A cells. (A) CTCF is knocked down in shCTCF MCF10A cells compared to shLuc (top, CTCF; bottom, β-actin loading control). (B) Knockdown of CTCF in MCF10A cells is significantly reduced by 60%, normalized to β-actin (**P< 0.01, Student’s t-test). (C) Knockdown of CTCF in MCF10A cells does not alter cell proliferation as measured by the MTS assay. (D) CTCF knockdown increased DSBs at strong CTCF binding sites (left, n = 6011) but not at weak CTCF binding sites (right, n = 6011), as demonstrated by cumulative read-normalized coverage (RPM) of DSBs mapped in MCF10A shLuc (blue) and shCTCF (orange) cells. (E) Quantification of DSB coverage at the 3862 CTCF binding sites (±150 nt) after eliminating sites at which both samples had zero DSB coverage among the 6011 strong CTCF binding sites. Bars indicate means and error bars show ±standard deviation. Boxes denote 25th and 75th percentiles, middle lines show medians and whiskers span from 5% to 95%; *P< 0.05 and ***P< 0.001, Wilcoxon rank sum test.
Figure 4.
Figure 4.
CTCF knockdown altered binding at CTCF binding sites and differential DSBs and DNA secondary structure folding potentials at gained, lost and unchanged CTCF binding sites in MCF10A cells. (A) Heatmaps show CTCF binding at significantly gained (n = 504), lost (n = 3270) and unchanged (n = 35 101) CTCF binding sites between WT and CTCF knockdown MCF10A cells. Binding peaks with CTCF motifs only were used for the analysis, and differentially binding sites were calculated and identified using DiffBind 3.0 (55). Heatmaps were generated using deepTools (61) at the summit ± 1.5 kb regions of the differential peaks identified by DiffBind. (B) Scatter plot of each CTCF binding site based on relative binding strength rank in WT and CTCF knockdown conditions (gained, red; lost, blue; unchanged, gray). (C) DSBs were mapped in shLuc and shCTCF MCF10A lines. DSBs are significantly increased at gained and lost CTCF binding sites following CTCF knockdown (reads per kilobase million, RPKM). (D) DNA sequences around lost (blue) CTCF binding sites form more energetically favorable alternative DNA secondary structures than unchanged (gray) or gained (red) CTCF binding sites. Boxes denote 25th and 75th percentiles, middle lines show medians and whiskers span from 5% to 95%; **P < 0.01, ***P< 0.001 and ****P ∼ 0; pairwise comparisons, Wilcoxon rank sum test; cross-group comparisons, Kolmogorov–Smirnov test.
Figure 5.
Figure 5.
TAD boundary-associated CTCF binding sites are enriched for DSBs and increase fragility upon CTCF knockdown. (A) Venn diagram shows the division of gained, lost and unchanged CTCF binding sites (CBSs) among constitutive CTCF binding sites (n = 22 097). (B) Mosaic plot shows the underrepresentation of lost CTCF binding sites for TAD boundaries and being overrepresented in loop-associated sites. Meanwhile, unchanged CTCF binding sites are overrepresented among TAD boundaries and underrepresented among loop-associated sites (P = 2.22 × 10−16, chi-square test). (C) DNA sequences around lost TAD boundary-associated CTCF binding sites (solid blue) form the most energetically stable alternative DNA secondary structures among altered CTCF binding sites (±150 bp). **P < 0.01, Kruskal–Wallis, post-hoc Dunn test. (D) DSBs are enriched at all TAD boundary-associated CTCF binding sites and significantly increased upon CTCF knockdown. Loop-associated CTCF binding sites show changes in DSBs in the same direction as binding changes (RPKM). (E) A representative view of a lost TAD boundary-associated CTCF binding site and a lost loop-associated CTCF binding site near the gene SOS1 demonstrates the selective increase in DSBs at lost sites associated with TADs. CTCF ChIP-seq from CTCF WT and knockdown cells (dark blue and maroon, respectively), DSBs from CTCF shRNA control WT and CTCF knockdown (blue and orange, respectively), along with the CTCF classifications (gained; lost; unchanged), TAD CTCF binding sites (yellow), consensus G4 sites (green) and TOP2B binding (red). Boxes denote 25th and 75th percentiles, middle lines show medians and whiskers span from 5% to 95%; **P < 0.01, ***P< 0.001, ****P ∼ 0, and ns, not significant; pairwise comparisons, Wilcoxon rank sum test; cross-group comparisons, Kruskal–Wallis with post-hoc Dunn test.
Figure 6.
Figure 6.
TOP2-mediated DSBs preferentially present at G4 structure regions and at the lost TAD boundary-associated CTCF binding sites. Etoposide (ETO) treatment significantly increases DSB enrichment at G4 consensus regions in GM13069 (A) and HeLa cells (B). Boxplot illustration of DSB coverage at the consensus G4 regions in GM13069 (C) and HeLa cells (D). (E) Mosaic plot shows lost CTCF binding sites at TAD boundaries are overrepresented among shared G4 CTCF binding sites, while gained CTCF binding sites are underrepresented among G4 CTCF binding sites (P = 2.13 × 10−12, chi-square test). The lost CTCF binding sites at TAD boundaries, when compared to those at loops, are significantly more enriched with etoposide-induced DSBs in GM13069 (F) and HeLa cells (G), and maintain the strong DSB increase corresponding to the increased concentrations of etoposide. Boxes denote 25th and 75th percentiles, middle lines show medians and whiskers span from 5% to 95%; ***P < 0.001, ****P ∼ 0, and ns, not significant, Kruskal–Wallis followed by post-hoc Dunn test.
Figure 7.
Figure 7.
G4s have functional and conserved roles at TAD boundary-associated CTCF binding sites. (A) The mutational constraint on the observed G4 structures varies throughout the genome, as shown by the distribution of the depletion scores (0, most depleted, to 1, least depleted). (B) The most constrained G4s are enriched for CTCF binding along with H3K4me1 and CoREST. (C) The G4 structures with at least one overlapping TAD boundary-associated CTCF binding site are more constrained compared to structures that overlap with loop-associated CTCF binding sites (****P < 2.2 × 10−16, Wilcoxon rank sum test). (D) Model of DNA fragility at CTCF binding sites driven by TAD and loop associations, TOP2B activity, G4s and CTCF binding.

Similar articles

Cited by

References

    1. Dillon L.W., Burrow A.A., Wang Y.H. DNA instability at chromosomal fragile sites in cancer. Curr. Genomics. 2010; 11:326–337. - PMC - PubMed
    1. O’Keefe L.V., Richards R.I. Common chromosomal fragile sites and cancer: focus on FRA16D. Cancer Lett. 2006; 232:37–47. - PubMed
    1. Burrow A.A., Williams L.E., Pierce L.C., Wang Y.H. Over half of breakpoints in gene pairs involved in cancer-specific recurrent translocations are mapped to human chromosomal fragile sites. BMC Genomics. 2009; 10:59. - PMC - PubMed
    1. Glover T.W., Wilson T.E., Arlt M.F. Fragile sites in cancer: more than meets the eye. Nat. Rev. Cancer. 2017; 17:489–501. - PMC - PubMed
    1. Ciullo M., Debily M.A., Rozier L., Autiero M., Billault A., Mayau V., El Marhomy S., Guardiola J., Bernheim A., Coullin P. et al. . Initiation of the breakage–fusion–bridge mechanism through common fragile site activation in human breast cancer cells: the model of PIP gene duplication from a break at FRA7I. Hum. Mol. Genet. 2002; 11:2887–2894. - PubMed

Publication types

MeSH terms