. 2024 Jun:47:100759.
doi: 10.1016/j.epidem.2024.100759. Epub 2024 Mar 2.

Projecting the future impact of emerging SARS-CoV-2 variants under uncertainty: Modeling the initial Omicron outbreak

Affiliations

Projecting the future impact of emerging SARS-CoV-2 variants under uncertainty: Modeling the initial Omicron outbreak

Sean Moore et al. Epidemics. 2024 Jun.

Abstract

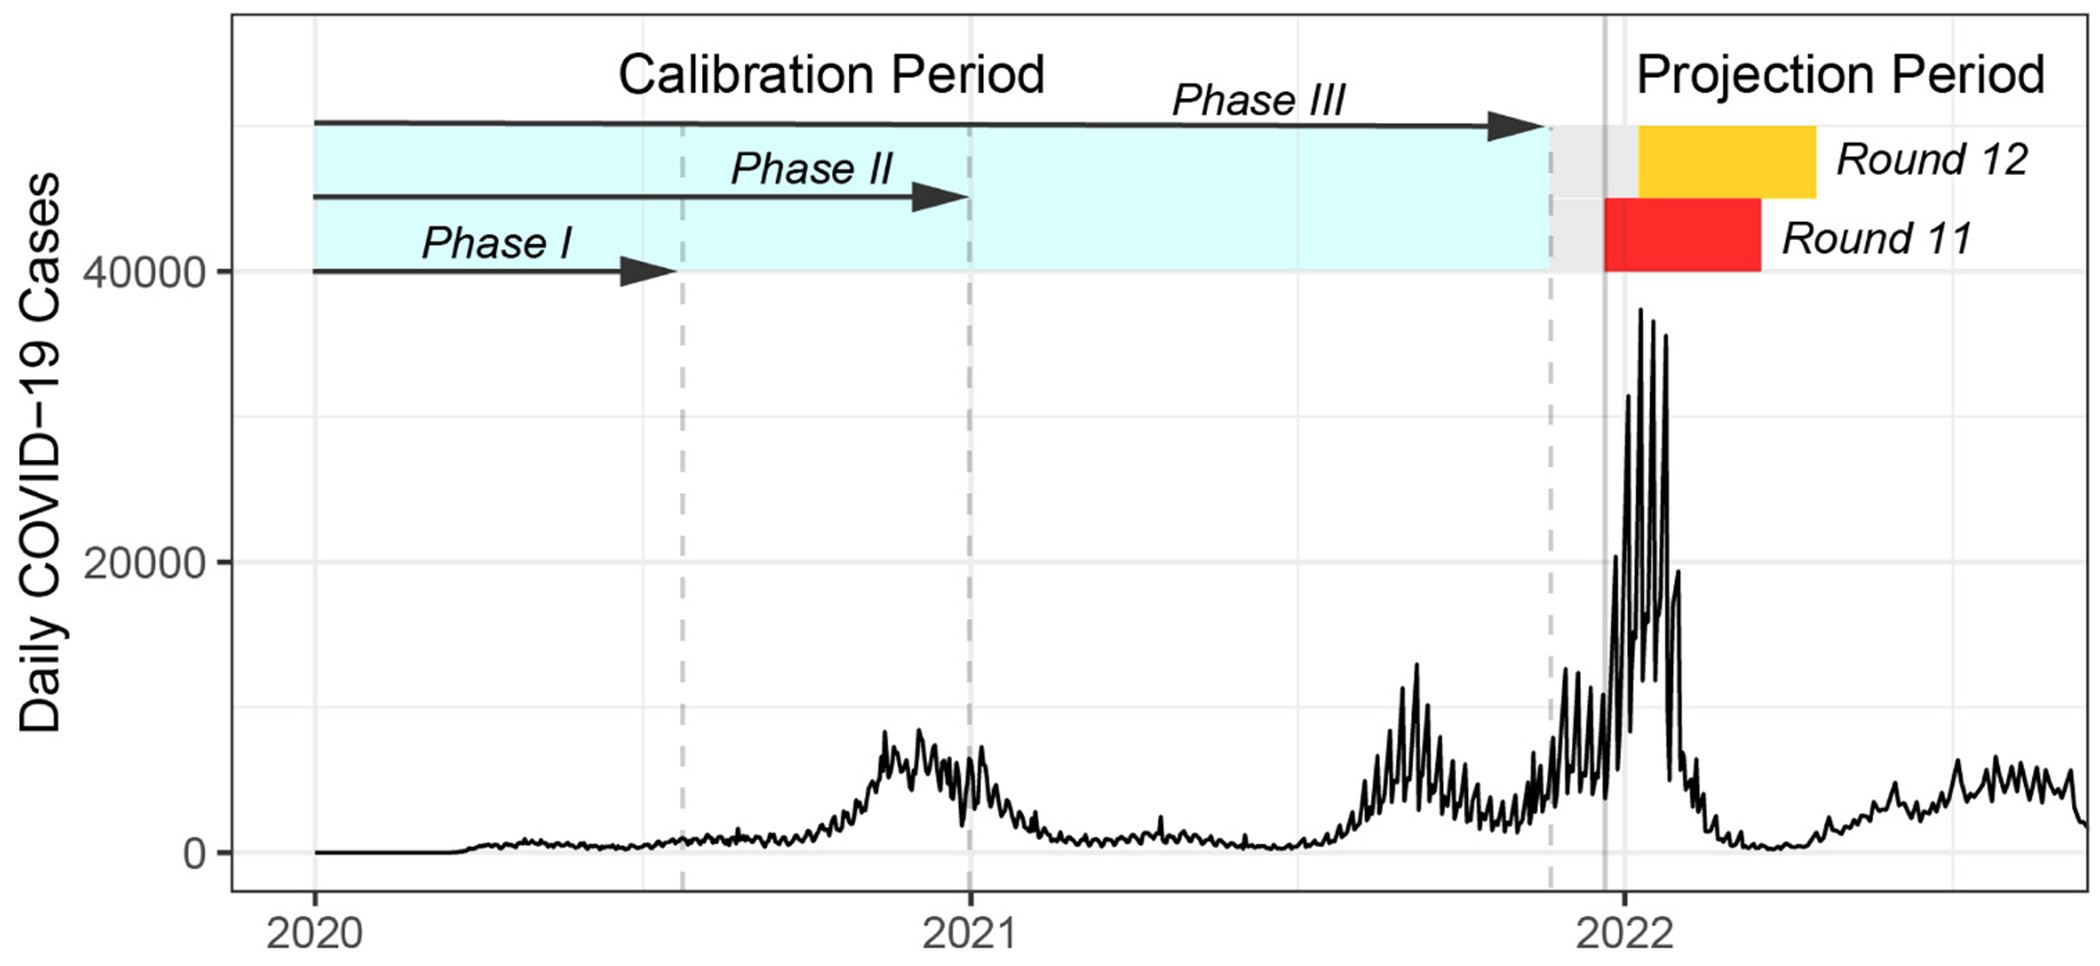
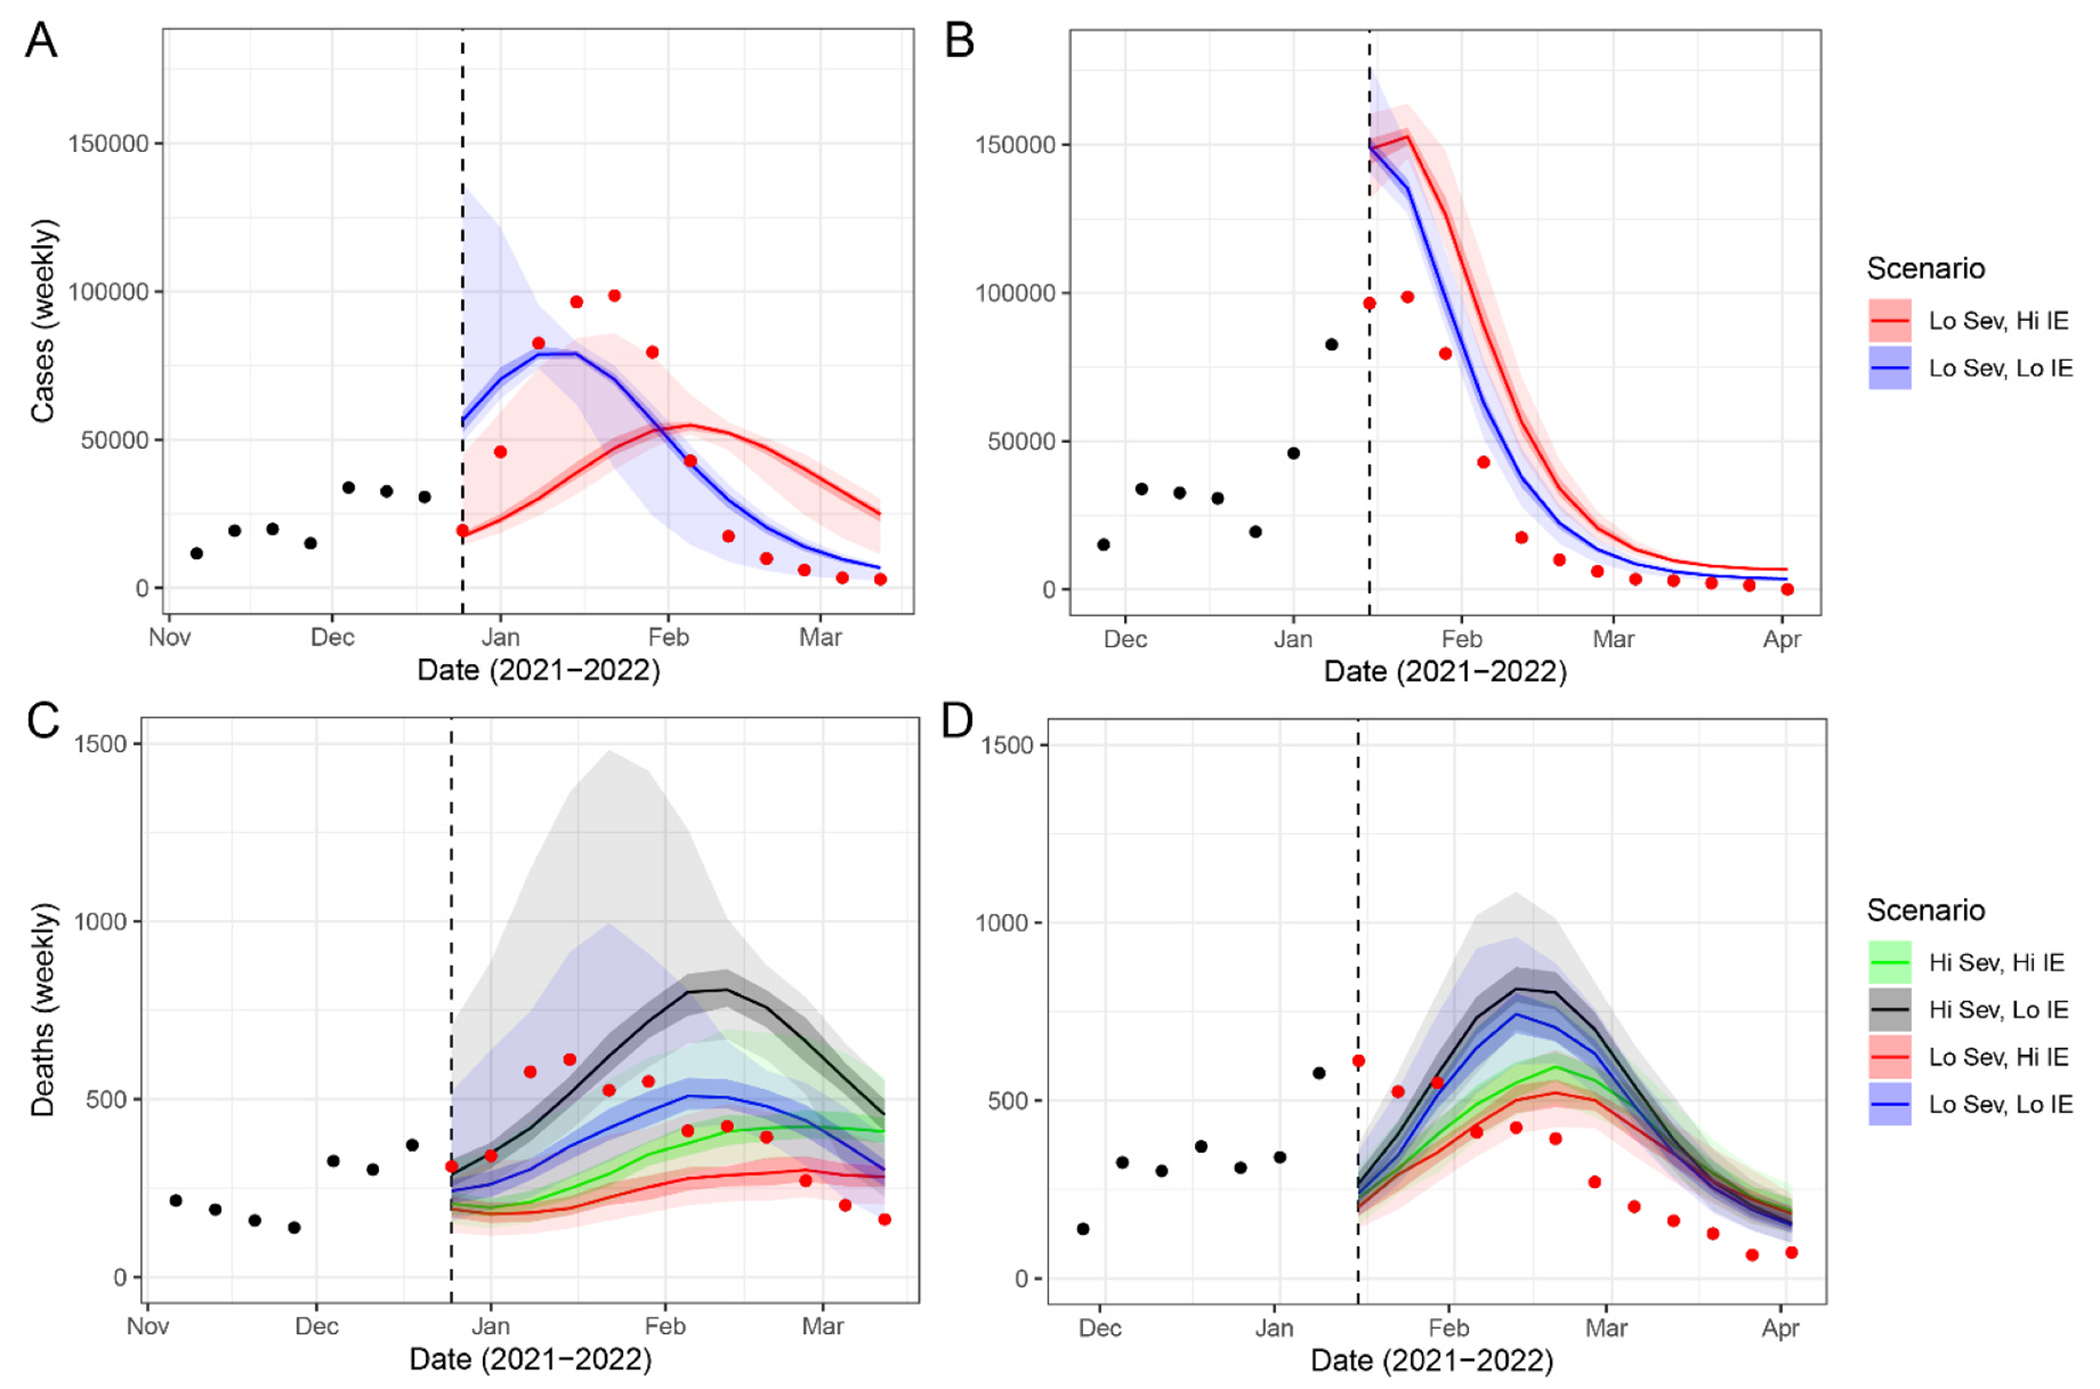
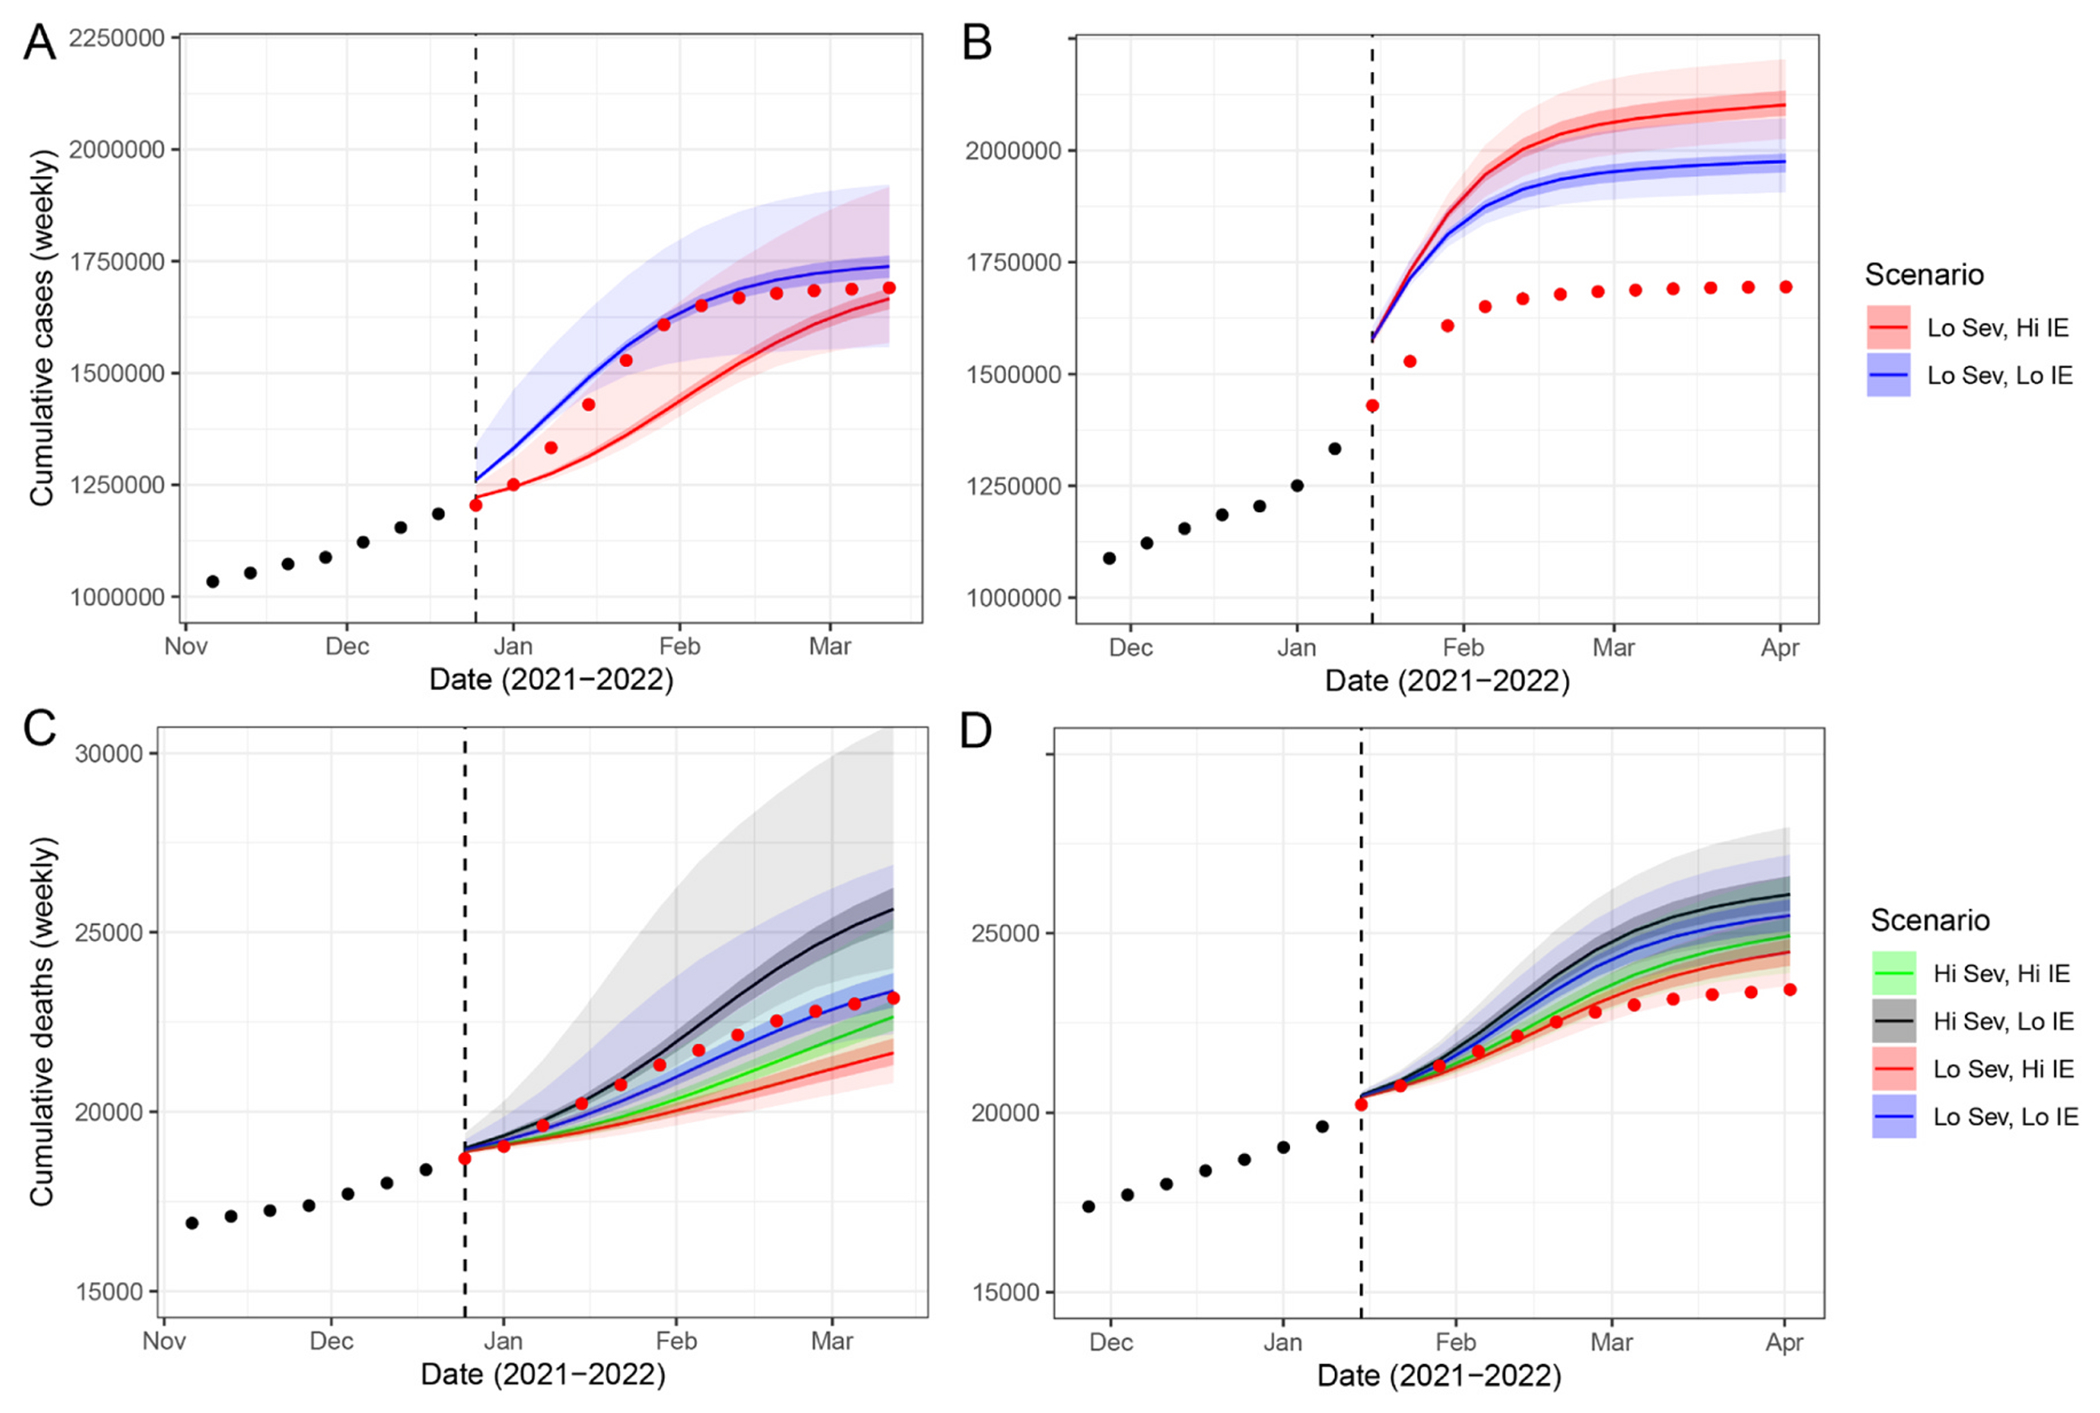
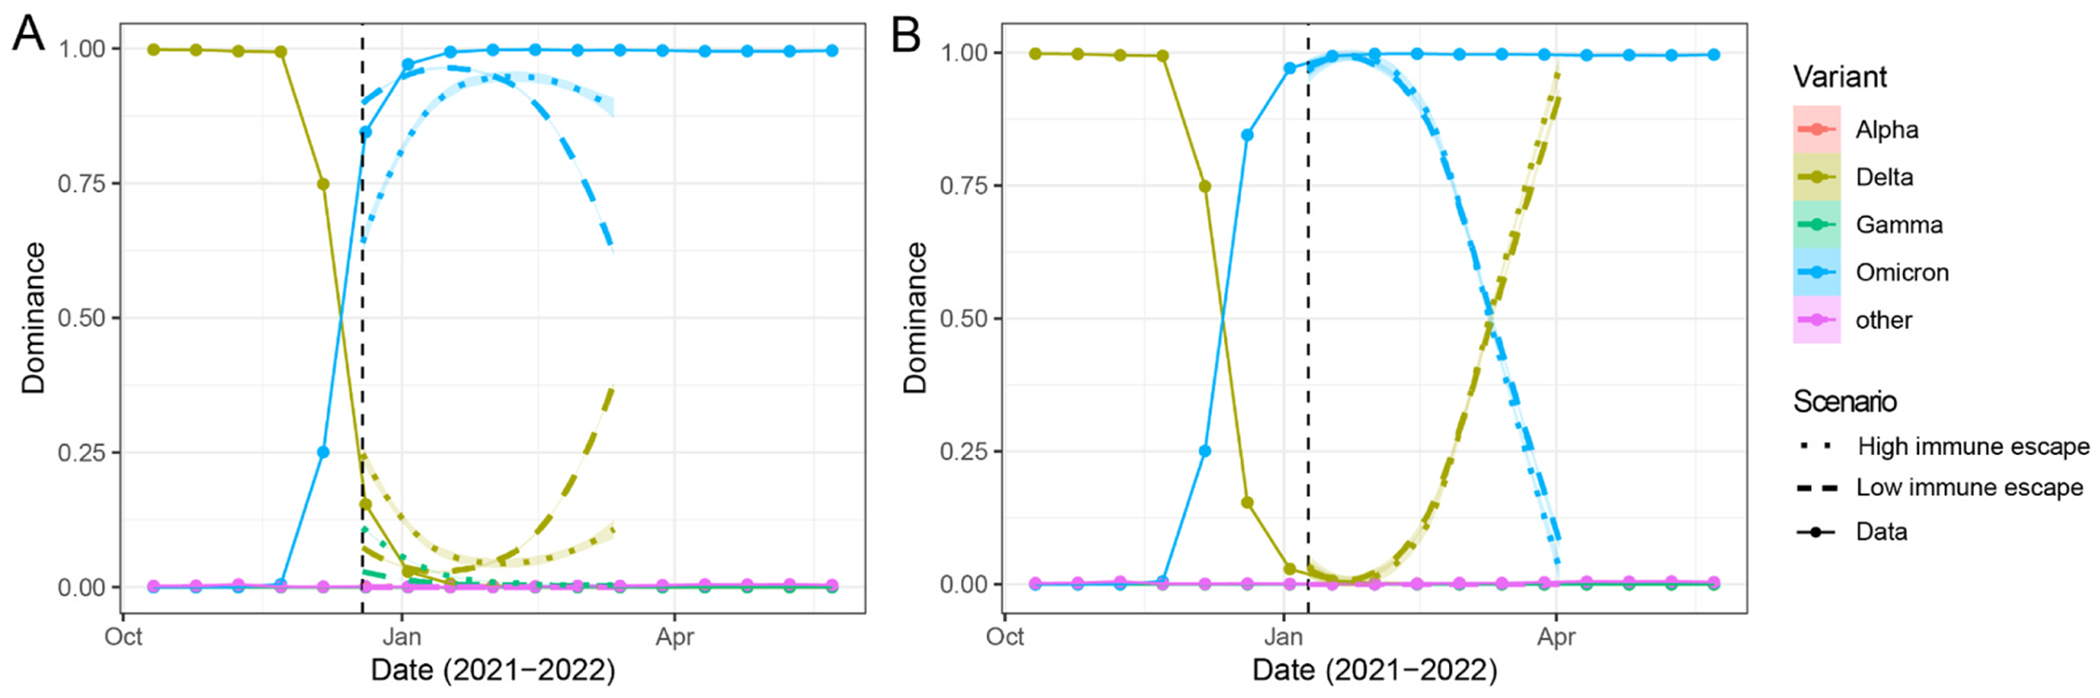
Over the past several years, the emergence of novel SARS-CoV-2 variants has led to multiple waves of increased COVID-19 incidence. When the Omicron variant emerged, there was considerable concern about its potential impact in the winter of 2021-2022 due to its increased fitness. However, there was also considerable uncertainty regarding its likely impact due to questions about its relative transmissibility, severity, and degree of immune escape. We sought to evaluate the ability of an agent-based model to forecast incidence in the context of this emerging pathogen variant. To project COVID-19 cases and deaths in Indiana, we calibrated our model to COVID-19 hospitalizations, deaths, and test-positivity rates through November 2021, and then projected COVID-19 incidence through April 2022 under four different scenarios that covered the plausible ranges of Omicron's severity, transmissibility, and degree of immune escape. Our initial projections from December 2021 through March 2022 indicated that under a pessimistic scenario with high disease severity, the peak in weekly COVID-19 deaths in Indiana would be larger than the previous peak in December 2020. However, retrospective analyses indicate that Omicron's severity was closer to the optimistic scenario, and even though cases and hospitalizations reached a new peak, fewer deaths occurred than during the previous peak. According to our results, Omicron's rapid spread was consistent with a combination of higher transmissibility and immune escape relative to earlier variants. Our updated projections starting in January 2022 accurately predicted that cases would peak in mid-January and decline rapidly over the next several months. The performance of our projections shows that following the emergence of a new pathogen variant, models can help quantify the potential range of outbreak magnitudes and trajectories. Agent-based models are particularly useful in these scenarios because they can efficiently track individual vaccination and infection histories with multiple variants with varying degrees of cross-protection.

Keywords: COVID-19; Forecasting; Omicron; SARS-CoV-2; Variant.


Conflict of interest statement

Declaration of Competing Interest Authors declare that they have no competing interests.

Figures

Fig. 1.
Fig. 1.
Timeline of model simulations, including the model calibration and projection periods. Daily reported COVID-19 cases in Indiana from 01/01/2020–08/01/2022. Blue color bars show the time periods for the three phases of the calibration process. The red bar represents the time period for the round 11 projections, and the yellow bar represents the time period for the round 12 projections. All model simulations used to generate the projections were run from 01/01/2020 through the end of the projection period using parameters estimates from the calibration process.
Fig. 2.
Fig. 2.
Observed and projected COVID-19 cases and deaths in Indiana during the initial Omicron wave in 2021–2022. Round 11 projected (A) cases and (C) deaths are on the left side for the four different scenarios. Round 12 projected (B) cases and (D) deaths are on the right side. In the legend, severity is abbreviated Sev, and immune escape is abbreviated IE. Note: only the high and low immune escape scenarios with high severity are displayed in panels A and C because disease severity did not affect the number of cases. Points represent observed cases or deaths, with black points representing observations prior to the projection period, and red points observations during the projection period. Projected cases and deaths are represented by the colored lines (median), with colored bands representing the interquartile range (dark bands) and the 95% prediction interval (lighter bands).
Fig. 3.
Fig. 3.
Cumulative observed and projected COVID-19 cases and deaths in Indiana during the initial Omicron wave in 2021–2022. Round 11 cumulative projected (A) cases and (C) deaths are on the left side for the four different scenarios. Round 12 cumulative projected (B) cases and (D) deaths are on the right side. In the legend, severity is abbreviated Sev, and immune escape is abbreviated IE. Note: only the high and low immune escape scenarios with high severity are displayed in panels A and C because disease severity did not affect the number of cases. Points represent observed cases or deaths, with black points representing observations prior to the projection period, and red points observations during the projection period. Projected cases and deaths are represented by the colored lines (median), with colored bands representing the interquartile range (dark bands) and the 95% prediction interval (lighter bands).
Fig. 4.
Fig. 4.
Relative dominance (as calculated by the fraction of samples) of the main variants of concern during the study period. (A) Observed and median projected variant dominance in round 11, (B) observed and projected variant dominance during round 12. Circles represent data obtained from covariants.org and dashed and dotted lines represent the low immune escape (high transmissibility) and high immune escape (lower transmissibility) model scenarios. The scenarios depicted here are for the low severity scenarios as severity did not significantly affect the relative dominance of Omicron.

Similar articles

References

    1. Almagor Jonatan, Picascia Stefano, 2020. Exploring the effectiveness of a COVID-19 contact tracing app using an agent-based model. Sci. Rep 10 (1), 22235. - PMC - PubMed
    1. Altarawneh Heba N., Chemaitelly Hiam, Hasan Mohammad R., Ayoub Houssein H., Qassim Suelen, AlMukdad Sawsan, Coyle Peter, et al., 2022. Protection against the Omicron Variant from Previous SARS-CoV-2 Infection. N. Engl. J. Med 386 (13), 1288–1290. - PMC - PubMed
    1. Bertozzi Andrea L., Franco Elisa, Mohler George, Short Martin B., Sledge Daniel, 2020. The challenges of modeling and forecasting the spread of COVID-19. Proc. Natl. Acad. Sci 117 (29), 16732–16738. - PMC - PubMed
    1. Biggerstaff Matthew, Slayton Rachel B., Johansson Michael A., Butler Jay C., 2022. Improving pandemic response: employing mathematical modeling to confront coronaviras disease 2019. Clin. Infect. Dis.: Off. Publ. Infect. Dis. Soc. Am 74 (5), 913–917. - PMC - PubMed
    1. Borchering Rebecca K., Viboud C.écile, Howerton Emily, Smith Claire P., Truelove Shaun, Runge Michael C., Reich Nicholas G., et al., 2021. Modeling of future COVID-19 Cases, hospitalizations, and deaths, by vaccination rates and nonpharmaceutical intervention scenarios - United States, April-September 2021. Mmwr. Morb. Mortal. Wkly. Rep 70 (19), 719–724. - PMC - PubMed

Supplementary concepts