. 2024 Apr 4;84(7):1365-1376.e7.
doi: 10.1016/j.molcel.2024.02.007. Epub 2024 Mar 6.

Dissection of a CTCF topological boundary uncovers principles of enhancer-oncogene regulation

Affiliations

Dissection of a CTCF topological boundary uncovers principles of enhancer-oncogene regulation

Kyung Lock Kim et al. Mol Cell. .

Abstract

Enhancer-gene communication is dependent on topologically associating domains (TADs) and boundaries enforced by the CCCTC-binding factor (CTCF) insulator, but the underlying structures and mechanisms remain controversial. Here, we investigate a boundary that typically insulates fibroblast growth factor (FGF) oncogenes but is disrupted by DNA hypermethylation in gastrointestinal stromal tumors (GISTs). The boundary contains an array of CTCF sites that enforce adjacent TADs, one containing FGF genes and the other containing ANO1 and its putative enhancers, which are specifically active in GIST and its likely cell of origin. We show that coordinate disruption of four CTCF motifs in the boundary fuses the adjacent TADs, allows the ANO1 enhancer to contact FGF3, and causes its robust induction. High-resolution micro-C maps reveal specific contact between transcription initiation sites in the ANO1 enhancer and FGF3 promoter that quantitatively scales with FGF3 induction such that modest changes in contact frequency result in strong changes in expression, consistent with a causal relationship.

Keywords: ANO1; CTCF insulator; DNA methylation; FGF3; FGF4; SDH deficiency; chromatin; enhancer regulation; gastrointestinal stromal tumor; genome topology.


Conflict of interest statement

Declaration of interests B.E.B. declares outside interests in Fulcrum Therapeutics, HiFiBio, Arsenal Biosciences, Chroma Medicine, Cell Signaling Technologies, and Design Pharmaceuticals. V.Y.G. and A.S.H. have filed a provisional patent on RCMC.

Figures

Figure 1.
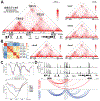
Figure 1.. FGF locus topology and regulatory landscape.
(A) RCMC heatmap depicts contact frequency between genomic positions across an 575 kb interval that includes genes encoding FGF ligands and the GIST biomarker ANO1. The region contains two large TADs (red triangles) flanked by boundaries (TB1-3) that are evident as dips in the insulation score metric. (B) CTCF (black) and H3K27ac (blue) profiles are shown for GIST-T1 cells and for clinical samples corresponding to different GIST subtypes (ChIP-seq data are RPM normalized). Multiple CTCF sites in the TB2 boundary (black dashed box) that separates the FGF genes from the H3K27ac-marked enhancers that encode eRNAs (blue dashed box). (C) Box plots depict eRNA and ANO1 expression (top, green), CTCF binding (top, gray), promoter acetylation (middle) and FGF expression (bottom) in the respective GIST subtypes (data from GSE107447). *p < 0.05, **p < 0.01, ***p < 0.001. (D) Schematic indicates correlations between eRNA expression, ANO1 expression, and averaged FGF3 and FGF4 expression across multiple GISTs (13 SDH-proficient, 6 SDH-deficient). The strong correlation between eRNA-1 and the FGF genes in SDH-deficient GISTs implicates the enhancer in the activation of these oncogenes. (E) UMAP visualization of single-cell RNA-seq data for gastrointestinal tissue highlights a cluster of Interstitial Cell of Cajal (ICC) that highly express ANO1 and eRNA-1. See also Figure S1.
Figure 2.
Figure 2.. Redundant CTCF sites in the TAD boundary mediate robust insulation.
(A) Schematic depicts combinatorial disruption of CTCF sites in the TAD boundary (TB2) region by CRISPR/Cas9 editing. Table lists engineered GIST-T1 derivatives in which different combinations of CTCF sites are disrupted (targeted sites indicated by ‘×’) and the non-targeting control (NT). (B) Relative FGF3 mRNA expression (qRT-PCR) in the derivative lines. Two biologically independent replicates (p-values (one-way ANOVA) < 0.001 for ΔInsD/E/F/G/H relative to control). (C) Scatter plot depicts log2 normalized RNA-seq expression versus log2 fold change in ΔInsE compared to NT control. It reveals specific upregulation of FGF3 in the insulator-disrupted derivative. (D) Barplots show FGF3, eRNA-1 and ANO1 RNA-seq expression in NT and InsKO lines. Data represent two independent biological replicates (one-way ANOVA for ΔInsD/E/F/G/H relative to control: *p < 0.05, **p < 0.01, ***p < 0.001). (E) CTCF (black), H3K27ac (blue), and H3K27me3 (magenta) profiles are shown for NT and InsKO lines over the genomic interval containing the FGF genes and eRNAs. Triangles indicate the CTCF motif orientation (red:sense; blue:antisense). (F) Correlation of FGF3 expression (RNA-seq) and H3K27ac at the FGF3 promoter. RNA expressions in C,D,F panels are TPM normalized. Error bars in B,D panels represent standard deviations. See also Figure S2.
Figure 3.
Figure 3.. High-resolution contact maps reveal complex topological changes associated with combinatorial CTCF disruptions.
(A) RCMC contact maps shown for the FGF locus in control GIST-T1 (NT; as in Figure 1A) and derivatives (InsKO). Loop domain contacts between the boundaries flanking the two main TADs are indicated by dashed boxes. (B) Heatmap depicts Pearson correlations between replicate RCMC profiles for the control and derivative lines. (C) Insulation scores are plotted for the control and derivative lines across a portion of the FGF locus including the TB2 boundary (gray bar), which is expanded below. (D) CTCF profiles are shown for the FGF locus in control GIST-T1 and the ΔInsE derivative. Arc plots show differential contacts (p < 0.05) between pairs of CTCF sites that are increased (red) or decreased (blue) in the ΔInsE derivative. See also Figure S3.
Figure 4.
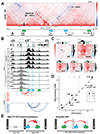
Figure 4.. Enhancer-promoter contact frequency scales linearly with FGF3 transcriptional activation.
(A) Heatmap depicts differential RCMC contact frequency between ΔInsE and control GIST-T1 cells. Dashed circles indicate interactions between the eRNA-1 transcriptional start site and the FGF3 promoter (left) or the ANO1 promoter (right). Gene tracks, promoter and enhancer regions, and CTCF (triangles) are indicated below. Anchors indicate the transcription start sites of FGF3 and eRNA-1. Upon boundary disruption, eRNA-1 gains interaction with FGF3 (red heat in E1-FGF3 dashed circle), but loses interaction with sites across the ANO1 TAD (blue stripe extending to the E1-ANO1 dashed circle). (B) Virtual 4C tracks (inferred from RCMC) depict contact frequency between eRNA-1 (top, black) or the FGF3 promoter (bottom, gray) and all genomic positions across the FGF locus in control GIST-T1 (NT) and InsKO lines. Arc plots below show differential contacts (p < 0.05) between H3K27ac sites that are increased (red) or decreased (blue) in the ΔInsE derivative. (C) Heatmaps depict RCMC contact frequency between 10 kb windows centered over the transcription start sites of FGF3 and eRNA-1 in control GIST-T1 and the respective derivatives. Horizontal and vertical tracks flanking the heatmaps depict H3K27ac signal over the FGF3 promoter and eRNA-1, respectively. (D) FGF3 expression (RNA-seq) is plotted against contact frequency between the transcription start sites of FGF3 and eRNA-1 for control GIST-T1 and derivative lines. Contract frequencies and correlations were computed for different window sizes (symbols and lines). Transcription scales linearly with enhancer-promoter contact when calculated between start sites at 1 kb resolution. (E) Schematic summarizes the impact of TB2 disruption on TAD organization and re-targeting or ‘hijacking’ of the key enhancer to activate FGF oncogenes. See also Figure S4.

References

    1. Furlong EEM, and Levine M (2018). Developmental enhancers and chromosome topology. Science 361, 1341–1345. 10.1126/science.aau0320. - DOI - PMC - PubMed
    1. Cramer P. (2019). Organization and regulation of gene transcription. Nature 573, 45–54. 10.1038/s41586-019-1517-4. - DOI - PubMed
    1. Heinz S, Romanoski CE, Benner C, and Glass CK (2015). The selection and function of cell type-specific enhancers. Nat. Rev. Mol. Cell Biol 16, 144–154. 10.1038/nrm3949. - DOI - PMC - PubMed
    1. Rozowsky J, Gao J, Borsari B, Yang YT, Galeev T, Gürsoy G, Epstein CB, Xiong K, Xu J, Li T, et al. (2023). The EN-TEx resource of multi-tissue personal epigenomes & variant-impact models. Cell 186, 1493–1511.e40. 10.1016/j.cell.2023.02.018. - DOI - PMC - PubMed
    1. Schoenfelder S, and Fraser P (2019). Long-range enhancer-promoter contacts in gene expression control. Nat. Rev. Genet 20, 437–455. 10.1038/s41576-019-0128-0. - DOI - PubMed

LinkOut - more resources