

A multi-ancestry genome-wide association study in type 1 diabetes
- PMID: 38453145
- PMCID: PMC11102596
- DOI: 10.1093/hmg/ddae024
A multi-ancestry genome-wide association study in type 1 diabetes
Abstract
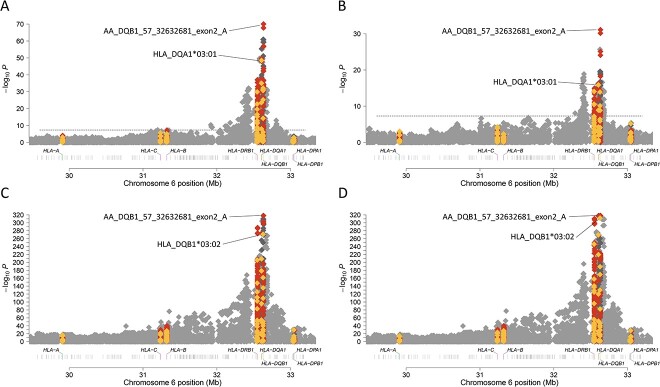
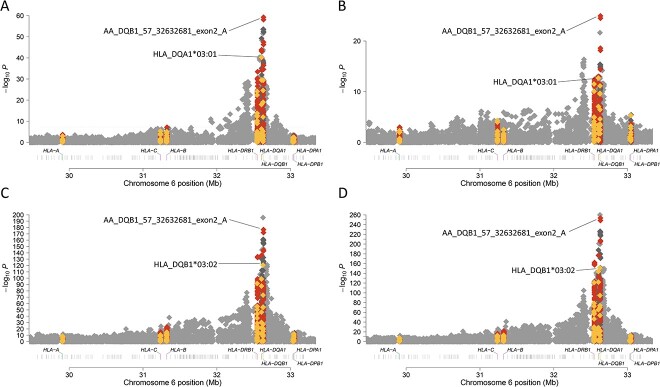
Type 1 diabetes (T1D) is an autoimmune disease caused by destruction of the pancreatic β-cells. Genome-wide association (GWAS) and fine mapping studies have been conducted mainly in European ancestry (EUR) populations. We performed a multi-ancestry GWAS to identify SNPs and HLA alleles associated with T1D risk and age at onset. EUR families (N = 3223), and unrelated individuals of African (AFR, N = 891) and admixed (Hispanic/Latino) ancestry (AMR, N = 308) were genotyped using the Illumina HumanCoreExome BeadArray, with imputation to the TOPMed reference panel. The Multi-Ethnic HLA reference panel was utilized to impute HLA alleles and amino acid residues. Logistic mixed models (T1D risk) and frailty models (age at onset) were used for analysis. In GWAS meta-analysis, seven loci were associated with T1D risk at genome-wide significance: PTPN22, HLA-DQA1, IL2RA, RNLS, INS, IKZF4-RPS26-ERBB3, and SH2B3, with four associated with T1D age at onset (PTPN22, HLA-DQB1, INS, and ERBB3). AFR and AMR meta-analysis revealed NRP1 as associated with T1D risk and age at onset, although NRP1 variants were not associated in EUR ancestry. In contrast, the PTPN22 variant was significantly associated with risk only in EUR ancestry. HLA alleles and haplotypes most significantly associated with T1D risk in AFR and AMR ancestry differed from that seen in EUR ancestry; in addition, the HLA-DRB1*08:02-DQA1*04:01-DQB1*04:02 haplotype was 'protective' in AMR while HLA-DRB1*08:01-DQA1*04:01-DQB1*04:02 haplotype was 'risk' in EUR ancestry, differing only at HLA-DRB1*08. These results suggest that much larger sample sizes in non-EUR populations are required to capture novel loci associated with T1D risk.
Keywords: HLA; genome-wide association study; human genetics; type 1 diabetes.
© The Author(s) 2024. Published by Oxford University Press.
Figures
Similar articles
-
Association between HLA alleles and haplotypes with age at diagnosis of type 1 diabetes in an admixed Brazilian population: A nationwide study.HLA. 2024 Jul;104(1):e15574. doi: 10.1111/tan.15574. HLA. 2024. PMID: 38993161
-
Type 1 Diabetes Risk in African-Ancestry Participants and Utility of an Ancestry-Specific Genetic Risk Score.Diabetes Care. 2019 Mar;42(3):406-415. doi: 10.2337/dc18-1727. Epub 2019 Jan 18. Diabetes Care. 2019. PMID: 30659077 Free PMC article.
-
HLA-DRB, -DQA, and DQB alleles and haplotypes in Iranian patients with diabetes mellitus type I.Pediatr Diabetes. 2013 Aug;14(5):366-71. doi: 10.1111/j.1399-5448.2012.00869.x. Epub 2012 May 14. Pediatr Diabetes. 2013. PMID: 22583516
-
The association of human leukocyte antigen class II (HLA II) haplotypes with the risk of Latent autoimmune diabetes of adults (LADA): Evidence based on available data.Gene. 2021 Jan 30;767:145177. doi: 10.1016/j.gene.2020.145177. Epub 2020 Sep 28. Gene. 2021. PMID: 32998048 Review.
-
Association of HLA-DRB1 and -DQB1 alleles with type 1 (autoimmune) diabetes in African Arabs: systematic review and meta-analysis.Immunol Invest. 2019 Feb;48(2):130-146. doi: 10.1080/08820139.2018.1493498. Epub 2018 Jul 13. Immunol Invest. 2019. PMID: 30004835
Cited by
-
Fifty years of HLA-associated type 1 diabetes risk: history, current knowledge, and future directions.Front Immunol. 2024 Sep 12;15:1457213. doi: 10.3389/fimmu.2024.1457213. eCollection 2024. Front Immunol. 2024. PMID: 39328411 Free PMC article. Review.
-
Metabolome-wide Mendelian randomisation reveals causal links between circulating metabolites and type 1 diabetes.EBioMedicine. 2025 Jul;117:105807. doi: 10.1016/j.ebiom.2025.105807. Epub 2025 Jun 24. EBioMedicine. 2025. PMID: 40561777 Free PMC article.
-
Untangling the genetics of beta cell dysfunction and death in type 1 diabetes.Mol Metab. 2024 Aug;86:101973. doi: 10.1016/j.molmet.2024.101973. Epub 2024 Jun 22. Mol Metab. 2024. PMID: 38914291 Free PMC article. Review.
-
Type 1 Diabetes Genetic Risk Scores: History, Application and Future Directions.Curr Diab Rep. 2025 Feb 8;25(1):22. doi: 10.1007/s11892-025-01575-5. Curr Diab Rep. 2025. PMID: 39920466 Review.
-
Characteristics of autoantibody-positive individuals without high-risk HLA-DR4-DQ8 or HLA-DR3-DQ2 haplotypes.Diabetologia. 2025 Mar;68(3):588-601. doi: 10.1007/s00125-024-06338-7. Epub 2024 Dec 13. Diabetologia. 2025. PMID: 39670998 Free PMC article.
References
-
- Atkinson MA, Eisenbarth GS. Type 1 diabetes: new perspectives on disease pathogenesis and treatment. Lancet 2001;358:221–9. - PubMed
-
- Conrad N, Misra S, Verbakel JY. et al. . Incidence, prevalence, and co-occurrence of autoimmune disorders over time and by age, sex, and socioeconomic status: a population-based cohort study of 22 million individuals in the UK. Lancet 2023;401:1878–90. - PubMed
Publication types
MeSH terms
Substances
Grants and funding
LinkOut - more resources
Full Text Sources
Medical
Research Materials
Miscellaneous
