

State-level variation in distribution of oxycodone and opioid-related deaths from 2000 to 2021: an ecological study of ARCOS and CDC WONDER data in the USA
- PMID: 38453203
- PMCID: PMC10921485
- DOI: 10.1136/bmjopen-2023-073765
State-level variation in distribution of oxycodone and opioid-related deaths from 2000 to 2021: an ecological study of ARCOS and CDC WONDER data in the USA
Abstract
Objectives: This study aims to characterise oxycodone's distribution and opioid-related overdoses in the USA by state from 2000 to 2021.
Design: This is an observational study.
Setting: More than 80 000 Americans died of an opioid overdose in 2021 as the USA continues to struggle with an opioid crisis. Prescription opioids play a substantial role, introducing patients to opioids and providing a supply of drugs that can be redirected to those seeking to misuse them.
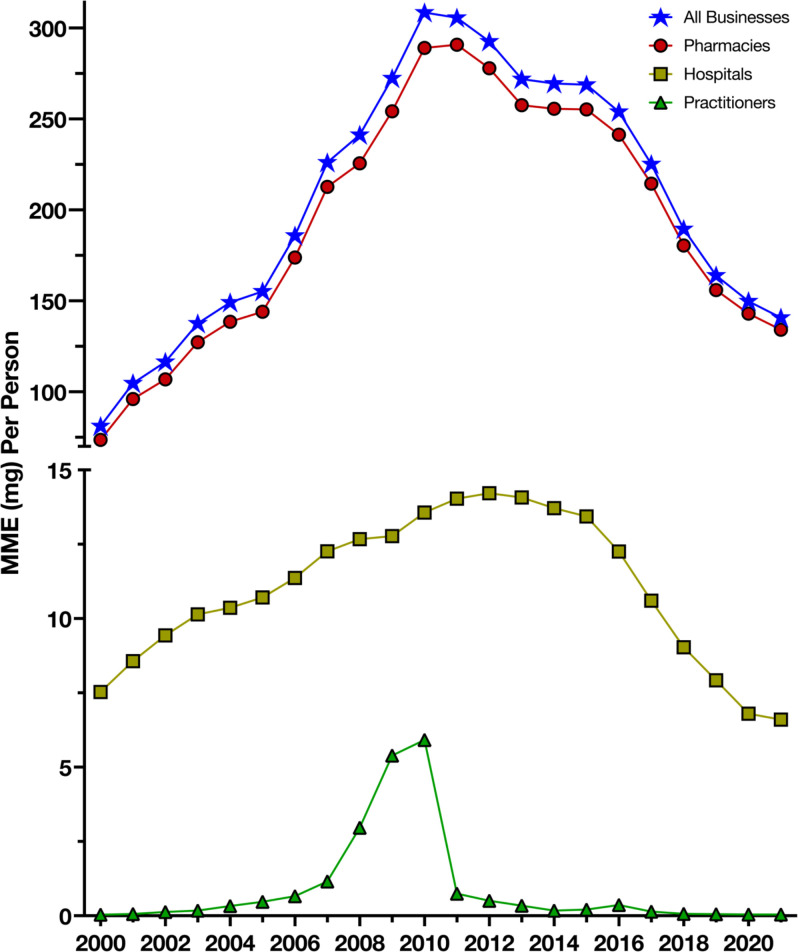
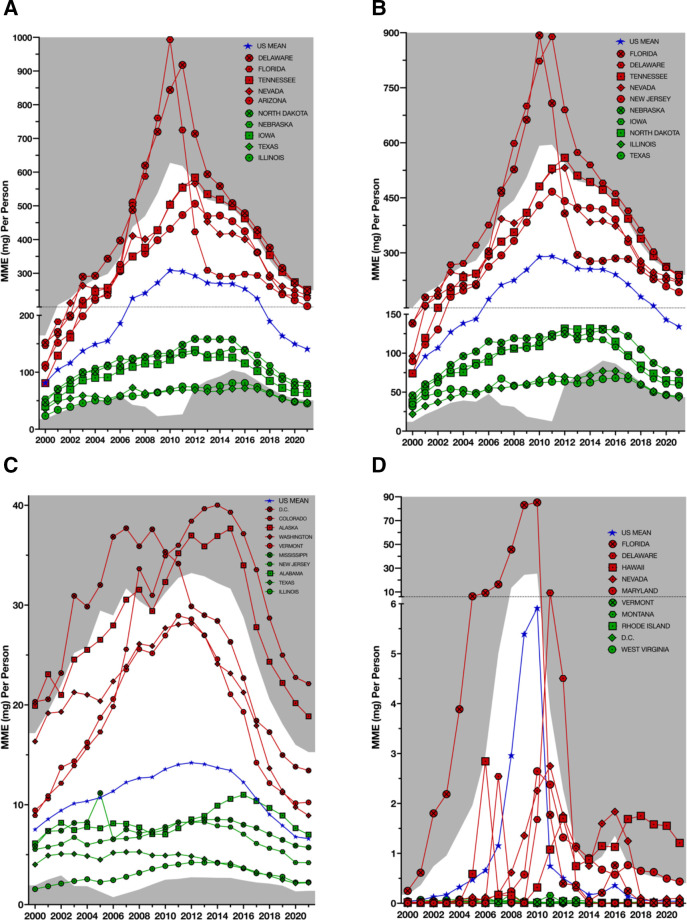
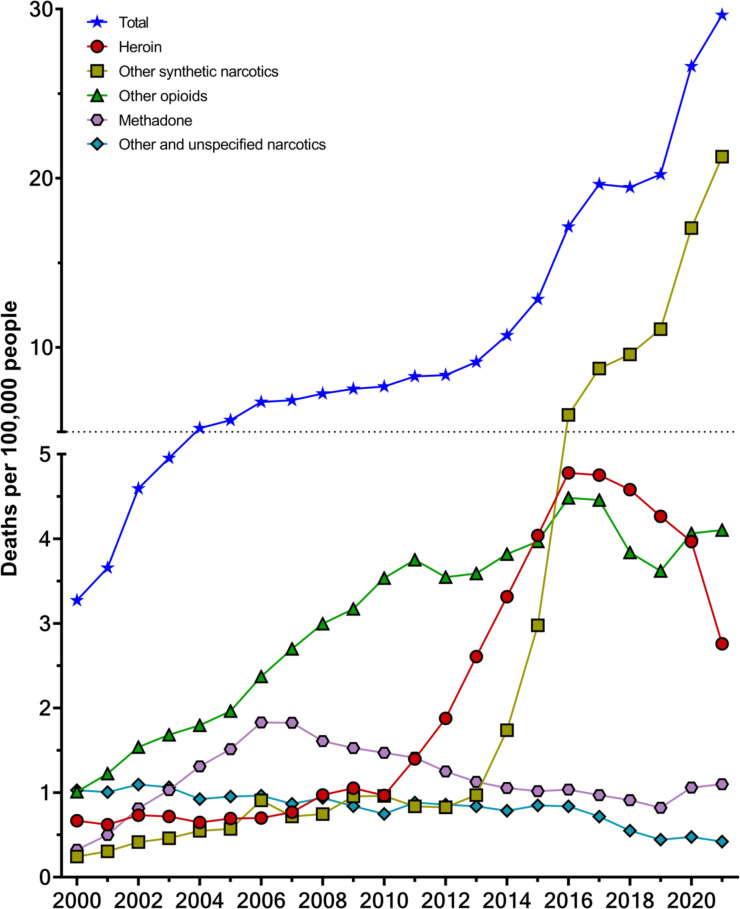
Methods: The Drug Enforcement Administration annual summary reports from the Automation of Reports and Consolidated Orders System provided weights of oxycodone distributed per state by business type (pharmacies, hospitals and practitioners). Weights were converted to morphine milligram equivalents (MME) per capita and normalised for population. The Centers for Disease Control and Prevention Wide-ranging ONline Data for Epidemiologic Research provided mortality data for heroin, other opioids, methadone, other synthetic narcotics and other/unspecified narcotics.
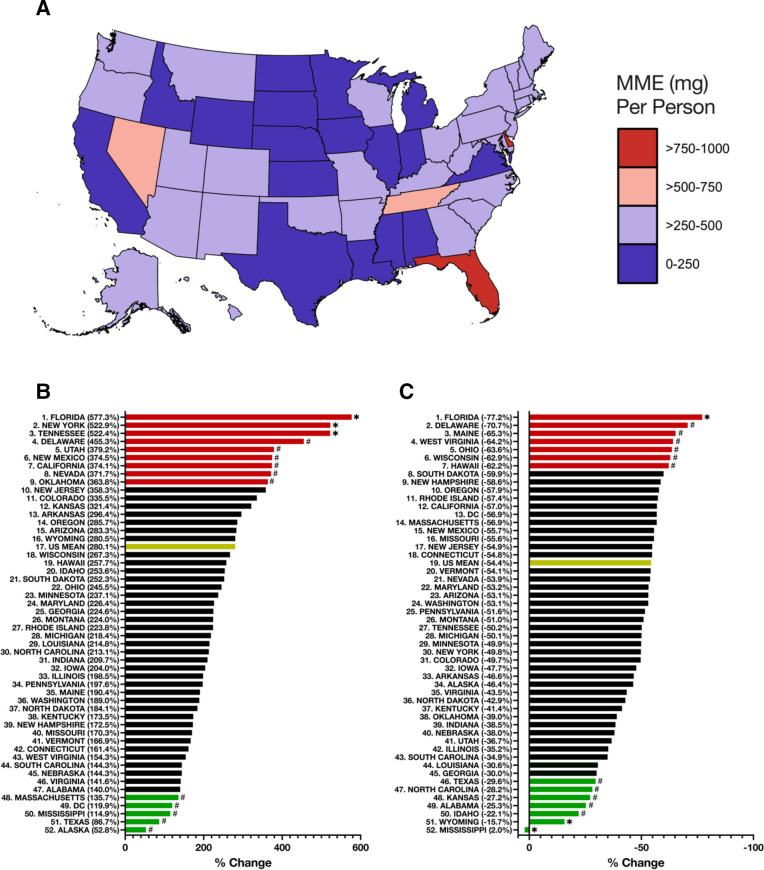
Results: There was a sharp 280.13% increase in total MME/person of oxycodone from 2000 to 2010, followed by a slower 54.34% decrease from 2010 to 2021. Florida (2007-2011), Delaware (2003-2020) and Tennessee (2012-2021) displayed consistent and substantial elevations in combined MME/person compared with other states. In the peak year (2010), there was a 15-fold difference between the highest and lowest states. MME/person from only pharmacies, which constituted >94% of the total, showed similar results. Hospitals in Alaska (2000-2001, 2008, 2010-2021), Colorado (2008-2021) and DC (2000-2011) distributed substantially more MME/person over many years compared with other states. Florida stood out in practitioner-distributed oxycodone, with an elevation of almost 15-fold the average state from 2006 to 2010. Opioid-related deaths increased +806% from 2000 to 2021, largely driven by heroin, other opioids and other synthetic narcotics.
Conclusions: Oxycodone distribution across the USA showed marked differences between states and business types over time. Investigation of opioid policies in states of interest may provide insight for future actions to mitigate opioid misuse.
Keywords: Chronic Pain; EPIDEMIOLOGIC STUDIES; EPIDEMIOLOGY; PALLIATIVE CARE; PUBLIC HEALTH.
© Author(s) (or their employer(s)) 2024. Re-use permitted under CC BY-NC. No commercial re-use. See rights and permissions. Published by BMJ.
Conflict of interest statement
Competing interests: BJP was (2019–2021) part of an osteoarthritis research team supported by Pfizer and Eli Lilly and is currently supported by HRSA (D34HP31025) and the Pennsylvania Academic Clinical Research Center. JG was (2019–2021) supported by Pfizer and Eli Lilly.
Figures
References
-
- Ahmad FB, Cisewski JA, Rossen LM, et al. Provisional drug overdose death counts. National Center for Health Statistics, 2022.
Publication types
MeSH terms
Substances
LinkOut - more resources
Full Text Sources
Medical
Miscellaneous