. 2024 Mar 22;38(3-4):131-150.
doi: 10.1101/gad.351238.123.

A maternal-effect Padi6 variant causes nuclear and cytoplasmic abnormalities in oocytes, as well as failure of epigenetic reprogramming and zygotic genome activation in embryos

Affiliations

A maternal-effect Padi6 variant causes nuclear and cytoplasmic abnormalities in oocytes, as well as failure of epigenetic reprogramming and zygotic genome activation in embryos

Carlo Giaccari et al. Genes Dev. .

Abstract

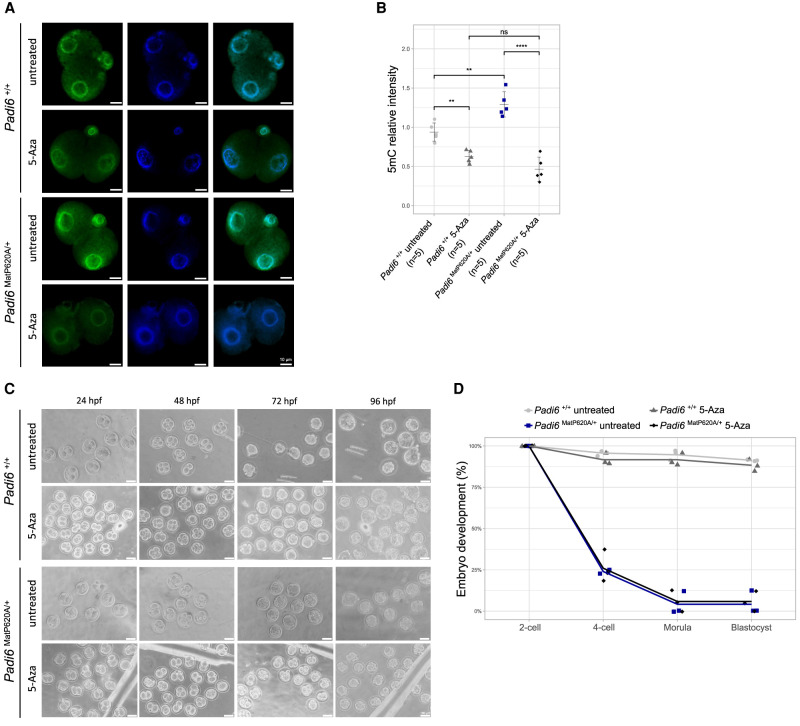
Maternal inactivation of genes encoding components of the subcortical maternal complex (SCMC) and its associated member, PADI6, generally results in early embryo lethality. In humans, SCMC gene variants were found in the healthy mothers of children affected by multilocus imprinting disturbances (MLID). However, how the SCMC controls the DNA methylation required to regulate imprinting remains poorly defined. We generated a mouse line carrying a Padi6 missense variant that was identified in a family with Beckwith-Wiedemann syndrome and MLID. If homozygous in female mice, this variant resulted in interruption of embryo development at the two-cell stage. Single-cell multiomic analyses demonstrated defective maturation of Padi6 mutant oocytes and incomplete DNA demethylation, down-regulation of zygotic genome activation (ZGA) genes, up-regulation of maternal decay genes, and developmental delay in two-cell embryos developing from Padi6 mutant oocytes but little effect on genomic imprinting. Western blotting and immunofluorescence analyses showed reduced levels of UHRF1 in oocytes and abnormal localization of DNMT1 and UHRF1 in both oocytes and zygotes. Treatment with 5-azacytidine reverted DNA hypermethylation but did not rescue the developmental arrest of mutant embryos. Taken together, this study demonstrates that PADI6 controls both nuclear and cytoplasmic oocyte processes that are necessary for preimplantation epigenetic reprogramming and ZGA.

Keywords: DNMT1 localization; Padi6; epigenetic reprogramming; imprinting disorders; maternal-effect genes; multilocus imprinting disturbance; subcortical maternal complex; zygotic genome activation.


Figures

Figure 1.
Figure 1.
Characterization of the mouse line carrying the Padi6P620A mutation. (A) Genotype distribution of the offspring derived from Padi6P620A/+ matings. (B) Comparison of morphological characteristics between Padi6+/+ and Padi6P620A/P620A ovaries. The mice were derived from the same litter, and the ovaries were collected from 8-wk-old females. (C) Hematoxylin and eosin staining on paraffin-embedded Padi6+/+ (top) and Padi6P620A/P620A (bottom) ovaries; the left and middle panels show primary and secondary follicles, and the right panel shows an antral follicle. (D) Box plot representing the Padi6 expression level calculated from log2 mean counts of scRNA-seq data of 18 Padi6+/+ (gray) and 20 Padi6P620A/P620A (blue) MII oocytes. (E) Western blotting analysis of PADI6 and GAPDH in Padi6+/+, Padi6+/P620A, and Padi6P620A/P620A ovaries. The data shown are representative of three independent experiments. (F, left) Representative images of immunostaining of Padi6+/+ (top) and Padi6P620A/P620A (bottom) GV oocytes with anti-PADI6 antibodies (red) and DAPI (blue). (Right) Quantification of PADI6 immunostaining intensity. “n” denotes the number of oocytes analyzed in three independent experiments. (G) Representative images of paraffin-embedded ovarian sections from 8-wk-old Padi6+/+ (top) and Padi6P620A/P620A (bottom) mice immunostained with anti-PADI6 antibodies (red) and DAPI (blue). Consistent results were obtained in two independent experiments. (H,I) Female (H) and male (I) fertility of Padi6+/+ (gray), Padi6P620A/+ (light blue), and Padi6P620A/P620A (blue) mice; 2- to 4-mo-old females (H) and males (I) of the indicated genotypes were mated with Padi6+/+ males and females, respectively. “n” denotes the number of mice analyzed. The data shown in D, F, H, and I are mean ± SD and were analyzed using an unpaired two-tailed Student's t-test. (ns) P > 0.05, (**) P < 0.01, (***) P < 0.001, (****) P < 0.0001.
Figure 2.
Figure 2.
Effect of the Padi6P620A variant on gene expression and protein level of the components of the SCMC. (A) Box plot showing Nlrp5, Ooep, and Tle6 gene expression analysis in Padi6+/+ (gray), Padi6P620A/+(light blue), and Padi6P620A/P620A (blue) ovaries, as assessed by RT-qPCR, after normalization against the level of β-actin. Each dot represents a single replicate of three independent experiments. (B) Box plot showing the Nlrp5, Ooep, and Tle6 expression levels calculated with log2 mean counts of scRNA-seq data of 18 Padi6+/+ (gray) and 20 Padi6P620A/P620A (blue) MII oocytes. Each dot represents a single MII oocyte. (C) Western blot analysis of NLRP5, TLE6, and GAPDH in Padi6+/+, Padi6+/P620A, and Padi6P620A/P620A ovaries. The data shown are representative of three independent experiments. (D, left) Representative images of immunostaining of Padi6+/+ (top) and Padi6P620A/P620A (bottom) GV oocytes with anti-OOEP antibodies (green) and DAPI (blue). (Right) Quantification of the OOEP nuclear/cytoplasmic ratio. (E, left) Representative images of immunostaining of Padi6+/+ (top) and Padi6P620A/P620A (bottom) GV oocytes with anti-NLRP5 antibodies (green) and DAPI (blue). (Right) Quantification of the NLRP5 nuclear/cytoplasmic ratio. (F, left) Representative images of immunostaining of Padi6+/+ (top) and Padi6P620A/P620A (bottom) GV oocytes with anti-TLE6 antibodies (green) and DAPI (blue). (Right) Quantification of the TLE6 nuclear/cytoplasmic ratio. In DF, “n” denotes the number of oocytes analyzed in three independent experiments. The data shown in A, B, and DF are mean ± SD and were analyzed using an unpaired two-tailed Student's t-test. (ns) P > 0.05, (***) P < 0.001.
Figure 3.
Figure 3.
Effect of Padi6P620A variant on IVF and embryo development. (A) Number of MII oocytes ovulated per female mouse after PMSG + hCG hormone treatment. “n” denotes the number of females analyzed. (B) Bar plot representing the fertilization rate after IVF of MII oocytes from 8-wk-old Padi6+/+ (gray) and Padi6P620A/P620A (blue) females with wild-type sperm. (C) Line plot showing the percentage of Padi6+/+ (gray) and Padi6MatP620A/+ (blue) embryos developed after IVF. Each dot and triangle represents an independent experiment. (D) Representative still frames of Padi6+/+ (top) and Padi6MatP620A/+ (bottom) embryos at 24, 48, 72, and 96 h after IVF. Arrowheads indicate different developmental stages: unfertilized oocyte (white), two-cell embryo (yellow), four-cell embryo (red), morula (purple), blastocyst (light blue), and abnormal embryo (light green). (E) Representative examples of Padi6+/+ (top) and Padi6MatP620A/+ (bottom) blastocysts. The data shown in A and B are mean ± SD and were analyzed using an unpaired two-tailed Student's t-test. (ns) P > 0.05,
Figure 4.
Figure 4.
scRNA-seq and scBS-seq analyses of Padi6P620A/P620A and Padi6+/+ MII oocytes. (A) PCA of all the genes covered by the scRNA-seq experiment. Principal component 1 (PC1) is plotted on the x-axis and principal component 2 (PC2) is displayed on the y-axis. Each dot corresponds to an MII oocyte, and gray and blue indicate the Padi6+/+ and Padi6P620A/P620A genotypes, respectively. (B) Volcano plot displaying the differentially expressed genes (DEGs) between Padi6P620A/P620A and Padi6+/+ MII oocytes. The log2 fold change (log2FC) is reported on the x-axis, and the significance expressed as −log10(FDR). The dashed lines represent the thresholds used for DEGs (|log2FC| > 1 and FDR < 0.01) on the y-axis. The up-regulated genes are displayed in red, and the down-regulated genes are shown in blue. (C) Heat map displaying the DEGs between the Padi6P620A/P620A and Padi6+/+ MII oocytes. Columns represent different samples, and rows represent different genes. Hierarchical clustering identifies three clusters: cluster 1 (orange), cluster 2 (red), and cluster 3 (green). The expression profile is represented as scaled FPKM. (D) Volcano plots displaying the DEGs between cluster 2 and cluster 3 (C2-DEGs). The up-regulated and the down-regulated genes are reported as red and blue dots, respectively. The green dots represent GV markers. Log2 fold change (log2FC) is reported on the x-axis, and significance is expressed as −log10(FDR) on the y-axis. (E) Box plot displaying the percentage CpG methylation of each MII oocyte as assessed by scBS-seq and passing quality control. (F–J) Violin and box plots displaying the DNA methylation level of the whole genome divided into 100-CpG tiles (F), gene bodies (G), promoter regions (TSS-3000+100) (H), CpG islands (I), and LTR elements (J) of the Padi6P620A/P620A and Padi6+/+ MII oocytes. In each case, the violin plots represent the merged data from two Padi6P620A/P620A and four Padi6+/+ MII oocytes. (K) Dot plot displaying the DNA methylation level of the imprinted germline DMRs in Padi6P620A/P620A (x-axis) and Padi6+/+ (y-axis) MII oocytes. Red and blue dots represent the DMRs that are methylated in oocytes and sperm, respectively. The data shown in EK were analyzed using Wilcoxon signed ranked test. (ns) P > 0.05, (***) P < 0.001, (****) P < 0.0001.
Figure 5.
Figure 5.
scRNA-seq and BS-seq analyses of Padi6MatP620A/+ two-cell embryos. (A) Heat map displaying the 624 DEGs between the Padi6P620A/+ and Padi6+/+ two-cell embryos. Note that two distinct clusters characterized by the two different genotypes segregate by hierarchical clustering. The expression profile is represented as scaled FPKM. (B) Volcano plot displaying color-coded DEGs based on their role in ZGA or maternal decay. (C) Dot plot showing the differential expression of genes with important roles in ZGA. The log2 fold change (log2FC) is reported on the x-axis, and the significance expressed as −log10(FDR) is displayed on the y-axis. (D) Bar plot showing the distribution of the cell cycle phases (G1, S, and G2/M) in Padi6MatP620A/+ (blue) and Padi6+/+ (gray) two-cell blastomeres. (E) Box plot displaying the CpG methylation in the two-cell embryos. (F–I) Violin and box plots displaying the DNA methylation of the whole genome divided into 100-CpG tiles (F), promoter regions (TSS-3000+100) (G), old and younger LINEs (H), and LTR subclasses (I) of the Padi6MatP620A/+ and Padi6+/+ two-cell embryos. In each case, the violin plots represent the merged data from 12 Padi6MatP620A/+ and 14 Padi6+/+ two-cell embryos. (J) Dot plot displaying the DNA methylation level of the imprinted germline DMRs in Padi6MatP620A/+ (x-axis) and Padi6+/+ (y-axis) two-cell embryos, represented as in Figure 4J. (K) Upset plot intersecting the 2c-DEGs with promoter (TSS-3000+100) DNA methylation. The DEGs are divided into up-regulated and down-regulated; promoter DNA methylation is indicated as hypermethylated or hypomethylated if |methylation defect| > 10%. The data shown in EJ were analyzed using Wilcoxon signed ranked test. (ns) P > 0.05, (*) P < 0.05, (****) P < 0.0001.
Figure 6.
Figure 6.
Comparison of methylation levels of MII oocytes and two-cell embryos. (A) Violin plots showing comparison of the average methylation of 100-CpG tiles (excluding CGIs) that are >80% methylated in Padi6+/+ MII oocytes (MII wt) with the same tiles in Padi6P620A/P620A MII oocytes (MII mut), Padi6+/+ two-cell embryos (2c wt), and Padi6MatP620A/+ two-cell embryos (2c mut). (B) Analysis similar to A with tiles (excluding CGIs) that are <20% methylated in Padi6+/+ MII oocytes. (C) Analysis similar to A with tiles covering CGIs that are >80% methylated in Padi6+/+ MII oocytes. (D) Analysis similar to A with tiles covering CGIs that are <20% methylated in Padi6+/+ MII oocytes. The lower methylation of some tiles in MII mut oocytes with respect to MII wt oocytes in A and C and the higher methylation in B and D are caused in part by hypomethylation of the mutant oocyte genome and in part by stochastic, sparse coverage and sampling of different CpGs in the tiles, as demonstrated by the reverse analysis (Supplemental Fig. S6). The data shown in A–D were analyzed using Wilcoxon signed ranked test. (****) P < 0.0001.
Figure 7.
Figure 7.
Effect of the Padi6P620A variant on expression and subcellular localization of DNMTs, UHRF1, and TET3. (A) Box plot representing the expression level of the Dnmt1, Dnmt3a, Tet3, and Uhrf1 genes, calculated as log2 mean counts of scRNA-seq data obtained from 18 Padi6+/+ (gray) and 20 Padi6P620A/P620A (blue) MII oocytes. Each dot represents a single MII oocyte. (B) Box plot representing the expression level of the genes shown in A in 18 Padi6+/+ (gray) and 18 Padi6MatP620A/+ (blue) two-cell embryos. Each dot represents a single blastomere. (C, top) Western blot analysis of TET3, DNMT1, DNMT3A, UHRF1, and GAPDH in Padi6+/+ and Padi6P620A/P620A oocytes. (Bottom) Quantification of protein signal intensity normalized on GAPDH. (DG, left) Representative images of Padi6+/+ (top) and Padi6P620A/P620A (bottom) GV oocytes immunostained with anti-DNMT1 (red; D), anti-UHRF1 (green; E), anti-DNMT3A (green; F), and anti-TET3 (green; G) antibodies. (Right) Quantification of the DNMT1 (D), UHRF1 (E), DNMT3A (F), and TET3 (G) nuclear/cytoplasmic ratio in Padi6+/+ and Padi6P620A/P620A GV oocytes. (HK, left) Representative images of Padi6+/+ (top) and Padi6MatP620A/+ (bottom) zygotes immunostained with anti-DNMT1 (red; H), anti-UHRF1 (green; I), anti-DNMT3A (green; J), and anti-TET3 (green; K) antibodies. The maternal (MPN) and paternal (PPN) pronuclei are indicated by ♀ and ♂, respectively. (Right) Quantification of the DNMT1 (H), UHRF1 (I), DNMT3A (J), and TET3 (K) pronuclear/cytoplasmic ratio in Padi6+/+ and Padi6MatP620A/+ zygotes. (DK) “n” denotes the number of oocytes analyzed in three independent experiments. The data in AK are mean ± SD and were analyzed using an unpaired two-tailed Student's t-test. (ns) P > 0.05, (**) P < 0.01, (***) P < 0.001, (****) P < 0.0001. CK are representative images from three independent biological replicates.
Figure 8.
Figure 8.
Effect of 5-aza treatment on Padi6+/+ and Padi6MatP620A/+ two-cell embryos. (A) Immunostaining with anti-5mC antibodies of Padi6+/+ and Padi6MatP620A/+ two-cell embryos untreated or treated with the methylation inhibitor 5-aza. (B) Quantification of the immunofluorescent signal of 5mC after the 5-aza treatment in both wt and mutant two-cell embryos. “n” in parentheses denotes the number of oocytes analyzed in three independent experiments. (C) Representative still frames of Padi6+/+ and Padi6MatP620A/+ embryos untreated or treated with 5-aza at 24, 48, 72, and 96 h after IVF. (D) Line plot showing the percentage of Padi6+/+ embryos untreated (gray) or treated with 5-aza (dark gray) and Padi6MatP620A/+ embryos untreated (blue) or treated with 5-aza (black), developed after IVF. Each dot represents an independent experiment.

References

    1. Angermueller C, Clark SJ, Lee HJ, Macaulay IC, Teng MJ, Hu TX, Krueger F, Smallwood S, Ponting CP, Voet T, et al. 2016. Parallel single-cell sequencing links transcriptional and epigenetic heterogeneity. Nat Methods 13: 229–232. 10.1038/nmeth.3728 - DOI - PMC - PubMed
    1. Anvar Z, Chakchouk I, Sharif M, Mahadevan S, Nasiotis ET, Su L, Liu Z, Wan YW, Van den Veyver IB. 2023. Loss of the maternal effect gene Nlrp2 alters the transcriptome of ovulated mouse oocytes and impacts expression of histone demethylase KDM1B. Reprod Sci 30: 2780–2793. 10.1007/s43032-023-01218-8 - DOI - PMC - PubMed
    1. Aoki F. 2022. Zygotic gene activation in mice: profile and regulation. J Reprod Dev 68: 79–84. 10.1262/jrd.2021-129 - DOI - PMC - PubMed
    1. Barlow DP, Bartolomei MS. 2014. Genomic imprinting in mammals. Cold Spring Harb Perspect Biol 6: a018382. 10.1101/cshperspect.a018382 - DOI - PMC - PubMed
    1. Bebbere D, Albertini DF, Coticchio G, Borini A, Ledda S. 2021. The subcortical maternal complex: emerging roles and novel perspectives. Mol Hum Reprod 27: gaab043. 10.1093/molehr/gaab043 - DOI - PubMed

Publication types

Substances