. 2024 Mar 7;10(1):120.
doi: 10.1038/s41420-024-01839-1.

Targeting metastasis-initiating cancer stem cells in gastric cancer with leukaemia inhibitory factor

Affiliations

Targeting metastasis-initiating cancer stem cells in gastric cancer with leukaemia inhibitory factor

Lornella Seeneevassen et al. Cell Death Discov. .

Abstract

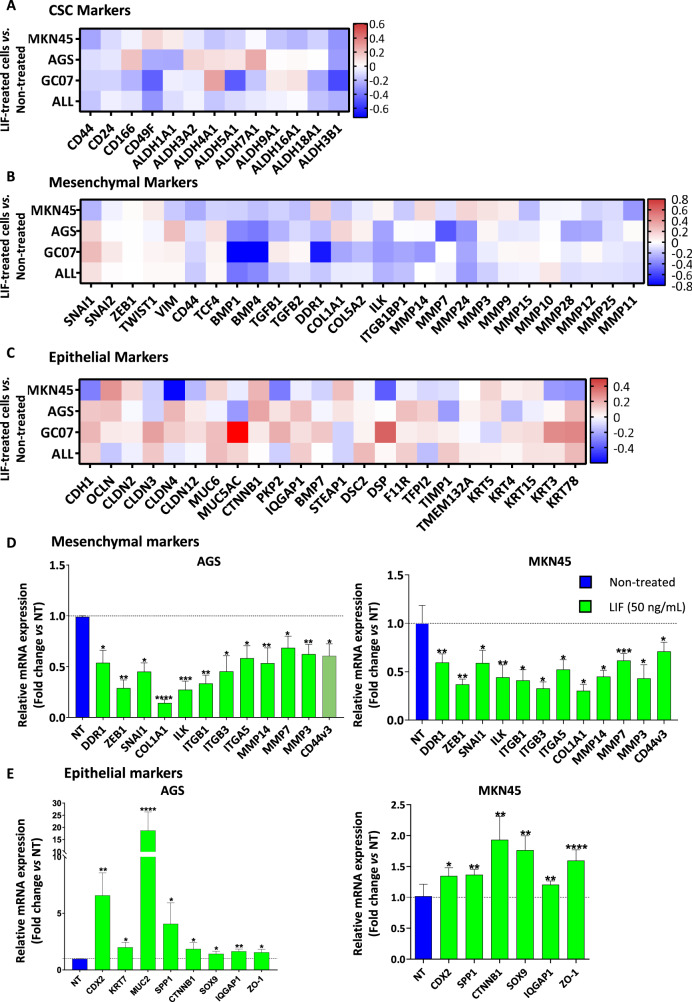
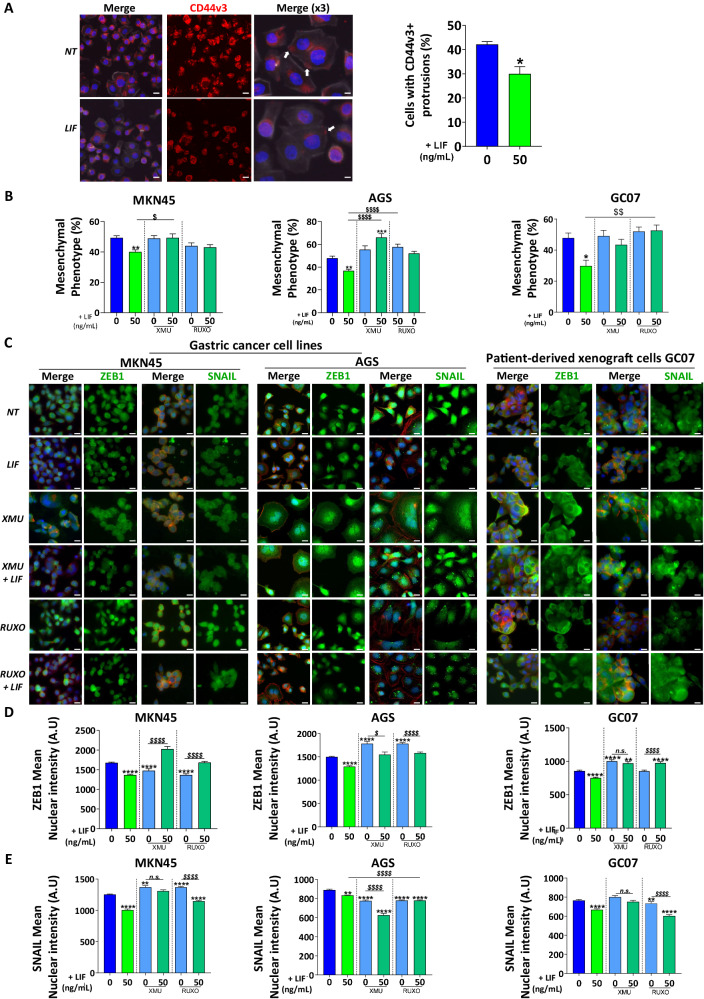
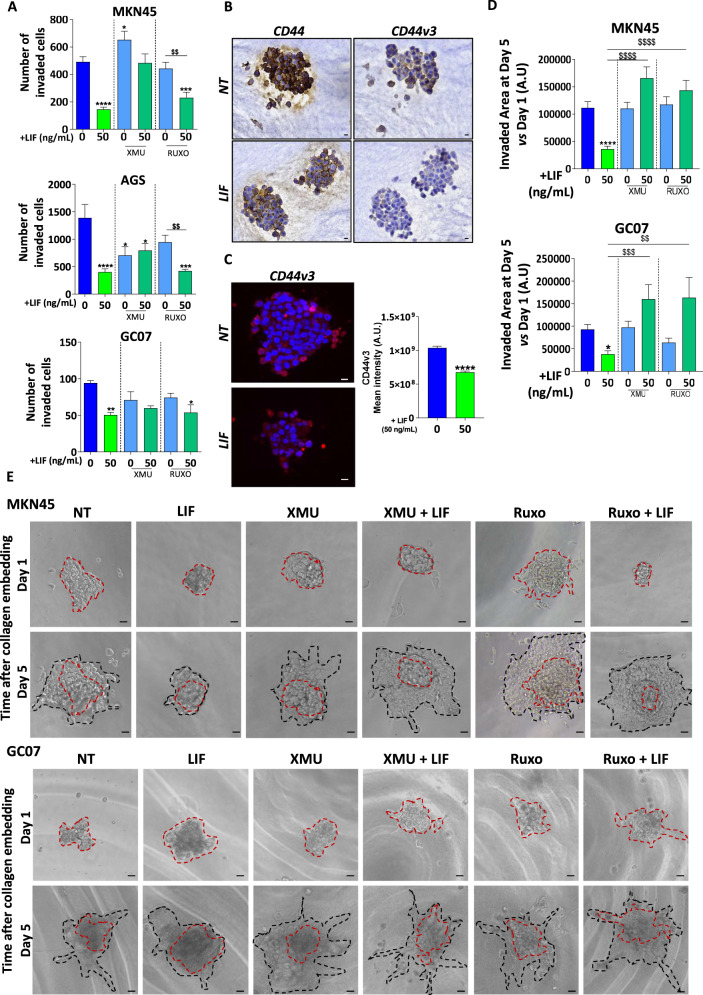
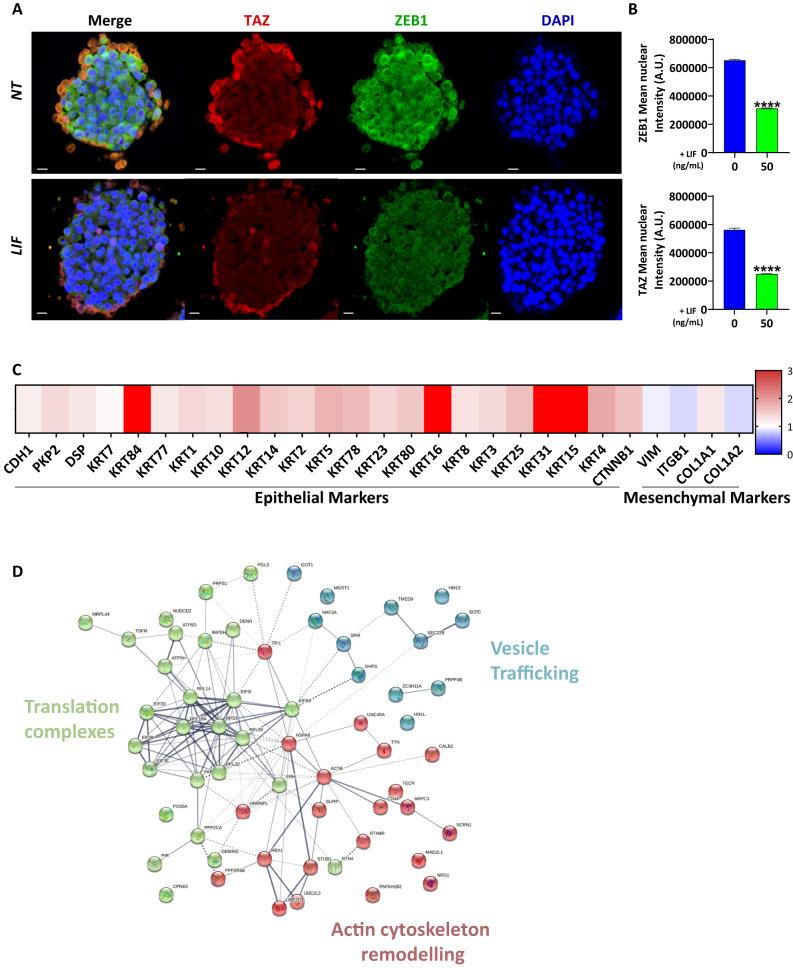
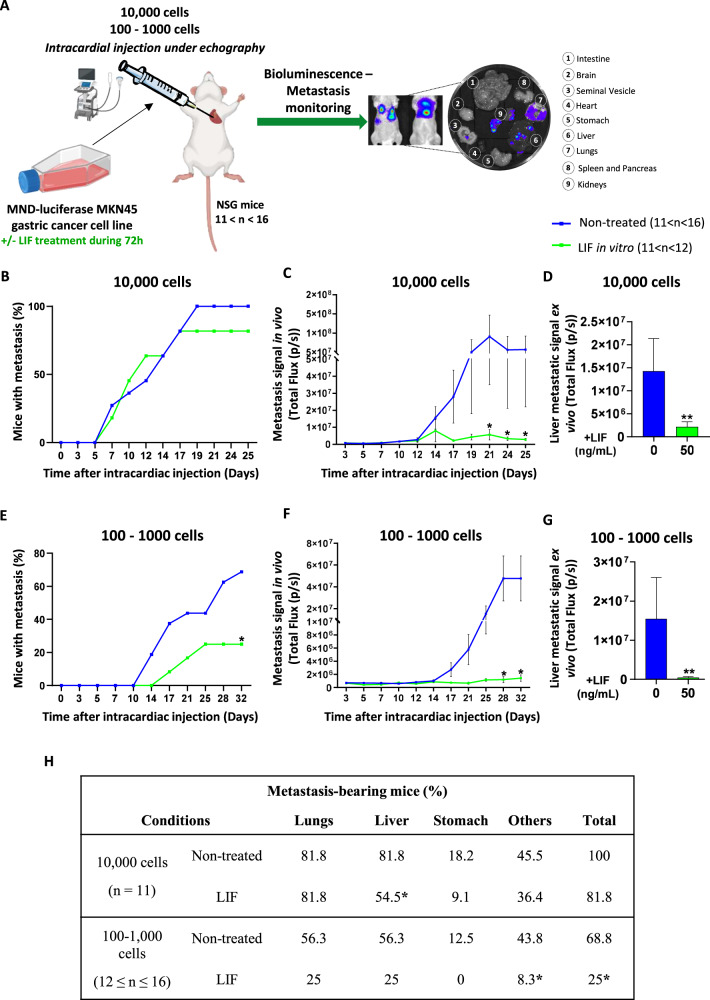
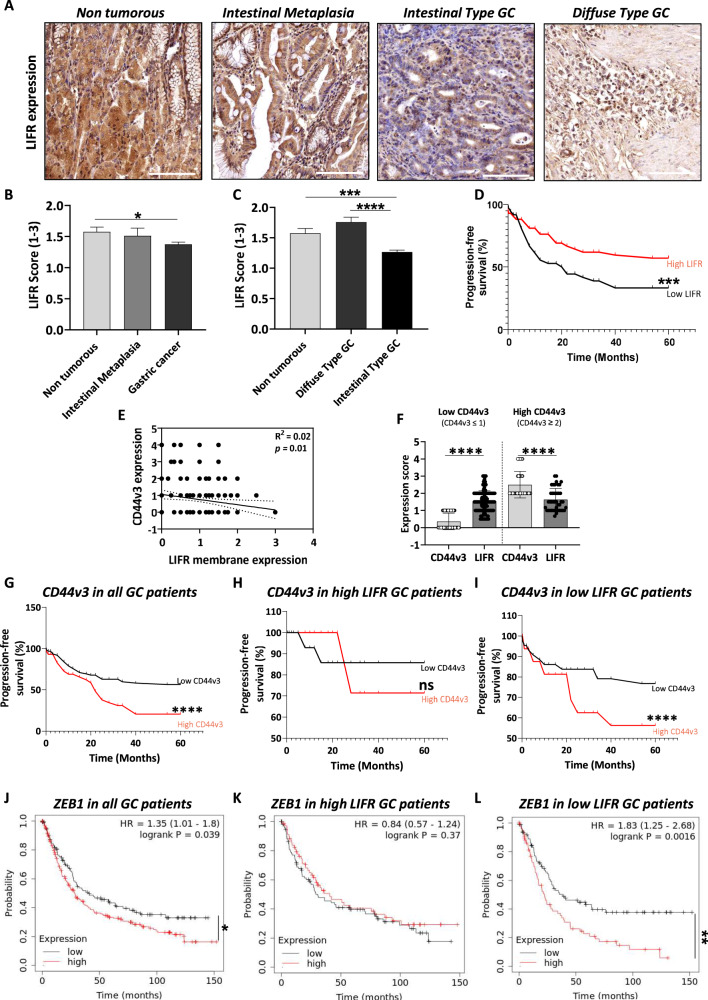
Gastric cancer's (GC) bad prognosis is usually associated with metastatic spread. Invasive cancer stem cells (CSC) are considered to be the seed of GC metastasis and not all CSCs are able to initiate metastasis. Targeting these aggressive metastasis-initiating CSC (MIC) is thus vital. Leukaemia inhibitory factor (LIF) is hereby used to target Hippo pathway oncogenic members, found to be induced in GC and associated with CSC features. LIF-treated GC cell lines, patient-derived xenograft (PDX) cells and/or CSC tumourspheres underwent transcriptomics, laser microdissection-associated proteomics, 2D and 3D invasion assays and in vivo xenograft in mice blood circulation. LIFR expression was analysed on tissue microarrays from GC patients and in silico from public databases. LIF-treated cells, especially CSC, presented decreased epithelial to mesenchymal transition (EMT) phenotype and invasion capacity in vitro, and lower metastasis initiation ability in vivo. These effects involved both the Hippo and Jak/Stat pathways. Finally, GC's high LIFR expression was associated with better clinical outcomes in patients. LIF treatment could thus represent a targeted anti-CSC strategy to fight against metastatic GC, and LIFR detection in primary tumours could constitute a potential new prognosis marker in this disease.


Conflict of interest statement

The authors declare no conflict of interest. The funders had no role in the design of the study; in the collection, analyses, or interpretation of data; in the writing of the manuscript, or in the decision to publish the results.

Figures

Fig. 1
Fig. 1. Leukaemia inhibitory factor presents an EMT-inhibiting signature in GC cells.
Relative LIF-treated cells gene expression profiles showing A CSC markers, B mesenchymal markers and C epithelial markers expression in MKN45 and AGS GC cell lines and GC07 PDX cells. Agilent microarray transcriptomic analysis was carried out on LIF-treated cells compared to non-treated cells. The fourth row represents the mean expression fold change in all the cells analysed. Relative mRNA expressions of D mesenchymal and E epithelial markers, assessed by RT-qPCR, after treatment of AGS and MKN45 cells with (green) or without (blue) LIF. LIF treatments (50 ng/mL) were carried out for 48 h. Values represent fold change vs. non-treated cells, 3 < n < 4. *p < 0.05, **p < 0.005, ***p < 0.0005 and ****p < 0.0001 vs. untreated controls with ANOVA statistical analyses.
Fig. 2
Fig. 2. Leukaemia inhibitory factor decreases EMT-associated transcription factors nuclear expression and EMT phenotype of GC cells.
A Representative immunofluorescence images of AGS GC cell lines stained with anti-CD44v3 antibody (red). Cells with CD44v3-positive cell protrusions (white arrows) were quantified. All cells were marked with phalloidin (grey) and DAPI (blue). Scale bars 10 µm. B Mesenchymal phenotype quantification of MKN45 and AGS GC cell lines and GC07 PDX cells. Quantifications were done on phalloidin-stained cells and values represent the percentage of cells with mesenchymal phenotype of n = 3 experiments ± SEM. C Representative immunofluorescence images of MKN45 and AGS GC cell lines and GC07 GC PDX cells stained with anti-ZEB1 or anti-SNAIL antibodies (green). All cells were marked with phalloidin (red) and DAPI (blue). Scale bars 10 µm. D and E Relative quantification of relative nuclear expression of ZEB1 or SNAIL in cells. Values represent mean nuclear intensity ± S.E.M., 3 < n < 4. All cells were treated with 50 ng/mL LIF (green) and/or 0.5 µM XMU-MP-1 (XMU) (emerald green) and 1 µM Ruxolitinib (emerald green) for 48 h. Inhibitors were added 30 min before LIF stimulation. *p < 0.05, **p < 0.005, ***p < 0.0005 and ****p < 0.0001 vs. untreated controls and $p < 0.05, $$p < 0.005 and $$$$p < 0.0001 vs. the conditions indicated by the bars, all with ANOVA statistical analyses.
Fig. 3
Fig. 3. Leukaemia inhibitory factor decreases invasion of gastric cancer cells and Metastasis-initiating CSC.
A Quantification of the number of invaded cells following the different treatments of GC cell lines and PDX cells. B Representative immunohistochemistry images of 3D collagen-invasion models stained with anti-CD44 and anti-CD44v3 antibodies. All cells were treated with 50 ng/mL LIF each 48 h. C Representative immunofluorescence images and quantification of collagen-embedded tumourspheres stained with anti-CD44v3 antibody. Tumourspheres were treated or not with LIF and CD44v3 Mean intensity was quantified. D and E Quantification and representative images of 3D collagen-invasion assay MKN45 GC cell line and GC07 GC PDX cells. Quantification was done for the invaded area on Day 5 (black dotted lines) vs. Day 1 (red dotted lines, treatments. All cells were treated with 50 ng/mL LIF (green) and/or 0.5 µM XMU-MP-1 (XMU) (emerald green) and 1 µM Ruxolitinib (emerald green) each 48 h. Inhibitors were added 30 min before LIF stimulation. Scale bars 20 µm, 4 < n < 5, *p < 0.05 and ****p < 0.0001 vs. untreated controls and $$p < 0.005, $$$p < 0.0005 and $$$$p < 0.0001 vs. the conditions indicated by the bars, all with ANOVA statistical analyses.
Fig. 4
Fig. 4. Leukaemia inhibitory factor decreases EMT markers in invasive gastric CSCs.
A Representative immunofluorescent images of 3D collagen-invasion models of MKN45 GC cells stained with TAZ (red), ZEB1 (green) and DAPI (blue). B Relative quantification of cells with ZEB1 or TAZ-positive nucleus. Values represent Mean Nuclear intensity ± SEM, n = 3. C Relative protein expression profile of invasive fronts of LIF-treated spheres vs. non-treated spheres, following laser microdissection and LC–MS/MS mass spectrometry. Epithelial and mesenchymal markers are represented. D String software analysis of protein expression profile of invasive fronts of LIF-treated spheres vs. non-treated spheres. Scale bars 20 µm, ****p < 0.0001 vs. untreated controls, Mann–Whitney statistical analyses.
Fig. 5
Fig. 5. Leukaemia Inhibitory Factor presents anti-metastatic properties in vivo and affects organ colonisation.
A Schematical representation of the in vivo experimental procedure and organs collected. Mice were injected with LIF-treated (green) or not (blue) MKN45 cells (10,000, 100 and 1000). Results obtained from 100 to 1000 cell conditions were grouped and named 100–1000. Metastasis follow-up of B and E Percentage of mice developing metastases; C and F Metastasis signal quantification in vivo; D, G) Liver metastatic signal quantification. Percentages were converted to binary values (0 = negative signal and 1 = positive signal) for statistical analysis. Total flux of bioluminescent signal ± SEM is represented in C, D, F, G. H Percentage of metastasis-bearing mice. 11–16 mice were injected with 100 to 10,000 MKN45-luciferase expressing cells previously treated or not with LIF, and bioluminescence was recorded to detect metastases in the different organs. *p < 0.05 and **p < 0.005 vs. untreated controls, Mann–Whitney statistical analyses.
Fig. 6
Fig. 6. Leukaemia inhibitory factor receptor is downregulated in GC.
A Representative images of the different types of TMA stained and analysed for LIFR expression (X20). Scale bars 100 µm. LIFR expression scored on TMA from GC patients. B and C Overall LIFR expression was analysed, and different comparisons were done: B Expression in Intestinal Metaplasia (n = 25) and GC (n = 146) were compared to non-tumorous tissue (n = 81), C GC was separated into the Laurèn classification-based subtypes diffuse (n = 33) and intestinal (n = 113) and compared to expression in non-tumorous tissue. Values represented mean LIFR scores according to the following criteria: 0: no expression, 1: 1–20%, 2: 20–50%, 3: >50. D Progression-free survival curves showing patients’ survival percentage according to overall LIFR low expression (LIFR ≤ 1, n = 40) and high expression (LIFR > 1, n = 68). E Correlation analysis of CD44v3 and LIFR-membrane expression scores (n = 133). F Expression scores of CD44v3 and LIFR in tumours having low CD44v3 (CD44v3 ≤ 1, n = 92) and high CD44v3 expression (CD44v3 ≥ 2, n = 42). G–I Progression-free survival curves showing survival percentage of GC patients (14 ≤ n ≤ 69) according to G CD44v3 expression in all patients independent of LIFR expression profile; H CD44v3 expression in patients having high LIFR expression; I CD44v3 expression in patients having low LIFR expression. Red bars represent high CD44v3 expression and black bars have low CD44v3 expression. J–L KMplot database analyses showing overall survival probability of GC patients (69 ≤ n ≤ 249) according to J ZEB1 expression in all patients independent of LIFR expression profile; K ZEB1 expression in patients having high LIFR expression; L ZEB1 expression in patients having low LIFR expression. Red bars represent high ZEB1 expression and black bars have low ZEB1 expression. *p < 0.05, **p < 0.005, ***p < 0.0005 and ****p < 0.0001 vs. the conditions indicated by the bars, ANOVA, Wilcoxon paired t-test statistical analyses, paired t-test and log-rank test.

References

    1. Sung H, Ferlay J, Siegel RL, Laversanne M, Soerjomataram I, Jemal A, Bray F. Global Cancer Statistics 2020: GLOBOCAN Estimates of Incidence and Mortality Worldwide for 36 Cancers in 185 Countries. CA Cancer J Clin. 2021;71:209–49. 10.3322/caac.21660. Epub 4 Feb 2021. - PubMed
    1. Knight WR, Allum WH. Gastric tumours. Medicine. 2019;47:309–13. doi: 10.1016/j.mpmed.2019.02.002. - DOI
    1. Carrasco-Garcia E, García-Puga M, Arevalo S, Matheu A. Towards precision medicine: linking genetic and cellular heterogeneity in gastric cancer. Ther Adv Med Oncol 2018;10. 10.1177/1758835918794628. - PMC - PubMed
    1. Seeneevassen L, Giraud J, Molina-Castro S, Sifré E, Tiffon C, Beauvoit C, et al. Leukaemia inhibitory factor (LIF) inhibits cancer stem cells tumorigenic properties through hippo kinases activation in gastric cancer. Cancers (Basel) 2020;12. 10.3390/cancers12082011. - PMC - PubMed
    1. Nguyen PH, Giraud J, Chambonnier L, Dubus P, Wittkop L, Belleannée G, et al. Characterization of biomarkers of tumorigenic and chemoresistant cancer stem cells in human gastric carcinoma. Clin Cancer Res. 2017;23:1586–97. doi: 10.1158/1078-0432.CCR-15-2157. - DOI - PubMed