. 2024 Mar 7;15(1):2105.
doi: 10.1038/s41467-024-46165-3.

Disentangling top-down drivers of mortality underlying diel population dynamics of Prochlorococcus in the North Pacific Subtropical Gyre

Affiliations

Disentangling top-down drivers of mortality underlying diel population dynamics of Prochlorococcus in the North Pacific Subtropical Gyre

Stephen J Beckett et al. Nat Commun. .

Abstract

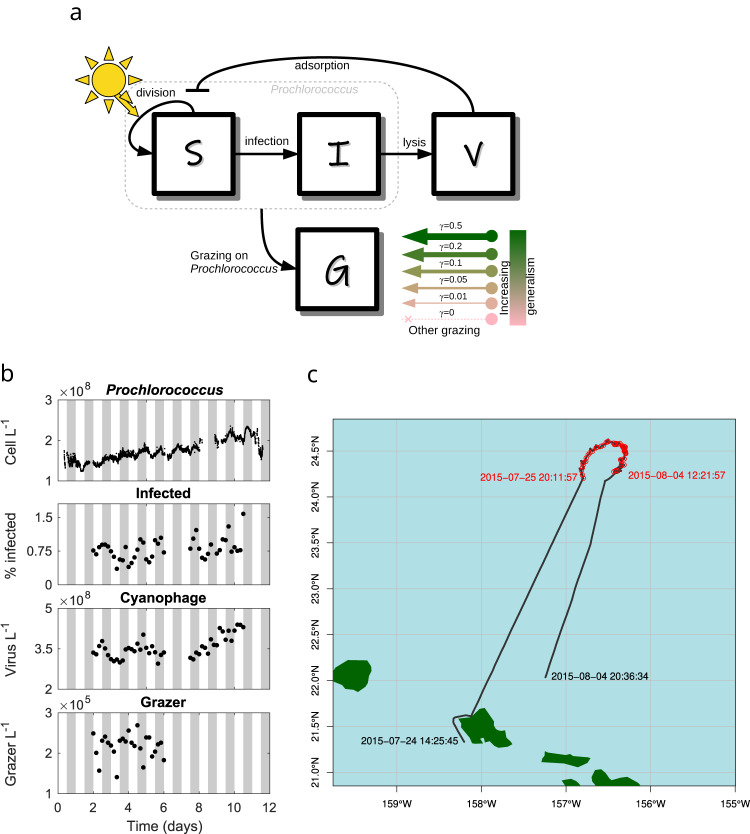
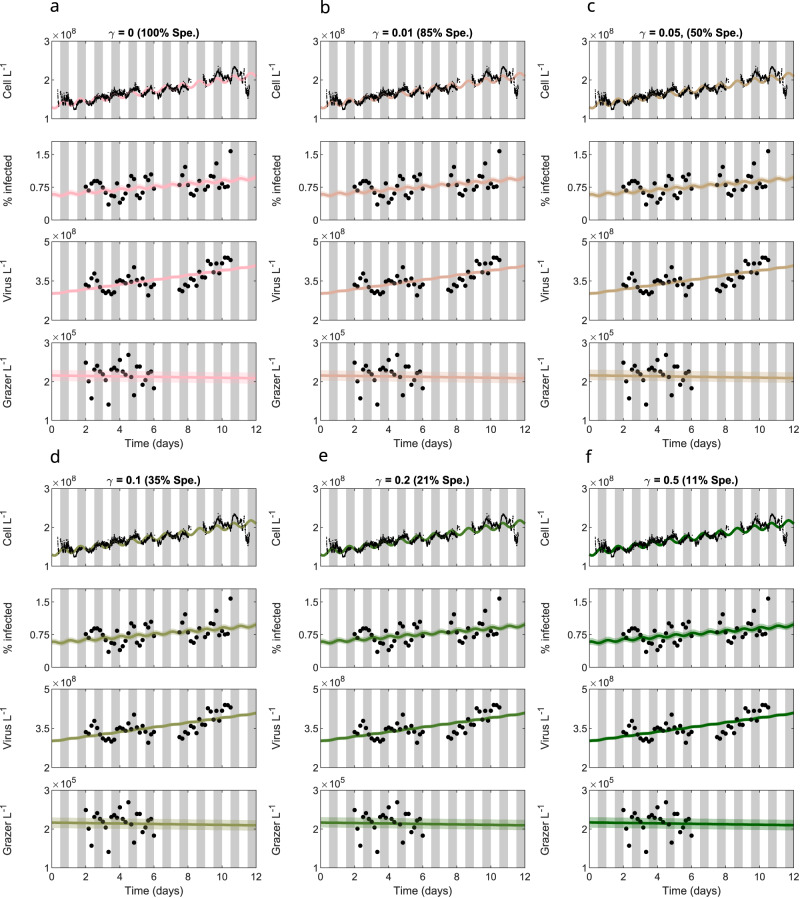
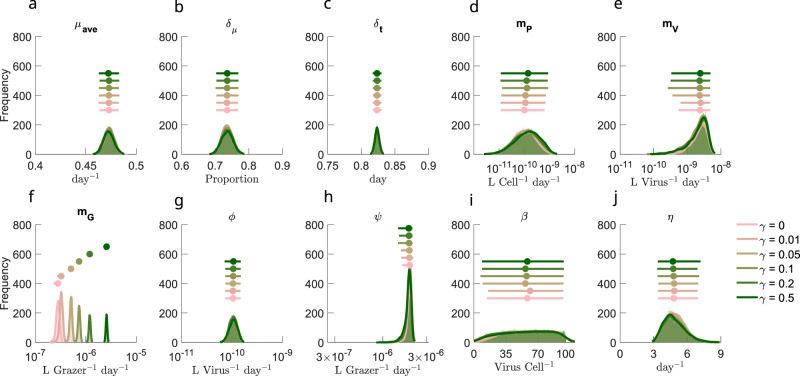
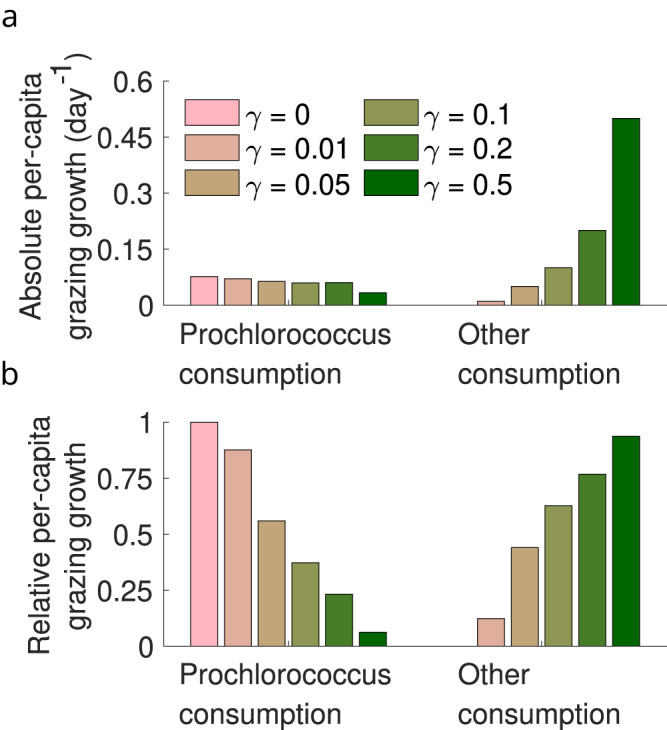
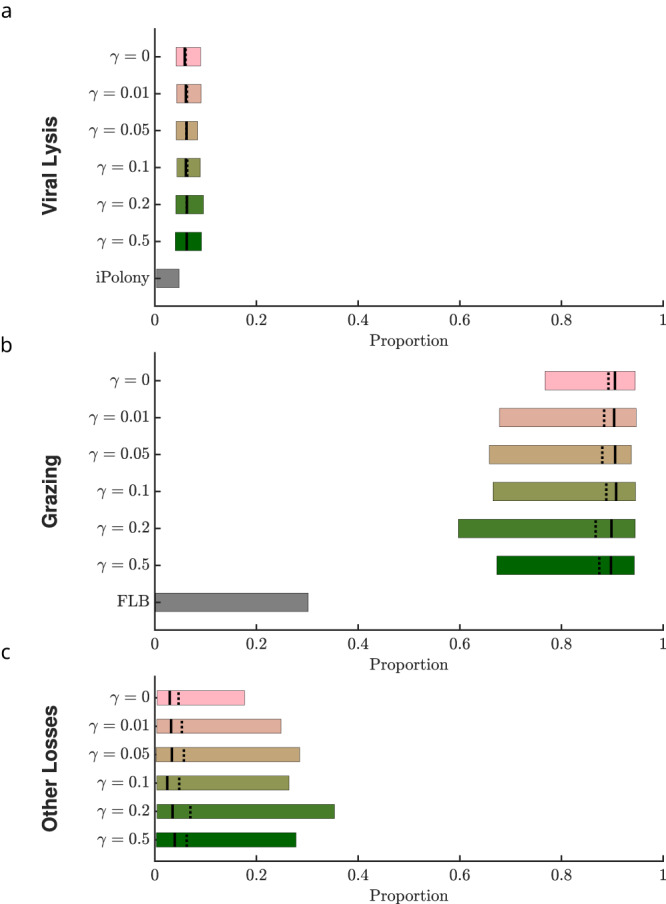
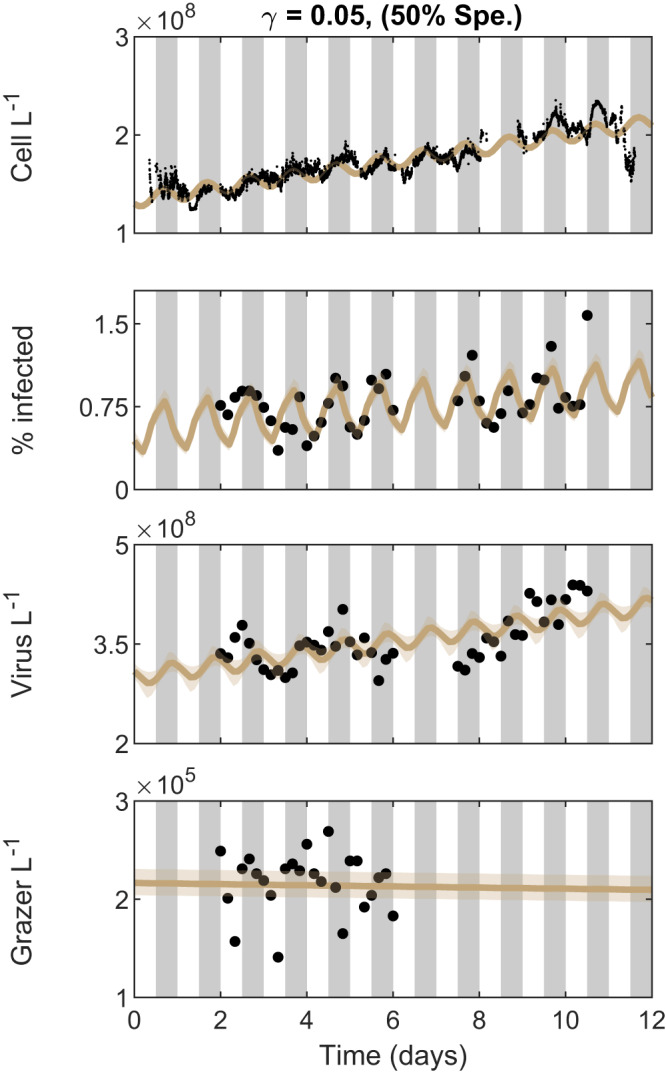
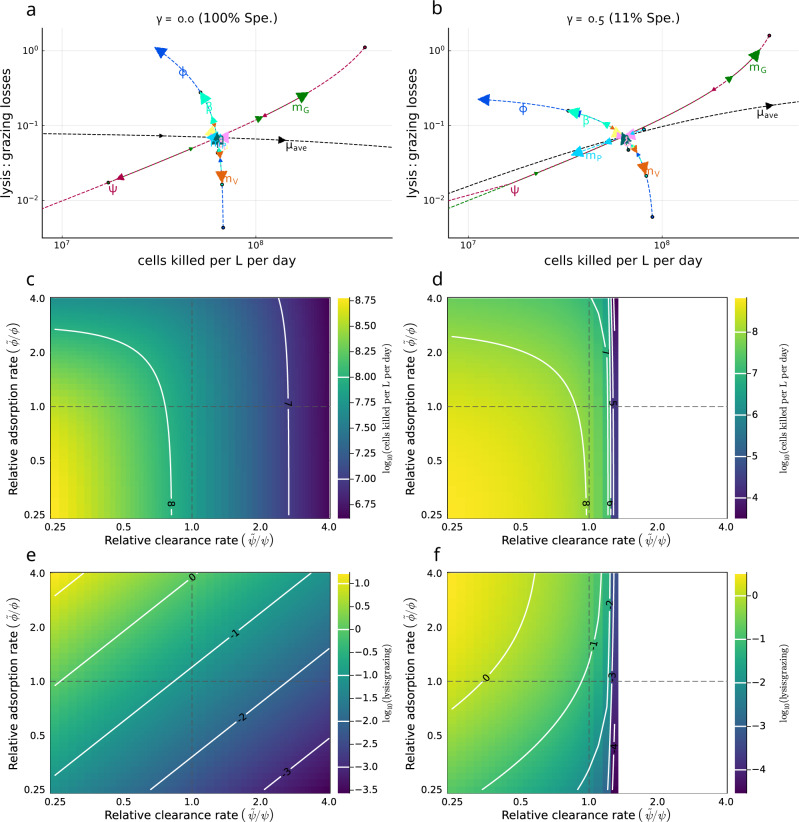
Photosynthesis fuels primary production at the base of marine food webs. Yet, in many surface ocean ecosystems, diel-driven primary production is tightly coupled to daily loss. This tight coupling raises the question: which top-down drivers predominate in maintaining persistently stable picocyanobacterial populations over longer time scales? Motivated by high-frequency surface water measurements taken in the North Pacific Subtropical Gyre (NPSG), we developed multitrophic models to investigate bottom-up and top-down mechanisms underlying the balanced control of Prochlorococcus populations. We find that incorporating photosynthetic growth with viral- and predator-induced mortality is sufficient to recapitulate daily oscillations of Prochlorococcus abundances with baseline community abundances. In doing so, we infer that grazers in this environment function as the predominant top-down factor despite high standing viral particle densities. The model-data fits also reveal the ecological relevance of light-dependent viral traits and non-canonical factors to cellular loss. Finally, we leverage sensitivity analyses to demonstrate how variation in life history traits across distinct oceanic contexts, including variation in viral adsorption and grazer clearance rates, can transform the quantitative and even qualitative importance of top-down controls in shaping Prochlorococcus population dynamics.


Conflict of interest statement

The authors declare no competing interests.

Figures

Fig. 1
Fig. 1. Community ecological model of viral and grazer mediated predation; and SCOPE HOE-Legacy 2A cruise field data.
a Prochlorococcus are structured by infection status. Viruses (V) can infect susceptible Prochlorococcus cells (S) generating infected cells (I). Viral-induced lysis of infected cells releases virus particles back into the environment. Susceptible and infected Prochlorococcus cells are subject to grazing pressure from heterotrophic nanoflagellate grazers (G). Grazers may have a generalist strategy (e.g., grazing on heterotrophs, mixotrophs, and phytoplankton not represented by S and I). We specify six models along this specialism-generalism gradient by setting a parameter γ. When γ = 0 heterotrophic nanoflagellate grazers act as specialists and only consume Prochlorococcus; and as γ increases, Prochlorococcus constitutes less of the diet of heterotrophic nanoflagellate grazers. Parameters and units are specified in Table S2. b Reported empirical population dynamics of Prochlorococcus cells, the percentage of Prochlorococcus cells infected with T4/T7-like cyanophage, the abundance of free-living T4/T7-like cyanophage, and the abundance of heterotrophic nanoflagellate grazers. c Cruise track and sampling stations. Local times (HST) for the start and end of recorded underway sampling (black line), and first and last sampling stations (red points) are annotated.
Fig. 2
Fig. 2. Models across the specialism-generalism gradient fit empirical data.
ECLIP models (lines) are compared against empirical data (points). Model lines represent the median MCMC solution within 95% CI range found by the converged chains, shown as bands with colors representing the choice of γ. Data signals include Prochlorococcus cell abundances (top), the percentage of infected Prochlorococcus cells, the abundance of free viruses and the abundance of heterotrophic nanoflagellate grazers (bottom). The models were fitted against detrended data; for visualization we have added these trends to the model solutions. Gray bars indicate nighttime. Model solutions with: a γ = 0 (grazers act as specialists), b γ = 0.01, c γ = 0.05, d γ = 0.1, e γ = 0.2, f γ = 0.5 day−1. The degree of grazer specialism (Spe.) is shown in parentheses above each subplot.
Fig. 3
Fig. 3. Differences in inferred life-history traits across the specialist-generalist gradient.
aj Parameter posterior distributions for different ECLIP models. Parameters are a μave: average Prochlorococcus division rate, b δμ: division rate amplitude, c δt: phase of division rate, d mP: higher order Prochlorococcus loss rate, e mG: higher order viral loss rate, f mG: higher order grazer loss rate, g ϕ: viral adsorption rate, h ψ: grazer clearance rate, i β: viral burst size, and j η: viral-induced lysis rate. Jittered median (dot) and 95% CI range (horizontal line) for each of the models are shown above density plots. Full details of parameter bounds are shown in Table S2; see Supplementary Information for more details.
Fig. 4
Fig. 4. Model differences across the specialist-generalist gradient.
a, b Inferred grazer growth attributable to consumption of Prochlorococcus or other sources (see Supplementary Information equation 20) across models.
Fig. 5
Fig. 5. Relative importance of viral lysis, grazing, and other effects on total Prochlorococcus mortality.
The proportion of mortality partitioned between a viral-induced lysis, b grazing, and c other sources for the ECLIP models and other measures of relative mortality. For ECLIP the results from all chains are shown. Bars in these panels denote mortality rate proportions associated with the 95% confidence intervals, where the mean and median are shown by solid and dashed lines, respectively. Other plotted measures of relative mortality are given via direct measurements of viral infection (iPolony), and Fluorescently Labelled Bacteria (FLB) incubation measurements (see Supplementary Note 2 for details).
Fig. 6
Fig. 6. Diel-dependent adsorption rates improve fits to infected cells.
ECLIP model solutions with γ = 0.05 and diel-dependent adsorption rates are compared against empirical data in black. Model lines represent the median MCMC solution within 95% CI range found by the converged chains, shown as bands. Data signals include Prochlorococcus cell abundances (top), the percentage of infected Prochlorococcus cells, the abundance of free viruses and the abundance of heterotrophic nanoflagellate grazers (bottom). The models were fitted against detrended data; for visualization we have added these trends to the model solutions. Gray bars indicate nighttime. The degree of grazer specialism (Spe.) is shown in parentheses above the plot.
Fig. 7
Fig. 7. Assessing robustness of the estimated magnitude and source of Prochlorococcus daily mortality.
Sensitivity analysis was conducted based on the MCMC inferred parameter sets for the detrended model with specialist grazing (γ = 0, 100% Spe.) (a, c, e) and the most generalist grazing model (γ = 0.5, 11% Spe.) (b, d, f). a, b A single parameter is varied at a time with all others fixed to evaluate changes in Prochlorococcus daily mortality and the relative role of viral-induced lysis vs. grazing. Arrows, and label positioning relative to the intersection, indicate the effect of increasing each parameter, with circles denoting the smallest value of each parameter. Label and line colors are the same for each parameter varied. Parameters were varied from 0.25x to 4x the baseline value. Parameters are μave: average Prochlorococcus division rate, δμ: division rate amplitude, δt: phase of division rate, mP: higher order Prochlorococcus loss rate, mG: higher order viral loss rate, mG: higher order grazer loss rate, ϕ: viral adsorption rate, ψ: grazer clearance rate, β: viral burst size, and η: viral-induced lysis rate. cf Covariation between adsorption (ϕ~) and clearance rates (ψ~) relative to their MCMC inferred values (respectively, ϕ and ψ) and the effect on Prochlorococcus daily mortality (c, d) and the lysis:grazing ratio (e, f). Dashed lines indicate the MCMC inferred value. Contours in (cf) represent differences in magnitude. Note 100 in (e, f) represents the case when grazing losses are equal to viral-induced losses (100 = 1). White space regions in (d, f) denote scenarios when Prochlorococcus abundance becomes less than 1 cell per L.

References

    1. Vaulot D, Marie D. Diel variability of photosynthetic picoplankton in the equatorial Pacific. J. Geophys. Res.: Oceans. 1999;104:3297–3310. doi: 10.1029/98JC01333. - DOI
    1. Ribalet F, et al. Light-driven synchrony of Prochlorococcus growth and mortality in the subtropical Pacific gyre. Proc. Natl Acad. Sci. USA. 2015;112:8008–8012. doi: 10.1073/pnas.1424279112. - DOI - PMC - PubMed
    1. Hu SK, Connell PE, Mesrop LY, Caron DA. A hard day’s night: Diel shifts in microbial eukaryotic activity in the North Pacific Subtropical Gyre. Front. Mar. Sci. 2018;5:351. doi: 10.3389/fmars.2018.00351. - DOI
    1. Welkie DG, et al. A hard day’s night: Cyanobacteria in diel cycles. Trends Microbiol. 2018;27:231–242. doi: 10.1016/j.tim.2018.11.002. - DOI - PMC - PubMed
    1. Becker KW, et al. Daily changes in phytoplankton lipidomes reveal mechanisms of energy storage in the open ocean. Nat. Commun. 2018;9:5179. doi: 10.1038/s41467-018-07346-z. - DOI - PMC - PubMed