. 2024 Mar 7;15(1):1528.
doi: 10.1038/s41467-024-45615-2.

RHBDL4-triggered downregulation of COPII adaptor protein TMED7 suppresses TLR4-mediated inflammatory signaling

Affiliations

RHBDL4-triggered downregulation of COPII adaptor protein TMED7 suppresses TLR4-mediated inflammatory signaling

Julia D Knopf et al. Nat Commun. .

Abstract

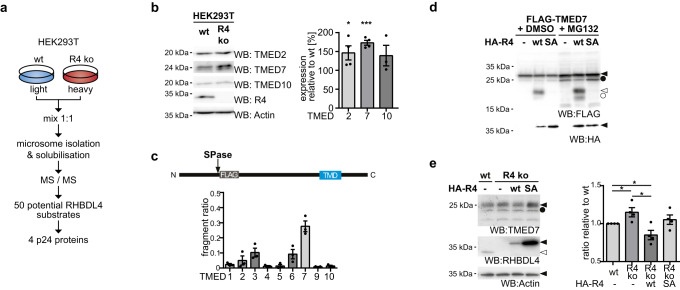
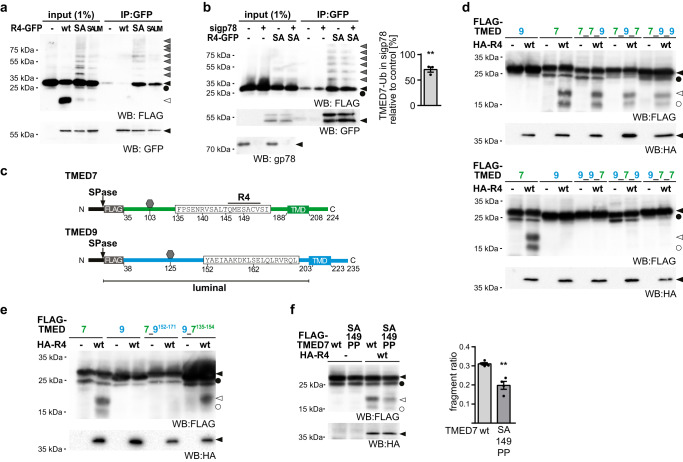
The toll-like receptor 4 (TLR4) is a central regulator of innate immunity that primarily recognizes bacterial lipopolysaccharide cell wall constituents to trigger cytokine secretion. We identify the intramembrane protease RHBDL4 as a negative regulator of TLR4 signaling. We show that RHBDL4 triggers degradation of TLR4's trafficking factor TMED7. This counteracts TLR4 transport to the cell surface. Notably, TLR4 activation mediates transcriptional upregulation of RHBDL4 thereby inducing a negative feedback loop to reduce TLR4 trafficking to the plasma membrane. This secretory cargo tuning mechanism prevents the over-activation of TLR4-dependent signaling in an in vitro Mycobacterium tuberculosis macrophage infection model and consequently alleviates septic shock in a mouse model. A hypomorphic RHBDL4 mutation linked to Kawasaki syndrome, an ill-defined inflammatory disorder in children, further supports the pathophysiological relevance of our findings. In this work, we identify an RHBDL4-mediated axis that acts as a rheostat to prevent over-activation of the TLR4 pathway.


Conflict of interest statement

The authors declare no competing interests.

Figures

Fig. 1
Fig. 1. RHBDL4 cleaves certain TMED/p24 proteins to trigger their degradation along the ERAD pathway.
a Experimental outline of the SILAC-based organelle proteomics using HEK293T wt and RHBDL4 knockout cells (R4 ko). b Western blot (WB) analysis of endogenous TMED2 (n = 4, p = 0.048), TMED7 (n = 4, p = <0.0001), and TMED10 (n = 3) in total cell lysates of HEK293T wt or R4 ko cells. Actin is used as a loading control for the TMED2 WB; signals for the other antibodies were obtained from separate WBs. Right panel, WB quantification (means ± SEM; *p < 0.05, ***p < 0.001, two-sided Student’s t test). c HEK293T cells were co-transfected with the indicated FLAG-tagged TMED7/p24 constructs and either vector control or HA-tagged RHBDL4. Relative cleavage efficiency was determined. See Supplementary Fig. 1B for representative WB (means ± SEM, n = 3). Above: Outline of FLAG-TMED constructs. SPase, site of predicted signal peptide cleavage; TMD, transmembrane domain. d RHBDL4 wt but not the SA active site mutant generates an N-terminal FLAG-tagged TMED7 cleavage fragment (open arrow) that is degraded by the proteasome, as shown by an increased steady-state level upon MG132 (2 µM) treatment compared to vehicle control (DMSO). Inhibition of the proteasome also stabilized deglycosylated full-length TMED7 (filled circle) and rhomboid-induced cleavage fragment (open circles) (n = 3). e Endogenous TMED7 level in HEK293 T-REx R4 ko cells increases when compared to HEK293 T-REx wt cells. Stably expressed HA-R4 wt but not SA active site mutant rescues the increase. Actin is used as a loading control. Lower panel, WB quantification (means ± SEM, n = 4; *p < 0.05, two-sided Student’s t test, wt vs. R4ko p = 0.0469, R4ko vs. R4ko wt p = 0.0129, wt vs. R4ko wt p = 0.0498). Source data are provided as a Source Data file.
Fig. 2
Fig. 2. RHBDL4 interacts with ubiquitinated TMED7 and cleavage is specified by the TMED7 luminal domain.
a HEK293T cells transiently transfected with FLAG-TMED7 and either empty vector (-), GFP-tagged RHBDL4 (R4-GFP) wt, the catalytically inactive SA mutant or the SA-UIM double mutant (SAUM) were lysed with Triton X-100 and subjected to GFP-specific immunoprecipitation (IP). Western blot (WB) analysis reveals increased co-purification of glycosylated (black arrow) and unglycosylated (circle) FLAG-TMED7, including several ubiquitinated forms (gray arrow) but not the 22-kDa cleavage fragment (open arrow) (n = 3). b HEK293T cells transfected with siRNA targeting either gp78 (sigp78) or with control siRNA (-) and either transiently transfected with FLAG-TMED7 and either empty vector (-) or the GFP-tagged RHBDL4 catalytically inactive SA mutant were lysed with Triton X-100 and subjected to GFP-specific IP. WB analysis reveals decreased co-purification of FLAG-TMED7. Quantification of ubiquitinated TMED7 in sigp78-treated cells relative to control is shown (means ± SEM, n = 3; **p < 0.01, two-sided Student’s t test, p = 0.0043). c Outline of FLAG-TMED7 highlighting the 20 amino acid-cleavage site-region. Below an outline of FLAG-TMED9, including the detailed sequence homologous to the displayed TMED7 sequence. Hexagon, position of N-linked glycan. SPase, site of predicted signal peptide cleavage; TMD, transmembrane domain. d HEK293T cells were transfected with either FLAG-TMED7, FLAG-TMED9 or chimera of the two. Chimera are labeled according to the following scheme, indicating the source protein for the respective part: luminal_TMD_cytoplasmic. In addition, for each substrate construct either empty vector (-) or HA-R4 was transfected. Cells were treated with MG132 (2 µM). Only for constructs with a TMED7 luminal domain a cleavage fragment (open arrow) becomes visible (n = 3). e Same experiment as in (d) with chimera constructs as indicated. Only for constructs containing the TMED7 amino acid sequence 135-154 a cleavage fragment (open arrow) becomes visible (n = 3). f HEK293T cells were transfected with either FLAG-TMED7 wt or a SA149PP mutant of TMED7 together with HA-R4 as indicated. Cleavage of FLAG-TMED7-SA149PP is reduced compared cleavage of wt FLAG-TMED7. Cells were treated with MG132 (2 µM), (means ± SEM, n = 4, **p < 0.01, two-sided Student’s t test, p = 0.0019). Source data are provided as a Source Data file.
Fig. 3
Fig. 3. Loss of RHBDL4 in THP-1 cells leads to TMED7 stabilization and consequently to increased TLR4 cell surface level and signaling.
a TMED7 expression is increased in THP-1 cells transfected with siRNA (si) targeting RHBDL4 (R4) relative to control siRNA (ctrl) as analyzed by western blot (WB) analysis. Actin is used as a loading control. Right panel, TMED7 quantification in siR4-treated cells relative to control (means ± SEM, n = 3; **p < 0.01, two-sided Student’s t test, p = 0.005). b TLR4 cell surface levels are increased in THP-1 cells transfected with siR4 compared to cells treated with sictrl. Cells have been stained with anti-TLR4-PE and analyzed by flow cytometry. Gray curve represents PE-coupled isotypic control (IgG). Representative histogram (left) and MFI ratio (right) of siR4-treated versus sictrl-treated cells. (means ± SEM, n = 4; *p < 0.05, two-sided Student’s t test, p = 0.0244). c THP-1 cells were transfected either with sictrl, siR4, siTMED7 or a combination of the latter two and treated with LPS (1 µg/ml) for 6 h. Normalized transcriptional levels of TNFα and IL-6 relative to LPS-treated cells. Both TNFα (n = 3) and IL-6 (n = 4) expression increases upon knockdown of RHBDL4 that depends on TMED7 expression (means ± SEM; **p < 0.01, two-sided Student’s t test, TNFαː sicon vs. siR4 p = 0.0038; IL-6: sicon vs. siR4 p = 0.0036, sicon vs. siTMED7 p = 0.0012). Source data are provided as a Source Data file.
Fig. 4
Fig. 4. Physiological consequence of RHBDL4 ablation.
a TMED7 expression is increased in BMDMs derived from RHBDL4 knockout (R4 ko) mice relative to cells derived from wt animals. Signal for TLR4 was obtained on a separate WB. Actin is used as a loading control. Right panel, quantification of TMED7 in R4 ko cells relative to control (means ± SEM, n = 4; *p < 0.05, two-sided Student’s t test, p = 0.0383). b Amount of TNFα (left) and IL-6 (right) determined by ELISA in the supernatant of wt and R4 ko BMDMs after LPS (100 ng/ml) treatment for 0, 6 (TNFα p = 0.0154, IL-6 p = 0.0419), 12 (TNFα p = 0.001, IL-6 p = 0.0093), and 24 h (TNFα p = 0.002, IL-6 p = 0.0003). Secretion of both cytokines is increased in cells derived from R4 ko mice compared to cells derived from wt mice (means ± SEM, n = 4 except for time points 0 h in wt animals and 24 h in R4 ko animals for IL-6 and timepoint 0 h for wt animals for TNFα that were n = 3; *p < 0.05, **p < 0.01, ***p < 0.001, two-sided Student’s t test). c Relative expression of TNFα in white blood cells from R4 ko mice is increased compared to cells derived from wt mice 150 min after injection of LPS (35 µg/g of body weight). TNFα expression has been normalized to and expressed as a ratio relative to expression in cells derived from wt mice (means ± SEM, n = 5 mice per condition; **p < 0.01, two-sided Student’s t test, p = 0.0092). d R4 ko mice show a decreased survival upon LPS injection (35 µg/g of body weight) when compared to wt mice (n = 12 mice per condition, p = 0.0054, Log-rank, Mantel-Cox test). e TNFα expression is increased in THP-1 cells upon transfection with siRNA targeting RHBDL4 (siR4) relative to control siRNA (sictrl) after infection with M. tuberculosis for 24 h (means ± SEM, n = 3, *p < 0.05, two-sided Student’s t test, p = 0.0132). f Amount of secreted TNFα determined by ELISA in the supernatant of THP-1 cells is increased in cells transfected with siRNA targeting RHBDL4 (siR4) relative to control siRNA (sictrl) upon infection with M. tuberculosis (+Mtb) for 24 h (means ± SEM, n = 3; *p < 0.05, two-sided Student’s t test, p = 0.0191). Source data are provided as a Source Data file.
Fig. 5
Fig. 5. Kawasaki disease-associated mutation causes accelerated degradation of RHBDL4 by a unique autocatalytic cleavage event in its first luminal loop.
a Homology model of RHBDL4’s rhomboid fold showing the position of the mutated isoleucine-165 facing the cytoplasmic surface in red. Membrane-embedded active site serine-144 and predicted main cleavage site region of the IT missense mutant are shown in green and yellow, respectively. Ribbon diagram was generated based on our previous homology model by PyMol Molecular Graphics System (v.2.2.0). b Endogenous TMED7 levels in HEK293 T-REx RHBDL4 knockout cells (R4 ko) do not change significantly when HA-tagged RHBDL4-IT (IT) was expressed when compared to the control (ctrl) contrary to expression of the RHBDL4 wt (wt) rescue construct. Actin is used as a loading control (see Fig. 1e, means ± SEM, n = 4; **p < 0.01, two-sided Student’s t test, ctrl vs. wt p = 0.0075). c Stability of HA-tagged RHBDL4-IT (HA-R4-IT) expressed in HEK293T cells is reduced compared to HA-tagged RHBDL4 wt (HA-R4-wt) when analyzed by cycloheximide (CHX) chase. Quantification of HA-tagged full-length RHBDL4 (means ± SEM, n = 5; ***p < 0.001, two-sided Student’s t test, p = 0.0009). See Supplementary Fig. 5B for representative WB. d HA-tagged RHBDL4 wt and RHBDL4-IT expressed in R4 ko HEK293T cells are autocatalytically cleaved whereas the active site RHBDL4-SA mutant and the RHBDL4-IT-SA double mutant are stable. Actin levels were analyzed on a separate WB. (n = 3). Source data are provided as a Source Data file.
Fig. 6
Fig. 6. Negative feedback regulation: TLR4 stimulation upregulates RHBDL4 expression.
a Relative mRNA expression of RHBDL4 and BiP in THP-1 cells after treatment with LPS (1 µg/ml) for the indicated time points. Expression was normalized and calculated as a ratio relative to untreated cells (means ± SEM, n = 4, ***p < 0.001, two-sided Student’s t test, 6 h R4: p = <0.0001, 12 h R4: p = <0.0001). b Same experiment as shown in (a) but with BMDMs treated with LPS (100 ng/ml) (means ± SEM, n = 4; **p < 0.01, ***p < 0.001, two-sided Student’s t test, 6 h BiP: p = <0.0001, 12 h BiP: p = 0.0005, 12 h R4: p = 0.0011). c RHBDL4 protein expression increases in BMDMs after treatment with LPS (100 ng/ml) for the indicated time points as assessed by western blot (WB) analysis. BiP expression was additionally monitored. Actin is used as a loading control. Right panel, quantification of RHBDL4 and BiP expression relative to untreated control (means ± SEM, n = 4; ***p < 0.001, two-sided Student’s t test, 12 h R4: p = 0.0003, 24 h R4: p = 0.0002). Source data are provided as a Source Data file.
Fig. 7
Fig. 7. Model of RHBDL4-mediated negative feedback regulation of TLR4 signaling.
RHBDL4-catalyzed cleavage induces downregulation of TMED7 by the ERAD pathway. Upon loss of RHBDL4, TMED7 accumulates and promotes the trafficking of TLR4 to the cell surface. Consequently, TLR4 downstream signaling is increased, resulting in enhanced cytokine secretion. As negative feedback, LPS-induced TLR4 signaling upregulates RHBDL4 expression by an unknown mechanism.

Similar articles

Cited by

References

    1. Gissen P, Maher ER. Cargos and genes: insights into vesicular transport from inherited human disease. J. Med. Genet. 2007;44:545–555. doi: 10.1136/jmg.2007.050294. - DOI - PMC - PubMed
    1. Sun Z, Brodsky JL. Protein quality control in the secretory pathway. J. Cell Biol. 2019;218:3171–3187. doi: 10.1083/jcb.201906047. - DOI - PMC - PubMed
    1. Lemberg MK, Strisovsky K. Maintenance of organellar protein homeostasis by ER-associated degradation and related mechanisms. Mol. Cell. 2021;81:2507–2519. doi: 10.1016/j.molcel.2021.05.004. - DOI - PubMed
    1. Christianson JC, Carvalho P. Order through destruction: how ER-associated protein degradation contributes to organelle homeostasis. EMBO J. 2022;41:e109845. doi: 10.15252/embj.2021109845. - DOI - PMC - PubMed
    1. Avci D, et al. The yeast ER-intramembrane protease Ypf1 refines nutrient sensing by regulating transporter abundance. Mol. Cell. 2014;56:630–640. doi: 10.1016/j.molcel.2014.10.012. - DOI - PubMed