. 2024 Mar 7;15(3):193.
doi: 10.1038/s41419-024-06579-9.

TREM2 deficiency impairs the energy metabolism of Schwann cells and exacerbates peripheral neurological deficits

Affiliations

TREM2 deficiency impairs the energy metabolism of Schwann cells and exacerbates peripheral neurological deficits

Nannan Zhang et al. Cell Death Dis. .

Abstract

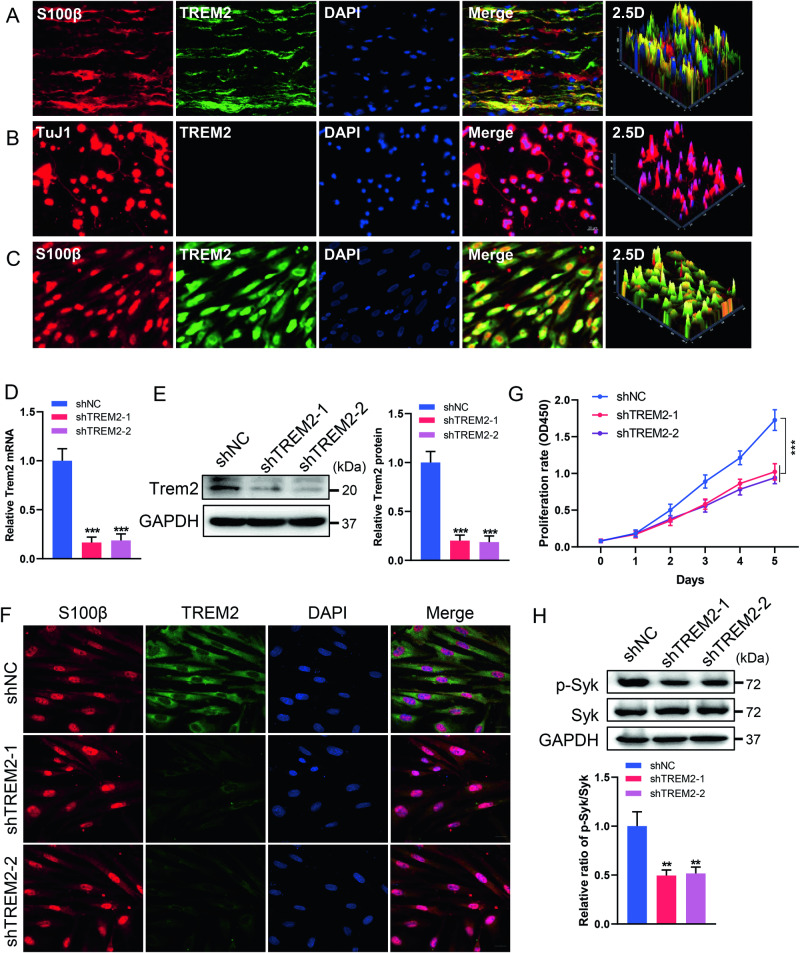
Triggering receptor expressed on myeloid cells-2 (TREM2) has been implicated in susceptibility to neurodegenerative disease. Schwann cells (SCs), the predominant glial cell type in the peripheral nervous system (PNS), play a crucial role in myelination, providing trophic support for neurons and nerve regeneration. However, the function of TREM2 in SCs has not been fully elucidated. Here, we found that TREM2 is expressed in SCs but not in neurons in the PNS. TREM2 deficiency leads to disruption of glycolytic flux and oxidative metabolism in SCs, impairing cell proliferation. The energy crisis caused by TREM2 deficiency triggers mitochondrial damage and autophagy by activating AMPK and impairing PI3K-AKT-mTOR signaling. Combined metabolomic analysis demonstrated that energic substrates and energy metabolic pathways were significantly impaired in TREM2-deficient SCs. Moreover, TREM2 deficiency impairs energy metabolism and axonal growth in sciatic nerve, accompanied by exacerbation of neurological deficits and suppression of nerve regeneration in a mouse model of acute motor axonal neuropathy. These results indicate that TREM2 is a critical regulator of energy metabolism in SCs and exerts neuroprotective effects on peripheral neuropathy. TREM2 deficiency impairs glycolysis and oxidative metabolism in Schwann cells, resulting in compromised cell proliferation. The energy crisis caused by TREM2 deficiency induces mitochondrial damage and autophagy by activating AMPK and impairing PI3K-AKT-mTOR signaling. Moreover, TREM2 deficiency disrupts the energy metabolism of the sciatic nerve and impairs support for axonal regeneration, accompanied by exacerbation of neurological deficits and suppression of nerve regeneration in a mouse model of acute motor axonal neuropathy (by FigDraw).


Conflict of interest statement

The authors declare no competing interests.

Figures

None
TREM2 deficiency impairs glycolysis and oxidative metabolism in Schwann cells, resulting in compromised cell proliferation. The energy crisis caused by TREM2 deficiency induces mitochondrial damage and autophagy by activating AMPK and impairing PI3K-AKT-mTOR signaling. Moreover, TREM2 deficiency disrupts the energy metabolism of the sciatic nerve and impairs support for axonal regeneration, accompanied by exacerbation of neurological deficits and suppression of nerve regeneration in a mouse model of acute motor axonal neuropathy (by FigDraw).
Fig. 1
Fig. 1. TREM2 deficiency impairs SC proliferation.
AC Immunostaining identified the localization of TREM2 in the sciatic nerve, primary neurons and primary SCs from C57BL/6 J mice. S100β- and TuJ1-positive immunostaining indicate SCs and neurons, respectively. Scale bar, 20 μm. DF The expression of TREM2 was knocked down by transfecting TREM2-specific shRNAs into primary SCs. Identification of the expression of TREM2 by qRT‒PCR (D), western blot (E) and immunofluorescence staining (F). Scale bar, 20 μm. n = 3. G Cell proliferation was determined by the Cell Counting Kit-8 assay. n = 4. H. Levels of phosphorylated (Tyr525/526) and total SYK in SCs were determined by western blot. n = 3. **p < 0.01, ***p < 0.001.
Fig. 2
Fig. 2. Detailed effects of TREM2 deficiency on the energy metabolism of SCs.
A Heatmap of differentially abundant metabolites induced by TREM2 deficiency in SCs according to energy metabolomics analysis. B Volcano map of the differentially abundant metabolites. C Quantification of the differentially abundant metabolites. D Kyoto Encyclopedia of Genes and Genomes (KEGG) enrichment pathway analysis based on the differentially abundant metabolites. E Summary of the metabolic pathways and targets affected by TREM2 deficiency in SCs. A schematic representation of the metabiotic pathways of glycolysis, the tricarboxylic acid (TCA) cycle, oxidative phosphorylation (OXPHOS) and purine/pyrimidine metabolism is shown. There were significantly fewer metabolites in TREM2-deficient SCs than in control SCs, as indicated in green. Glucose-6-P glucose-6-phosphate, Fructose-6-P fructose-6-phosphate, Fructose-1,6-P fructose-1,6-bisphosphatase, Glycerol-3-P glycerol-3-phosphate, DAD+ nicotinamide adenine dinucleotide, Acetyl-CoA acetoacetyl coenzyme A, GMP guanosine-5′-monophosphate, GDP guanosine-5′-monophosphate, GTP guanosine-5′-monophosphate, UMP uridine monophosphate, IMP inosine monophosphate, AMP adenosine monophosphate, ADP adenosine diphosphate, ATP adenosine triphosphate. **p < 0.01, ***p < 0.001.
Fig. 3
Fig. 3. TREM2 deficiency impairs SC glycolytic flux.
A The extracellular acidification rate (ECAR) of SCs was determined by Seahorse experiments. B Quantitative analysis of glycolysis, glycolytic capacity and glycolytic reserve in ECAR. n = 3. C Glucose uptake was measured by flow cytometry using 2-[N-(7-nitrobenz-2-oxa-1,3- diazol-4-yl)amino]-2-deoxy-D-glucose (2-NBDG). n = 4. Measurement of glycolytic products of glucose-6-phosphate (G6P) (D), pyruvate (E) and lactate (F) in SCs. n = 4. qRT‒PCR (G) and western blot (H) analysis of the expression levels of glycolysis-related genes in SCs, including glucose transporter 1/4 (GLUT)1/4, hexokinase 2 (HK2), 6-Phosphofructo-2-kinase/fructose-2,6-bisphosphatase 3 (PFKFB3), Pyruvate kinase 2 (PKM2) and lactate dehydrogenase A (LDHA). n = 4. I, J Representative immunofluorescence and quantification of glycolysis-related proteins in SCs. Scale bar, 20 μm. N = 4, n ≥ 10 fields/group. *p < 0.05, **p < 0.01, ***p < 0.001.
Fig. 4
Fig. 4. TREM2 deficiency impairs oxidative metabolism in SCs.
A The oxygen consumption rate (OCR) of SCs was determined by Seahorse experiments. B Quantitative analysis of basal respiration, ATP production, maximal respiration, and spare respiratory capacity in OCR. n = 3. C Measurement of ATP production by chemiluminescence. n = 4. D The levels of nicotinamide adenine dinucleotide (NAD+) and its ratio to NADH in SCs were determined by chemiluminescence. n = 4. E Measurement of mitochondrial DNA (mtDNA) copy number in SCs by qRT‒PCR. n = 3. qRT‒PCR (F) and western blot (G) analysis of the expression levels of mitochondrial electron transport chain (ETC) components in SCs, including mitochondrially encoded NADH dehydrogenase 2 (mt-ND2), succinate dehydrogenase complex flavoprotein subunit A (SDHA), mitochondrially encoded cytochrome b (mt-CYTB), mitochondrially encoded cytochrome C oxidase I (mt-CO1), and mitochondrially encoded ATP synthase alpha-subunit (mt-ATP5a1). CI, CII, CIII, CIV and CV represent mitochondrial ETC complexes I, II, III, IV and V, respectively. n = 3. qRT‒PCR (H) and western blot (I) analysis of the expression levels of transcription factor A (TFAM) in SCs. n = 3. J, K Representative immunofluorescence and quantification of mitochondrial electron transfer chain proteins and TFAM in SCs. Scale bar, 20 μm. N = 4, n ≥ 10 fields/group. *p < 0.05, **p < 0.01, ***p < 0.001.
Fig. 5
Fig. 5. TREM2 deficiency induces mitochondrial damage and autophagy.
A Representative fluorescence images of mitochondria in SCs stained with MitoTracker Green. Scale bars, 10 μm. B Quantification of mitochondrial intensity, indicating the number of mitochondria. N = 4, n ≥ 10 fields/group. CE Representative electron microscopy images and quantification of mitochondrial length and area in SCs. Scale bars, 1 μm. N = 6, n ≥ 10 fields/group. F Mitochondria were stained with MitoTracker Green and MitoSOX Red to evaluate the production of mitochondrial reactive oxygen species. G Quantification of MitoSOX Red fluorescence. Scale bars, 10 μm. N = 4, n ≥ 10 fields/group. H The mitochondrial membrane potential (MMP) in SCs was measured by JC-1 staining as an indicator of mitochondrial activity. JC-1 aggregates indicate a high MMP, while JC-1 monomers indicate a low MMP. Scale bars, 50 μm. I Quantification of the ratio of JC-1 aggregates/monomers. N = 4, n ≥ 10 fields/group. J Levels of phosphorylated (Tyr705) and total signal transductors and transcriptional activator 3 (STAT3) in SCs were determined by western blot. n = 3. K The levels of PTEN-induced putative kinase 1 (PINK1) and parkin and the LC3BII/LC3BI ratio in SCs were determined by western blot. n = 3. L Mitochondria and lysosomes were stained with MitoTracker Red and LysoTracker Green, respectively. Scale bars, 10 μm. M Quantification of LysoTracker Green fluorescence. N = 4, n ≥ 10 fields/group. N Levels of cleaved-caspase 3, total caspase 3, cleaved-caspase 9 and total caspase 9 were determined by western blot. n = 3. **p < 0.01, ***p < 0.001.
Fig. 6
Fig. 6. TREM2 deficiency activates AMPK and impairs PI3K-AKT-mTOR signaling.
A, B Levels of phosphorylated (Thr172) and total AMPK, phosphorylated (Tyr607) and total PI3K, phosphorylated (Ser473) and total AKT, phosphorylated (Ser2448) and total mTOR, and phosphorylated (Thr389/Thr412) and total p70S6K were determined by western blot. n = 3. C Levels of HIF-1α and c-MYC were determined by western blot. n = 3. DH TREM2-deficient SCs (shTREM2-1) were treated with 5 μM MHY1485, an mTOR activator. The expression of HIF-1α and c-MYC was determined by western blot (D). n = 3. Extracellular acidification rate (ECAR) and oxygen consumption rate (OCR) were determined by Seahorse experiments (E, G). Quantitative analysis of glycolysis, glycolytic capacity and glycolytic reserve in the ECAR (F) and basal respiration, ATP production, maximal respiration, and spare respiratory capacity in the OCR (H). n = 3. **p < 0.01, ***p < 0.001, compared with shNC; #p < 0.05, ##p < 0.01, compared with shTREM2-1.
Fig. 7
Fig. 7. mTOR activator rescued mitochondrial damage and autophagy caused by TREM2 deficiency.
TREM2-deficient SCs (shTREM2-1) were treated with the mTOR activator MHY1485 (5 μM). A, B Mitochondria were stained with MitoSOX Red and measured by immunofluorescence. Scale bars, 10 μm. N = 4, n ≥ 10 fields/group. C Mitochondria were stained with MitoSOX Red and measured by flow cytometry. n = 3. D The mitochondrial membrane potential (MMP) was measured by a JC-1 probe. Scale bars, 20 μm. E Quantification of the ratio of JC-1 aggregates/monomers. N = 4, n ≥ 10 fields/group. F The levels of PTEN-induced putative kinase 1 (PINK1) and parkin and the LC3BII/LC3BI ratio in SCs were determined by western blot. n = 3.G, H Lysosomes were stained with LysoTracker Green and measured by immunofluorescence. Scale bars, 10 μm. N = 4, n ≥ 10 fields/group. I Lysosomes were stained with LysoTracker Green and measured by flow cytometry. n = 3. J Levels of cleaved caspase 3, total caspase 3, cleaved caspase 9 and total caspase 9 were determined by western blot. n = 3. ***p < 0.001, compared with shNC; #p < 0.05, ##p < 0.01, compared with shTREM2-1.
Fig. 8
Fig. 8. TREM2 deficiency exacerbates PNS damage in a mouse model of AMAN.
A Schematic diagram of GD1a-IgG purification. B Schematic of the experimental process in the mouse model of AMAN. Negative control siRNA (siNC) or TREM2 siRNA (siTREM2) was injected in situ into the right sciatic nerve 3 days before surgery. Downregulated TREM2 expression was identified by western blot (C) and immunofluorescence staining (D). Scale bars, 20 μm. n = 3. E, F Electrophysiological tests were applied to evaluate nerve conduction in the sciatic nerve, and the complex muscle action potential (CMAP) amplitude and latency were quantified. n = 6. G, H Gait analysis was applied to evaluate motor function, and gait parameters and sciatic functional index were quantified. n = 6. I, J The right sciatic nerves were isolated and dissociated into a cell suspension. Extracellular acidification rate (ECAR) (I) and oxygen consumption rate (OCR) (J) were determined by Seahorse experiments. Quantitative analysis of glycolysis, glycolytic capacity and glycolytic reserve in the ECAR and basal respiration, ATP production, maximal respiration, and spare respiratory capacity in the OCR. n = 4. K The levels of PTEN-induced putative kinase 1 (PINK1) and parkin and the LC3BII/LC3BI ratio in sciatic nerves were determined by western blot. n = 3. LN Representative immunofluorescence and quantification of nerve growth factor receptor (NGFR), Neurofilament (NF) 200 and myelin basic protein (MBP) in sciatic nerves. Arrows indicate myelin debris. As indicated, TREM2 deficiency significantly impaired the clearance of myelin debris (arrows) and inhibited nerve regeneration. Scale bar, 20 μm. N = 6, n ≥ 6 fields/group. ns, not significant, *p < 0.05, **p < 0.01.

References

    1. Ulland TK, Colonna M. TREM2 - a key player in microglial biology and Alzheimer disease. Nat Rev Neurol. 2018;14:667–75. doi: 10.1038/s41582-018-0072-1. - DOI - PubMed
    1. Ulrich JD, Ulland TK, Colonna M, Holtzman DM. Elucidating the role of TREM2 in Alzheimer’s disease. Neuron. 2017;94:237–48. doi: 10.1016/j.neuron.2017.02.042. - DOI - PubMed
    1. Keren-Shaul H, Spinrad A, Weiner A, Matcovitch-Natan O, Dvir-Szternfeld R, Ulland TK, et al. A unique microglia type associated with restricting development of Alzheimer’s disease. Cell. 2017;169:1276–90.e17. doi: 10.1016/j.cell.2017.05.018. - DOI - PubMed
    1. Wang S, Sudan R, Peng V, Zhou Y, Du S, Yuede CM, et al. TREM2 drives microglia response to amyloid-β via SYK-dependent and -independent pathways. Cell. 2022;185:4153–69.e19. doi: 10.1016/j.cell.2022.09.033. - DOI - PMC - PubMed
    1. Peng Q, Malhotra S, Torchia JA, Kerr WG, Coggeshall KM, Humphrey MB. TREM2- and DAP12-dependent activation of PI3K requires DAP10 and is inhibited by SHIP1. Sci Signal. 2010;3:ra38. doi: 10.1126/scisignal.2000500. - DOI - PMC - PubMed

Publication types

MeSH terms

Substances