. 2024 Mar 7;15(1):2104.
doi: 10.1038/s41467-024-46270-3.

Malaria blood stage infection suppresses liver stage infection via host-induced interferons but not hepcidin

Affiliations

Malaria blood stage infection suppresses liver stage infection via host-induced interferons but not hepcidin

Hardik Patel et al. Nat Commun. .

Abstract

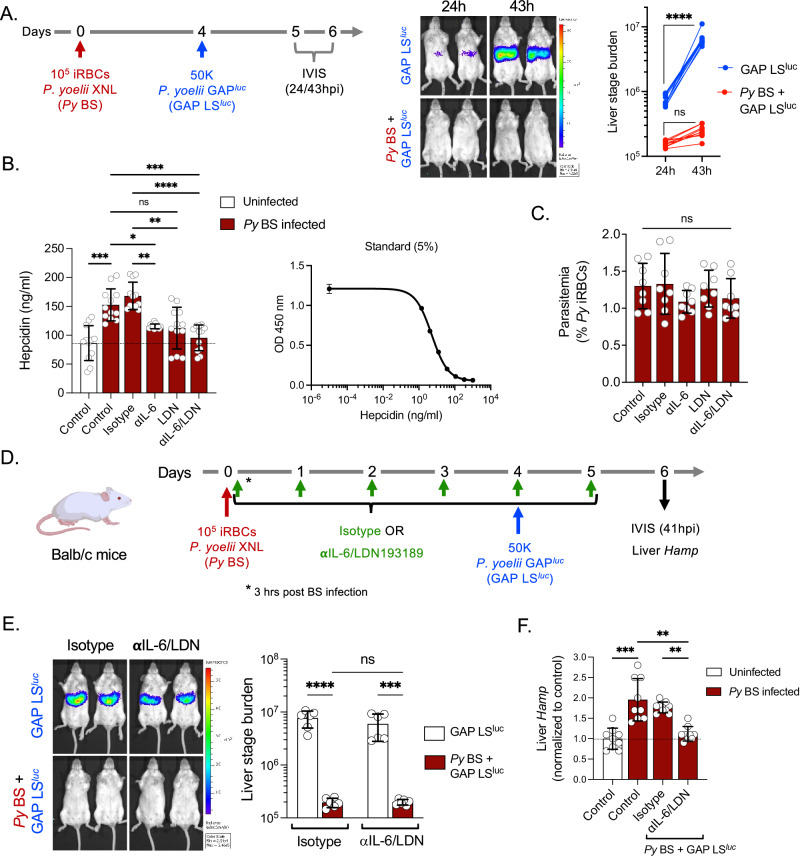
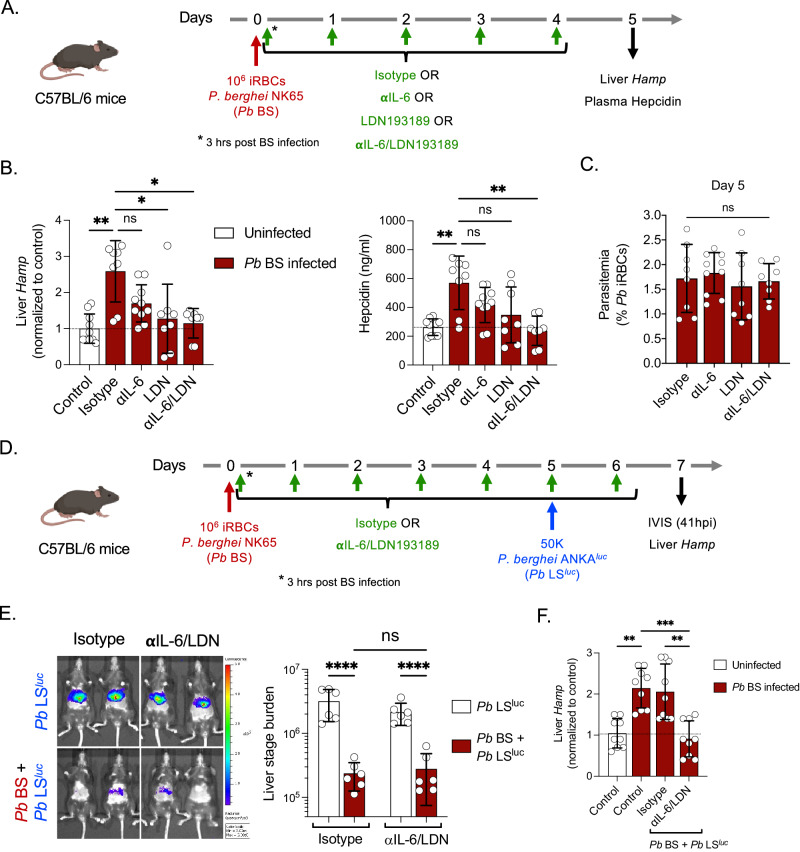
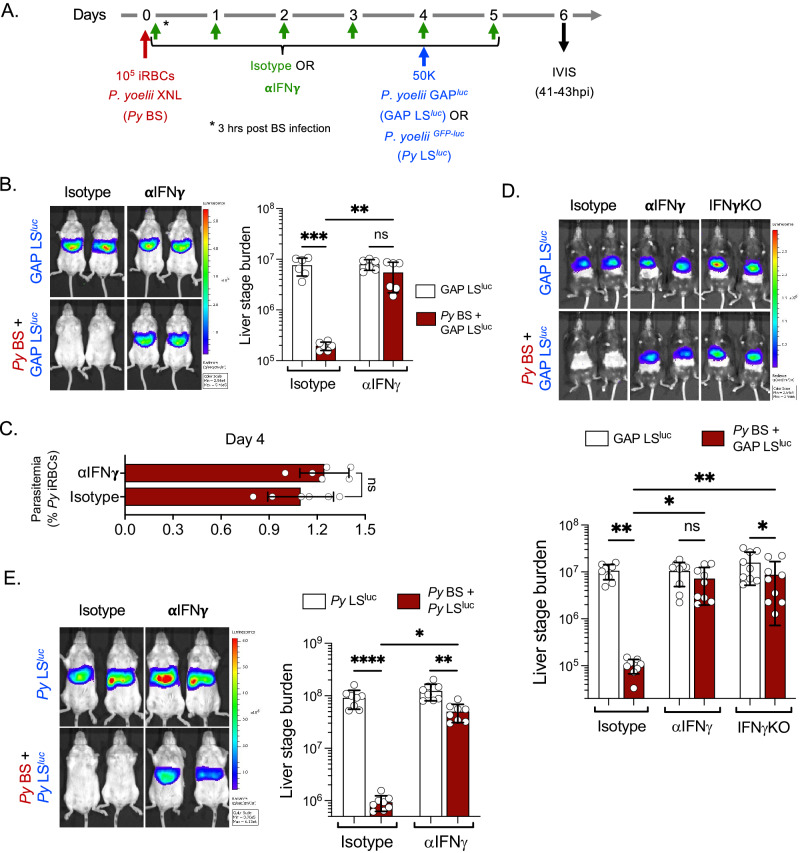
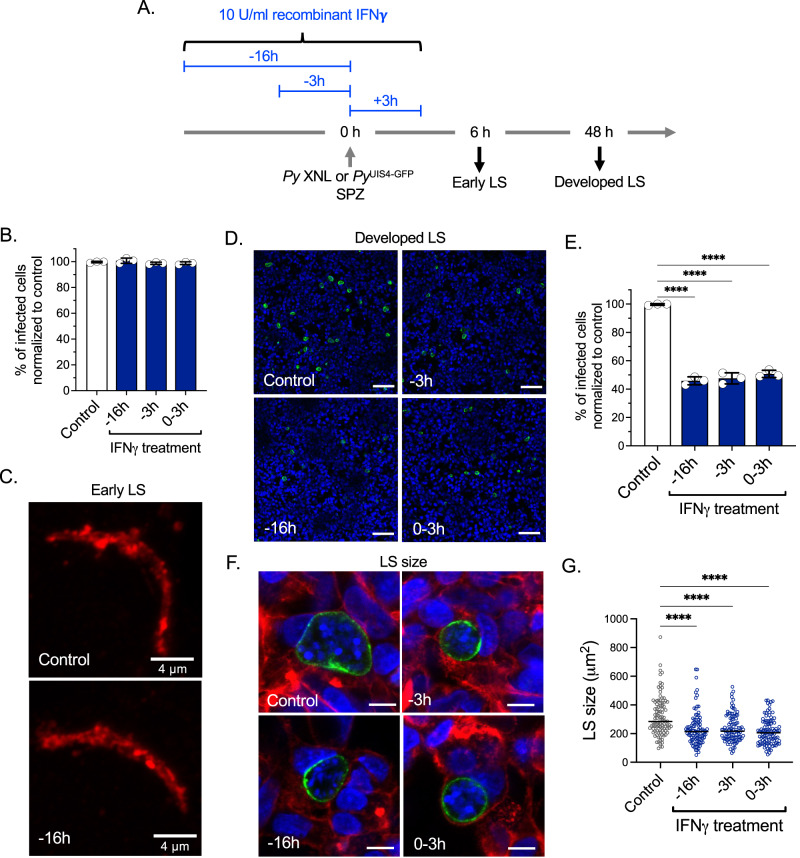
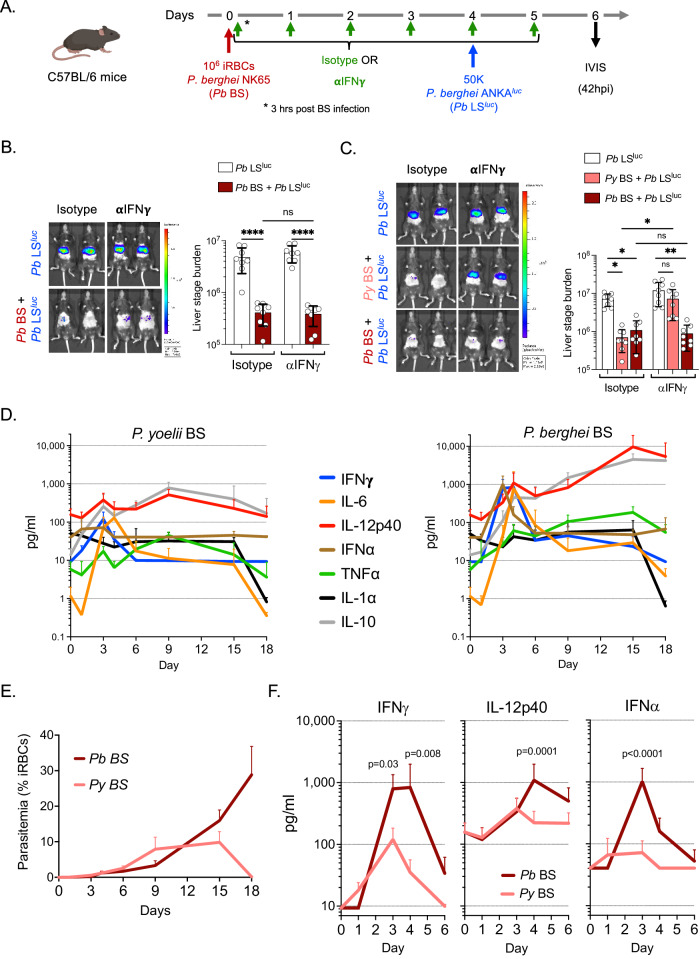
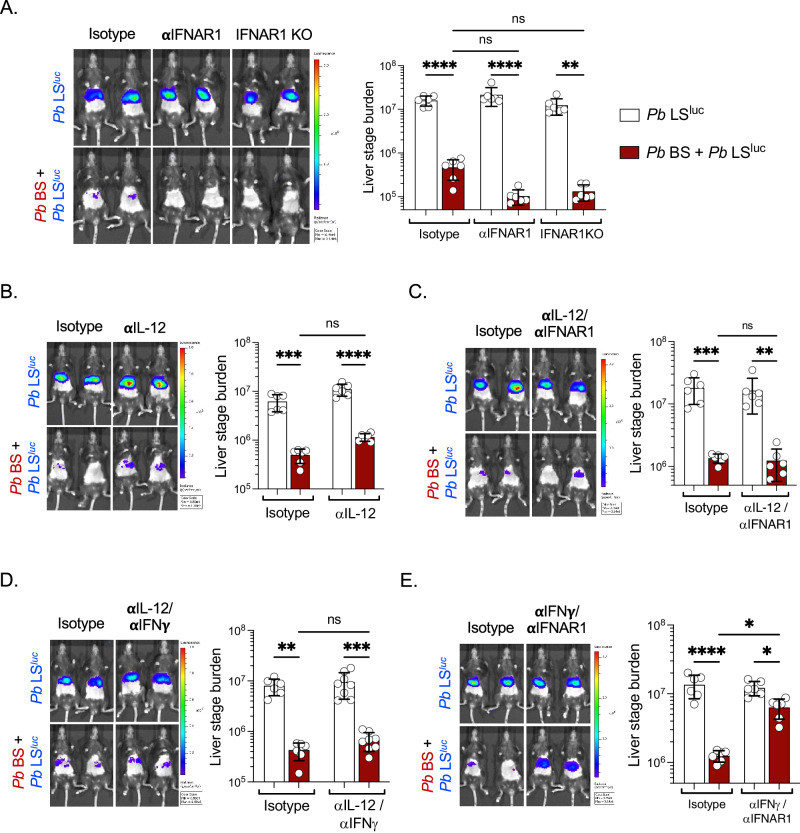
Malaria-causing Plasmodium parasites first replicate as liver stages (LS), which then seed symptomatic blood stage (BS) infection. Emerging evidence suggests that these stages impact each other via perturbation of host responses, and this influences the outcome of natural infection. We sought to understand whether the parasite stage interplay would affect live-attenuated whole parasite vaccination, since the efficacy of whole parasite vaccines strongly correlates with their extend of development in the liver. We thus investigated the impact of BS infection on LS development of genetically attenuated and wildtype parasites in female rodent malaria models and observed that for both, LS infection suffered severe suppression during concurrent BS infection. Strikingly and in contrast to previously published studies, we find that the BS-induced iron-regulating hormone hepcidin is not mediating suppression of LS development. Instead, we demonstrate that BS-induced host interferons are the main mediators of LS developmental suppression. The type of interferon involved depended on the BS-causing parasite species. Our study provides important mechanistic insights into the BS-mediated suppression of LS development. This has direct implications for understanding the outcomes of live-attenuated Plasmodium parasite vaccination in malaria-endemic areas and might impact the epidemiology of natural malaria infection.


Conflict of interest statement

The authors declare no competing interests.

Figures

Fig. 1
Fig. 1. P. yoelii blood stage infection-induced hepcidin does not suppress P. yoelii GAP liver stage development.
A Balb/c mice were infected with 105 Py XNL infected RBCs (iRBCs) and 4 days later were infected with 50,000 luciferase-expressing Py GAPluc sporozoites (Py BS + GAP LSluc). Control mice were infected with 50,000 Py GAPluc sporozoites without giving prior BS infection (GAP LSluc). Parasite liver stage burden was measured through bioluminescence by IVIS at 24 and 43 h post sporozoite infection (hpi) and represented as total flux (p/s). n = 10 mice per group. ****P < 0.0001. B Balb/c mice were infected with 105 Py XNL iRBCs and were treated with isotype, anti-IL-6 monoclonal antibodies, LDN193189 inhibitor, or anti-IL-6/LDN193189 inhibitor in combination every day starting from day 0 (3 h after inoculation with iRBCs) until day 4. Blood was collected on day 4 and circulating hepcidin was measured by ELISA in uninfected and Py BS-infected Balb/c mice. n = 12 mice per group. *P = 0.04, **P = 0.003, ***P < 0.001, ****P < 0.0001. C The parasitemia was determined by counting of Py infected RBCs (% Py iRBCs) in Giemsa-stained thin blood smears. n = 8 mice per group. D Experimental layout. Control (GAP LSluc) and Py BS-infected (Py BS + GAP LSluc) mice were treated with isotype or anti-IL-6/LDN193189 inhibitor and were infected with 50,000 Py GAPluc sporozoites on day 4 post BS infection. E Parasite stage burden by IVIS (n = 6 mice per group) ***P = 0.0006, ****P < 0.0001. F relative hepcidin expression (Hamp) by qPCR were measured at 41 h after sporozoite infection. n = 9 mice per group. **P = 0.004, ***P = 0.0006. A, E Two-way ANOVA with Tukey’s multiple comparison test for comparing groups with two variables. B, C, F Kruskal–Wallis test followed by Dunn’s multiple comparison test. Results are combined and represented as means ± SD from three (A, B, F) or two (C, E) independent experiments. Source data are provided as a Source data file. The graphical illustration of the mouse in (D) was made using BioRender.com.
Fig. 2
Fig. 2. P. berghei blood stage infection-induced hepcidin does not suppress P. berghei liver stage development.
A Experimental layout. C57BL/6 mice were infected with 106 Pb NK65 iRBCs and treated with isotype, anti-IL-6 monoclonal antibodies, LDN193189 inhibitor, or anti-IL-6/LDN193189 inhibitor in combination every day starting from day 0 (3 h after inoculation with infected RBCs) until day 4. The liver and blood were collected on day 5. B The Hamp gene expression in the liver (left panel) and circulating hepcidin in the blood (right panel) were measured by qPCR and ELISA, respectively. n = 8–10 mice per group. *P < 0.05, **P < 0.01. C Blood stage parasitemia was determined by counting of Pb infected RBCs (% Pb iRBCs) in Giemsa-stained thin blood smears. n = 8–10 mice per group. D Experimental layout. Control (Pb LSluc) and Pb BS-infected (Pb BS + Pb LSluc) mice were treated with isotype or anti-IL-6/LDN193189 inhibitor and were infected with 50,000 Pb ANKAluc sporozoites on day 5 post BS infection. E Parasite stage burden by IVIS (n = 6 mice per group). ****P < 0.0001. F Relative hepcidin expression (Hamp) by qPCR were measured at 41 h after sporozoite injection. n = 9 mice per group. **P < 0.01, ***P = 0.0007. B, C, F Kruskal–Wallis test followed by Dunn’s multiple comparison test. E Two-way ANOVA with Tukey’s multiple comparison test for comparing groups with two variables. Results are combined and represented as means ± SD from three (B, F) or two (C, E) independent experiments. Source data are provided as a Source data file. The graphical illustration of the mouse in (A) and (D) was made using BioRender.com.
Fig. 3
Fig. 3. P. yoelii blood stage infection-induced IFNγ suppresses liver stage development.
A Experimental layout. Control (LSluc) and Py BS-infected (Py BS + LSluc) mice were treated with Isotype or anti-IFNγ antibodies as shown in the scheme and were infected with 50,000 Py GAPluc or wild-type PyGFP-luc sporozoites on day 4 post BS infection. B Parasite liver stage burden measured in Balb/c mice by IVIS at 41 h after Py GAPluc sporozoite infection and represented as total flux (p/s). n = 6 mice per group. **P = 0.005, ***P = 0.0002. C Blood stage parasitemia measured in Balb/c mice on day 4 post Py BS infection. n = 6 mice per group. D Parasite liver stage burden measured in C57BL/6 and IFNγ-/- mice by IVIS at 41 h after Py GAPluc sporozoite infection and represented as total flux (p/s). n = 9 mice per group. *P < 0.05, **P < 0.01. E Parasite liver stage burden in Balb/c mice was measured by IVIS at 43 h after wild-type PyGFP-luc sporozoites infection. n = 6 mice per group. *P = 0.01, **P = 0.002, ****P < 0.0001. B, D, E Two-way ANOVA with Tukey’s multiple comparison test for comparing groups with two variables. C Two-sided non-parametric Mann–Whitney U-test. Results are combined and represented as means ± SD from two (B, C, E) or three (D) independent experiments. Source data are provided as a Source data file.
Fig. 4
Fig. 4. IFNγ does not affect early phases of hepatocyte infection but suppresses LS development.
A Experimental layout. HepG2-CD81 hepatoma cells were treated with 10 U/ml human recombinant IFNγ at 16 h, or 3 h pre-infection or during Py or PyUIS4-GFP sporozoite addition to the cells for up to 3 h post infection (hpi). The suppressive effect of IFNγ was determined at 6 hpi (early LS), which encompasses sporozoite invasion of hepatocytes and transformation of intracellular sporozoites into LS trophozoites and 48 hpi, which measures near full LS development. B, C The number of infected cells between control and IFNγ treated groups at 6 hpi (early LS) determined by UIS4 staining. Scale bar, 4 μm. n = 3 independent experiments per group. D, E Quantification of UIS4-GFP positive infected cells between control and IFNγ treated groups at 48 hpi (developed LS) determined by live imaging after staining with Hoechst 33342. Scale bar, 100 μm. n = 3 independent experiments per group. ****P < 0.0001. F, G Quantification of LS size at 48 hpi by measuring area of UIS4-GFP after staining with Phalloidin rhodamine and Hoechst 33342. Scale bar, 10 μm. n = 100 Py LS count per group. ****P < 0.0001. B, E, G One-way ANOVA with Tukey’s multiple comparison test. Results are combined and represented as means ± SD from three independent experiments (BE) or represented from one of the three independent experiments with similar results obtained (F, G). Source data are provided as a Source data file.
Fig. 5
Fig. 5. P. yoelii blood stage and P. berghei blood stage infections provoke distinct host responses that suppress liver stage development.
A Experimental layout. Control (Pb LSluc) and Pb NK65 BS-infected (Pb BS + Pb LSluc) C57BL/6 mice were treated with isotype or anti-IFNγ and 4 days later were infected with 50,000 Pb ANKAluc sporozoites. B Parasite liver stage burden was measured by IVIS at 42 hpi and represented as total flux (p/s). n = 8 mice per group. ****P < 0.0001. C Control (Pb LSluc) and mice infected with 106 Py XNL iRBCs (Py BS + Pb LSluc; pink bars) or Pb NK65 iRBCs (Pb BS + Pb LSluc; dark red bars) were treated with isotype or anti-IFNγ as described above and four days later were infected with 50,000 Pb ANKAluc sporozoites. Parasite liver stage burden was measured by IVIS at 43 hpi. n = 8 mice per group. *P < 0.05, **P = 0.003. D C57BL6 mice were infected with 106 Py XNL or Pb NK65 iRBCs. Blood was collected at different time points during the course of infection and subjected to comparative cytokine kinetic analysis by LEGENDplex multi-analyte flow assay. The expression of the cytokines was represented as pg/ml. n = 6 mice per group. E Blood stage parasitemia during the course of Py or Pb BS infection in C57BL/6 mice. n = 6 mice per group. F Comparison of the expression of IFNγ, IL-12, or IFNα between Py or Pb BS infection. n = 6 mice per group. B, C Two-way ANOVA with Tukey’s multiple comparison test for comparing groups with two variables. F Two-way ANOVA with Šídák’s multiple comparison test for comparing individual time points between the groups. Results are combined and represented as means ± SD from two independent experiments. Source data are provided as a Source data file. The graphical illustration of the mouse in (A) was made using BioRender.com.
Fig. 6
Fig. 6. P. berghei blood stage infection suppresses liver stage development via both type I and II interferons.
Wild type or IFNAR1-/- C57BL/6 mice were infected with 106 Pb NK65 iRBCs (Pb BS + Pb LSluc). Pb BS-infected and Control (Pb LSluc) mice were treated with isotype controls or A anti-IFNAR1 (n = 6 mice per group; **P = 0.001, ****P < 0.0001), B anti-IL-12 (n = 6 mice per group; ***P = 0.0003, ****P < 0.0001), C anti-IL-12/anti-IFNAR1 (n = 6 mice per group; **P = 0.002, ***P = 0.0009), D anti-IL-12/anti-IFNγ (n = 6–8 mice per group; **P = 0.001, ***P = 0.0003), or E anti-IFNγ/anti-IFNAR1 (n = 6 mice per group; *P < 0.05, ****P < 0.0001) monoclonal antibodies. Four days later, the mice were infected with 50,000 Pb ANKAluc sporozoites. Parasite liver stage burden was measured by IVIS at 42–43 hpi and represented as total flux (p/s). Two-way ANOVA with Tukey’s multiple comparison test for comparing groups with two variables. Results are combined and represented as means ± SD from two independent experiments. Source data are provided as a Source data file.

Similar articles

Cited by

References

    1. Organization W. H. World Malaria Report 2021 (World Health Organisation, 2021).
    1. Chora, Â. F., Mota, M. M. & Prudêncio, M. The reciprocal influence of the liver and blood stages of the malaria parasite’s life cycle. Int. J. Parasitol. 52, 711–715 (2022). - PubMed
    1. Sato Y, Ries S, Stenzel W, Fillatreau S, Matuschewski K. The liver-stage plasmodium infection is a critical checkpoint for development of experimental cerebral malaria. Front Immunol. 2019;10:2554. doi: 10.3389/fimmu.2019.02554. - DOI - PMC - PubMed
    1. Chora ÂF, et al. Interplay between liver and blood stages of Plasmodium infection dictates malaria severity via γδ T cells and IL-17-promoted stress erythropoiesis. Immunity. 2023;56:592–605.e598. doi: 10.1016/j.immuni.2023.01.031. - DOI - PubMed
    1. Portugal S, et al. Host-mediated regulation of superinfection in malaria. Nat. Med. 2011;17:732–737. doi: 10.1038/nm.2368. - DOI - PMC - PubMed