. 2024 Mar 7;15(1):2093.
doi: 10.1038/s41467-024-46381-x.

Canonical and non-canonical integrin-based adhesions dynamically interconvert

Affiliations

Canonical and non-canonical integrin-based adhesions dynamically interconvert

Fabian Lukas et al. Nat Commun. .

Abstract

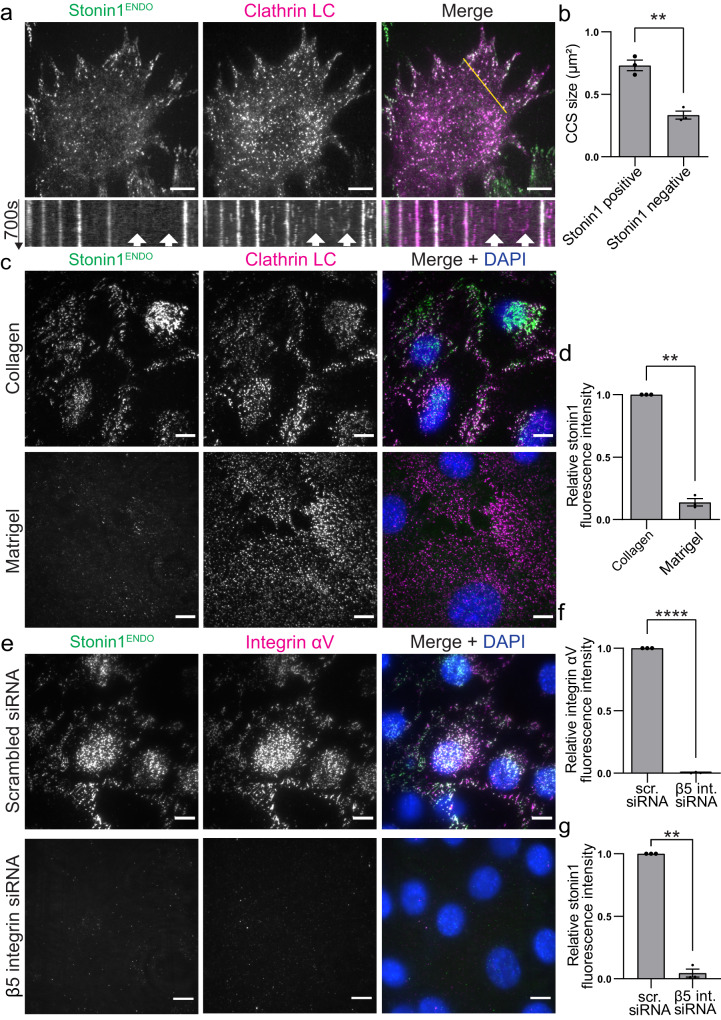
Adhesions are critical for anchoring cells in their environment, as signaling platforms and for cell migration. In line with these diverse functions different types of cell-matrix adhesions have been described. Best-studied are the canonical integrin-based focal adhesions. In addition, non-canonical integrin adhesions lacking focal adhesion proteins have been discovered. These include reticular adhesions also known as clathrin plaques or flat clathrin lattices, that are enriched in clathrin and other endocytic proteins, as well as extensive adhesion networks and retraction fibers. How these different adhesion types that share a common integrin backbone are related and whether they can interconvert is unknown. Here, we identify the protein stonin1 as a marker for non-canonical αVβ5 integrin-based adhesions and demonstrate by live cell imaging that canonical and non-canonical adhesions can reciprocally interconvert by the selective exchange of components on a stable αVβ5 integrin scaffold. Hence, non-canonical adhesions can serve as points of origin for the generation of canonical focal adhesions.


Conflict of interest statement

The authors declare no competing interests.

Figures

Fig. 1
Fig. 1. Non-canonical αVβ5 adhesions are characterized by the presence of stonin1.
a Illustration of the different types of αVβ5 integrin-positive canonical and non-canonical adhesion structures in a migrating mesenchymal cell. b–d C2C12 myoblasts, cultured for different times on vitronectin (i: 24 h, ii: 96 h, iii: 10 days, iv: 96 h) to promote the biogenesis of diverse types of adhesions (i-iv), were immunolabeled for αV integrin in combination with paxillin (b) as canonical focal adhesion marker, AP2 (c) as RA/plaque component and stonin1 (d) as marker for the entire range of paxillin-negative αV integrin-positive adhesions. Scale bar, 10 µm. Insets are shown enlarged as split colour channels (depicted in white) and merged view. RAs, reticular adhesions; mig., migratory. e–g C2C12 cells, cultured on collagen for 72 h, were immunolabeled for αV integrin in combination with vinculin as canonical focal adhesion marker and stonin1 to show anti-correlation of vinculin- and stonin1-positive αV integrin structures. Scale bars, 10 µm. f Magnification of insets from (e). g Analysis of stonin1 colocalization with αV integrin and vinculin based on Pearson´s correlation coefficient R. Negative values denote anti-correlation (mean±SEM; N = 3 independent experiments, two-tailed unpaired Student´s t-test, ****p < 0.0001). Source data are provided as a Source Data file.
Fig. 2
Fig. 2. Stonin1 localizes in integrin αVβ5-dependent manner to non-canonical adhesions while being absent from endocytic structures.
a Stonin1 accumulates with clathrin in long-lived clathrin plaques, but not in short-lived endocytic clathrin-coated pits. C2C12 cells expressing endogenously tagged EGFP-stonin1 and stably transduced with mRFP-clathrin light chain (LC) were imaged live. The yellow line depicts the position chosen for the kymographs depicted below the still images. Scale bar, 10 µm. b Quantification of the respective sizes of stonin1-positive and stonin1-negative clathrin-coated structures (CCS) reveals predominant presence of stonin1 in larger clathrin structures i.e. RAs/plaques (mean±SEM, N = 3 independent experiments, two-tailed unpaired Student´s t-test, **p = 0.0017). c Stonin1 localization depends on the presence of non-canonical integrin adhesions rather than clathrin-coated pits. C2C12 cells expressing endogenously tagged EGFP-stonin1 and co-transfected with mRFP-clathrin LC were seeded for 24 h on collagen which promotes non-canonical adhesion formation or Matrigel which suppresses their formation. Even though clathrin-coated pits remain on Matrigel, stonin1 localization is lost. Scale bar, 10 µm. d Quantification of stonin1 fluorescence intensity in cells on Matrigel relative to its level in cells on collagen (mean±SEM, N = 3 independent experiments, One sample t-test, **p = 0.0012). e Stonin1 localization depends on the presence of αVβ5 integrin. C2C12 cells expressing endogenously tagged EGFP-stonin1 and treated with β5 integrin-specific or scrambled control siRNA were seeded on collagen for 24 h. Fixed cells were immunolabeled for αV integrin and EGFP. Nuclei were stained with DAPI. Scale bar, 10 µm. f, g Quantification of αV integrin (f) and stonin1 (g) fluorescence intensity in β5 integrin depleted (β5 int siRNA) cells relative to control (scr siRNA) cells (mean±SEM, N=3 independent experiments, One sample t-test, **p = 0.0011,****p < 0.0001). Source data are provided as a Source Data file.
Fig. 3
Fig. 3. αVβ5/stonin1-positive networks are not identical to RAs/plaques.
a αV integrin-positive adhesion networks show a large overlap with stonin1, but only a limited, mostly punctate co-localization with endocytic markers including clathrin. C2C12 cells expressing endogenously tagged EGFP-stonin1 were grown on collagen for 72 h, fixed and immunolabeled with antibodies against EGFP and the proteins indicated on top of the images. Scale bars, 10 µm. b Quantification of co-localization of stonin1 as αV integrin adhesion network marker with endocytic and focal adhesion proteins using the Mander’s coefficient (mean±SEM, N = 3 independent experiments, One-way ANOVA with Dunnett´s multiple comparison test, ***p = 0.0001, **** p< 0.0001). c In contrast to αVβ5 integrin and stonin1, clathrin is a much more short-lived component of αVβ5 adhesion networks. C2C12 cells endogenously expressing EGFP-stonin1 and stably transfected with mRFP-clathrin light chain and β5 integrin-iRFP were seeded on collagen for 24 h and analyzed by live cell TIRF microscopy. Scale bars, 10 µm. d 3 h kymographs along the yellow line indicated in (c) reveal co-localizing long-lived stonin1 and β5 integrin structures in contrast to partially co-localizing much shorter-lived clathrin structures. e Remodeling of external RAs/plaques during mitosis entails loss of clathrin. C2C12 cells expressing endogenously tagged EGFP-stonin1 were stably transfected with mRFP-clathrin light chain (LC) and β5 integrin-iRFP and subjected to TIRF live cell microscopy. Scale bars, 10 µm. See also Movie 1. f 370 min kymographs along the yellow line indicated in (e) reveal loss of clathrin from αVβ5 integrin scaffolds anchoring mitotic retraction fibers during mitotic cell rounding. Source data are provided as a Source Data file.
Fig. 4
Fig. 4. αVβ5 integrin networks overlap only to a small extent with flat clathrin lattices.
C2C12 cells endogenously expressing EGFP-stonin1 and stably transduced with β5 integrin-iRFP were grown for 48 h on collagen and subjected to correlated light and electron microscopy after unroofing. a Example overview images. The white box in the fluorescence image represents the area observed by PREM. Scale bar, 10 µm. b Percentage of stonin1-positive adhesion network area that is positive for clathrin. The analysis comprised 617 stonin1-positive areas of which 133 were positive for clathrin. They were taken from 8 plasma membrane regions from four unroofed cells that were processed in 2 independent experiments. c Distribution of detected clathrin structures within stonin1-positive adhesion networks in the categories: flat clathrin lattices, dome-shaped clathrin cages and clathrin-coated endocytic pits. d Size distribution of clathrin structures detected within stonin1-positive adhesion networks (mean±SD, n = 76 clathrin structures from 2 independent experiments). e Example of frequent clathrin-free areas at sites of αVβ5/stonin1-positive adhesion network. Scale bar, 250 nm. f Example of rare flat clathrin lattice co-residing with αVβ5 integrin and stonin1. Scale bar, 300 nm. Source data are provided as a Source Data file.
Fig. 5
Fig. 5. Conversion of focal adhesions into non-canonical αVβ5 integrin adhesions.
a Scheme of how RAs/plaques can arise during focal adhesion disassembly by recycling of the existing αVβ5 scaffold. b C2C12 cells expressing genome-edited EGFP-stonin1 and stably transfected with β5 integrin-iRFP, eBFP2-paxillin and mRFP-clathrin light chain were cultured for 48 h and subjected to confocal live cell imaging. Still images showing a representative disassembling focal adhesion converting into an RA/plaque by losing paxillin and acquiring stonin1, and kymograph (along yellow line) of focal adhesion to RA/plaque conversion. Scale bar, 2 µm. c, d C2C12 cells expressing genome-edited EGFP-stonin1 and transiently transfected with β5 integrin-iRFP and mCherry-paxillin were cultured for 48 h and subjected to TIRF microscopy. c Still images showing a representative disassembling focal adhesion converting into an RA/plaque by losing paxillin and acquiring stonin1 (scale bar, 10 µm). See also Movie 2. Scale bar, 2 µm. d Quantification of relative fluorescence profiles of indicated proteins within β5 integrin-positive adhesions over the course of 110 min (mean±SEM, n = 36 adhesions). The highest fluorescence value for each imaged protein was set to 1 and all other fluorescence values of the same protein expressed relative to it. e–f Migratory retraction fibers can be generated from focal adhesions via loss of focal adhesion proteins and parallel stonin1 recruitment. C2C12 cells expressing genome-edited EGFP-stonin1 and stably transfected with eBFP2-paxillin and mCherry-F-tractin were grown for 48 h and subjected to confocal live-cell imaging. e Overview image of cell extending retraction fibers at 0 min and 24 min. Scale bars, 10 µm. f Magnification of insets showing retraction of paxillin towards cell body and replacement by stonin1 resulting in a paxillin-negative retraction fiber, and kymograph (along yellow line) of focal adhesion-to-retraction fiber conversion. Scale bar, 2 µm. Source data are provided as a Source Data file.
Fig. 6
Fig. 6. Conversion of non-canonical αVβ5 integrin adhesions into focal adhesions.
a Scheme of how focal adhesions can arise from non-canonical αVβ5 integrin adhesions by recruiting focal adhesion proteins. b–c Focal adhesions assemble at β5 integrin-positive migratory retraction fibers. C2C12 cells stably expressing EBFP2-paxillin, mCherry-F-tractin and β5 integrin-iRFP were grown for 48 h and subjected to confocal live-cell imaging. b Representative images, scale bars, 10 µm. Magnification of grey inset at 0 min shows paxillin-negative β5 integrin-positive retraction fibers left behind by migrating cell. Magnification of inset at 30 min shows recruitment of focal adhesion marker paxillin to β5 integrin scaffold upon cellular respreading across retraction fiber. See also Movie 3. c Quantification of normalized fluorescence profile of EBFP2-paxillin and integrin β5-iRFP within the β5 integrin mask shown in (b) over time (mean±SEM, 15 adhesions from N=3 independent experiments). The highest fluorescence value for each imaged protein over the time course was set to 100%, and all other fluorescence values of the same protein were expressed relative to it. d,e Focal adhesions assemble at β5 integrin-positive mitotic RAs/plaques. C2C12 cells stably expressing EBFP2-paxillin and β5 integrin-iRFP were grown for 48 h and subjected to confocal live cell imaging. d Magnified insets at 0 min show β5 integrin-positive mitotic RAs/plaques of a cell in cytokinesis which has disassembled its focal adhesions. Magnified insets at 65 min show recruitment of focal adhesion marker paxillin to former mitotic RAs/plaques converting them into focal adhesions. Scale bars, 10 µm. See also Movie 4. e Normalized intensity profile (along the yellow line depicted in (d)) of EBFP2-paxillin and β5 integrin-iRFP at cytokinesis (0 min) and during respreading (65 min). The highest fluorescence value for each imaged protein along the line and across both time points was set to 100%, and all other fluorescence values of the same protein were expressed relative to it. Scale bars, 10 μm. f–h Focal adhesions can assemble internally at αVβ5 integrin adhesion networks. f Scheme illustrating experiment. g C2C12 cells endogenously expressing EGFP-stonin1 were seeded on collagen to promote αVβ5 integrin network formation or on Matrigel to suppress it. Cells were treated for 1 h with blebbistatin to disassemble focal adhesions. After 30 min of blebbistatin washout, cells were fixed, immunolabeled for EGFP and paxillin and analyzed by TIRF microscopy. Nuclei were stained with DAPI. Scale bars, 10 μm. Focal adhesions can be seen to form internally at sites of αVβ5 integrin adhesion networks. In absence of αVβ5 integrin adhesion networks, focal adhesion formation is observed in the cell periphery, but hardly centrally. h Quantifcation of segmented paxillin puncta with a pixel intensity >10 in the area outlined by DAPI (mean±SEM, N = 3 independent experiments, two-tailed unpaired Student´s t-test, **p < 0.01). Source data are provided as a Source Data file.
Fig. 7
Fig. 7. β5 integrin molecules display low turnover within adhesions in comparison to the quickly exchanging stonin1 proteins.
(a) C2C12 cells expressing genome-edited EGFP-stonin1 and β5 integrin-mScarlet3 were transduced with iRFP-paxillin and cultured for 48 h. Scale bar, 10 µm. Parts of large stonin1- and β5 integrin-positive adhesion networks (example in d) and areas comprising paxillin- and β5 integrin-positive focal adhesions (example in e) were photobleached, and the fluorescence recovery after photobleaching (FRAP) of EGFP-stonin1 and β5 integrin-mScarlet3 was monitored for 40 min (b). c Quantification of the recovered, that is, mobile fraction of EGFP-stonin1 and β5 integrin-mScarlet3 molecules based on an exponential fit of the FRAP data reveals a low mobile pool for the β5 integrin scaffold in comparison to the accessory protein stonin1 b, c mean±SEM, N = 3 independent experiments with each comprising three movies capturing two cells where one canonical and one non-canonical adhesion per cell was photobleached; c One-Way ANOVA with Tukey´s multiple comparison test, ****p < 0.0001; ns, nonsignificant). Source data are provided as a Source Data file.

Similar articles

Cited by

References

    1. Lock JG, et al. Clathrin-containing adhesion complexes. J. Cell Biol. 2019;218:2086–2095. doi: 10.1083/jcb.201811160. - DOI - PMC - PubMed
    1. Campbell ID, Humphries MJ. Integrin structure, activation, and interactions. Cold Spring Harb. Perspect. Biol. 2011;3:a004994. doi: 10.1101/cshperspect.a004994. - DOI - PMC - PubMed
    1. Hynes RO. Integrins: bidirectional, allosteric signaling machines. Cell. 2002;110:673–687. doi: 10.1016/S0092-8674(02)00971-6. - DOI - PubMed
    1. Parsons JT, Horwitz AR, Schwartz MA. Cell adhesion: integrating cytoskeletal dynamics and cellular tension. Nat. Rev. Mol. Cell Biol. 2010;11:633–643. doi: 10.1038/nrm2957. - DOI - PMC - PubMed
    1. Revach OY, Grosheva I, Geiger B. Biomechanical regulation of focal adhesion and invadopodia formation. J. Cell Sci. 2020;133:jcs244848. doi: 10.1242/jcs.244848. - DOI - PubMed