. 2024 Mar 7;15(1):1781.
doi: 10.1038/s41467-024-45773-3.

Kdm1a safeguards the topological boundaries of PRC2-repressed genes and prevents aging-related euchromatinization in neurons

Affiliations

Kdm1a safeguards the topological boundaries of PRC2-repressed genes and prevents aging-related euchromatinization in neurons

Beatriz Del Blanco et al. Nat Commun. .

Abstract

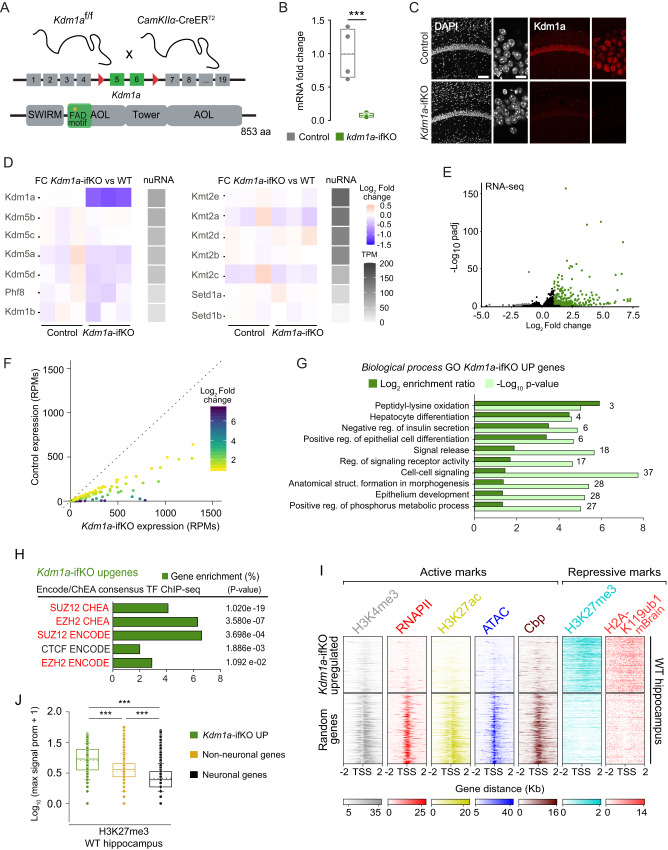
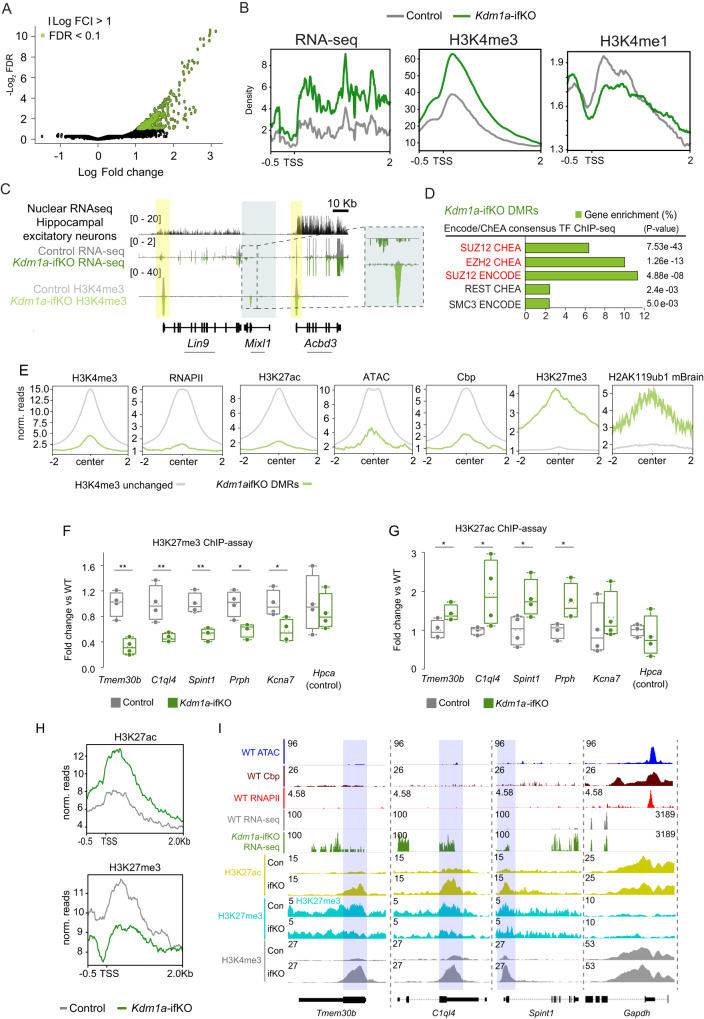
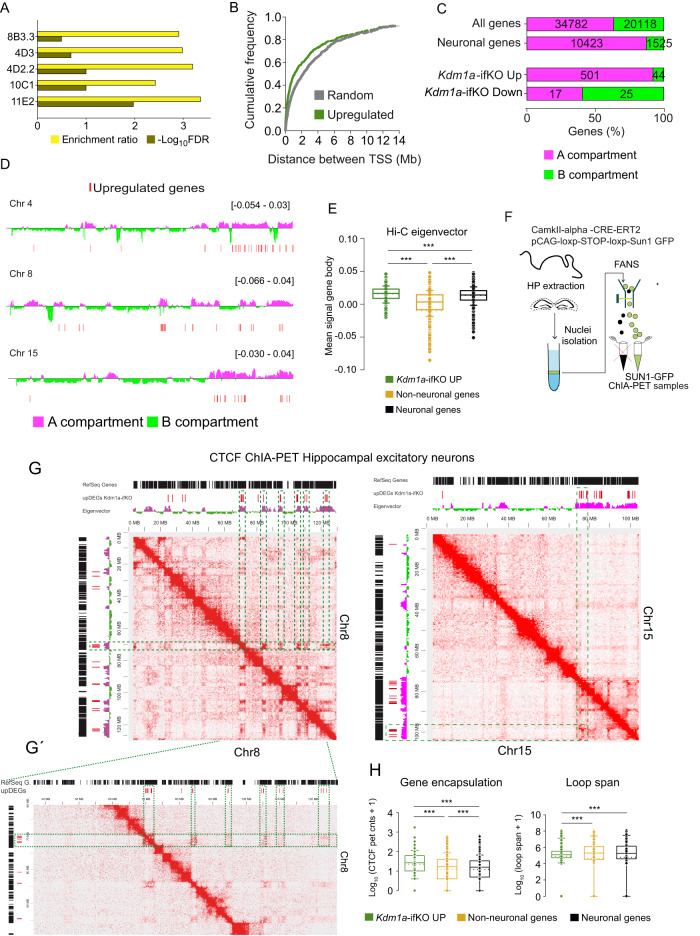
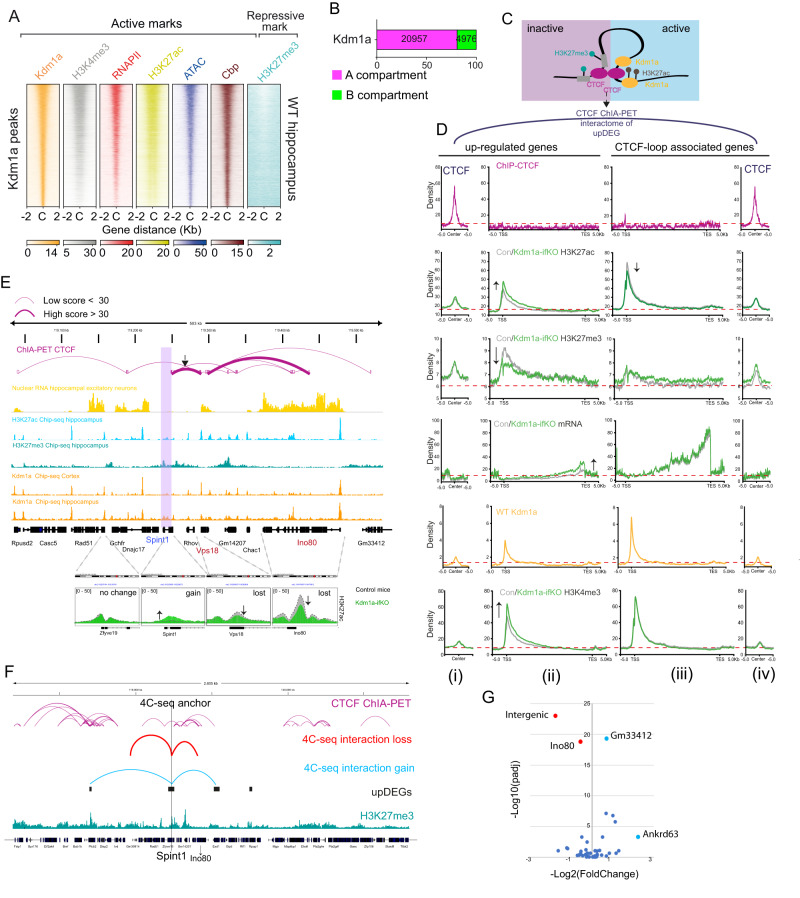
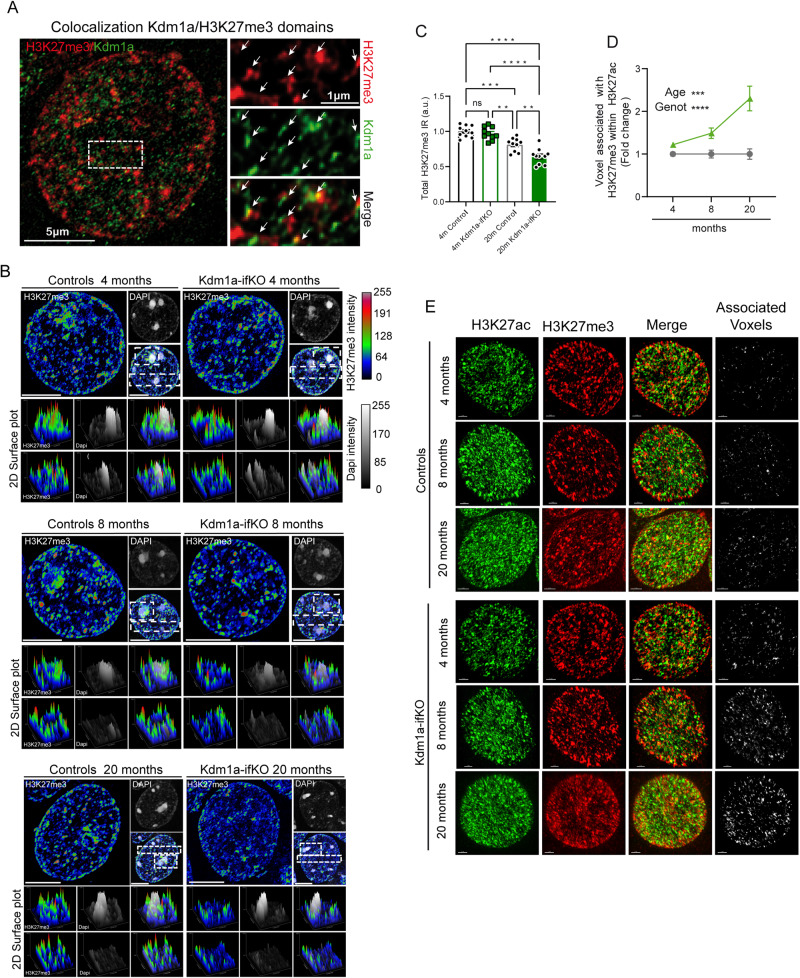
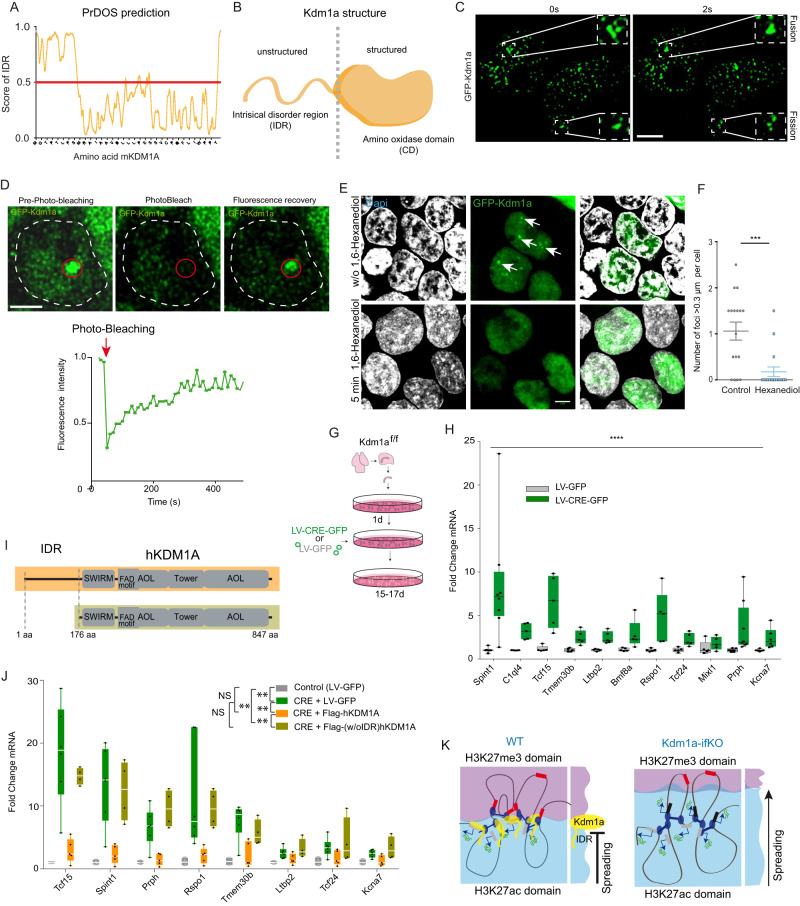
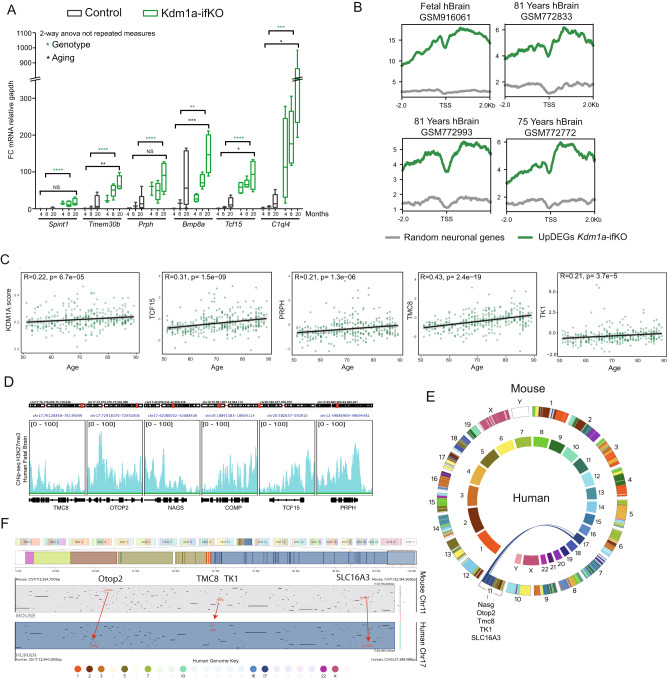
Kdm1a is a histone demethylase linked to intellectual disability with essential roles during gastrulation and the terminal differentiation of specialized cell types, including neurons, that remains highly expressed in the adult brain. To explore Kdm1a's function in adult neurons, we develop inducible and forebrain-restricted Kdm1a knockouts. By applying multi-omic transcriptome, epigenome and chromatin conformation data, combined with super-resolution microscopy, we find that Kdm1a elimination causes the neuronal activation of nonneuronal genes that are silenced by the polycomb repressor complex and interspersed with active genes. Functional assays demonstrate that the N-terminus of Kdm1a contains an intrinsically disordered region that is essential to segregate Kdm1a-repressed genes from the neighboring active chromatin environment. Finally, we show that the segregation of Kdm1a-target genes is weakened in neurons during natural aging, underscoring the role of Kdm1a safeguarding neuronal genome organization and gene silencing throughout life.


Conflict of interest statement

The authors declare no competing interests.

Figures

Fig. 1
Fig. 1. Kdm1a loss in adult excitatory neurons causes de-repression of PRC2-repressed nonneuronal genes.
A Genetic strategy used to deplete Kdm1a. Floxed exons and the encoded flavin adenine dinucleotide (FAD)-binding domain are highlighted. Kdm1a also has amine oxidase-like (AOL), SWIRM and tower domains. B Kdm1a transcript levels 4 weeks after TMX administration (n = 6 Kdm1a-ifKO; n = 4 control (CT); T = 34, p = 0.01, Mann-Whitney test, two-tailed). Box plots indicate median value, interquartile range, minimum and maximum value (whiskers), and individual data points. C CA1 immunostaining with anti-Kdm1a 2 months after TMX. DNA was counterstained with DAPI. Scale bars: 100 µM and 10 µm in insets. D Gray scale: Nuclear RNA levels for KDMs and KTMs in excitatory forebrain neurons in transcripts per million (TPM). Color scale: Log2FC between genotypes. E Volcano plot of differential expression analysis (n = 3 CT and 3 Kdm1a-ifKO). Upregulated genes are labeled in green and downregulated genes in grey (Wald test, p adj <0.05; |log2 FC | > 1). F Scatter plot of upDEGs expression in Kdm1a-ifKOs and controls. G GO enrichment analysis for Biological processes in upDEGs (Fisher’s exact test). Number of genes, enrichment ratio and statistical significance are shown. H Enrichment analysis for TF binding in upDEGs (Fisher’s exact test, p adj <0.05; log2FC > 1). PRC2 subunits are highlighted in red. I Density of ChIP-seq reads for H3K4me3, H3K27ac, accessibility measured by ATAC-seq, binding of CBP and RNAPII, and the PRC2-related repressive marks H3K27me3 and H2AK119ub. Heatmaps represent the enrichment for all these marks in hippocampal chromatin of wild type (WT) mice around the TSS ( ± 2 Kb) of upDEGs and the TSS of a similarly sized set of random genes expressed in neurons. J Quantification of H3K27me3 signal in the set of upDEGs (n = 514) compared with neuronal genes (n = 14902) and with nonneuronal genes not affected by Kdm1a loss (n = 11372; Mann–Whitney U Statistic, two tailed, pval ***<0.0001). Box plot as described in panel B except for whiskers showing SD values. Source data are provided as a Source data file.
Fig. 2
Fig. 2. Gene de-repression is accompanied by dramatic changes in the epigenetic profile.
A Volcano plot of H3K4me3 DMRs (n = 2 for CT; n = 3 for Kdm1a-ifKO; FDR < 0.1, |log2FC | > 1). B Density distribution of RNA-seq, H3K4me3, and H3K4me1 reads around the TSS of upDEGs (distance for TSS, −0.5 Kb, and +2 Kb). C Genomic snapshot around Mixl1, as an example of upregulated gene. The graph shows mRNA-seq and H3K4me3 profiles in the adult hippocampus of Kdm1a-ifKO and control littermates. The upper nuclear RNA-seq track shows that Mixl1 is not expressed in excitatory forebrain neurons, whereas neighboring genes are highly expressed. Data range is shown in brackets. Arrows indicate the direction of transcription. D Enrichment analysis for TF binding at H3K4-DMRs in Kdm1a-ifKOs. Subunits of PRC2 are highlighted in red (Fisher exact test, p adj <0.05; log2FC > 1). E Graphs show the enrichment for active and repressive marks around the center ( ± 2 Kb) of H3K4-DMRs (green track; FDR < 0.1) compared to regions without changes in H3K4me3 (grey track; FDR > 0.1) in the chromatin of WT mice. F, G H3K27me3 (F) and H3K27ac (G) ChIP-assays in Kdm1a-ifKO and control littermates revealed changes in several upDEGs (CT, n = 4; Kdm1a-ifKO, n = 4). The Hpca gene is shown as a negative control. Boxplots indicate median value, interquartile range, minimum and maximum value, and individual data points (two-tailed t-test, **p-val < 0.001; *p-val2 < 0.01). H Density distribution of H3K27ac and H3K27me3 reads around the TSS of upDEGs (distance to TSS, −0.5 Kb, and +2 Kb) in Kdm1a-ifKOs and control littermates. Compare with the H3K4me3 and RNA profiles presented in panel 2B. I Genomic snapshots show three examples of upDEGs, Tmem30b, C1ql4, and Spint1; and one non-changing gene, Gapdh. Chromatin accessibility, CBP, and RNAPII ChIP-seq profiles from hippocampus of adult mice are plotted. Source data are provided as a Source data file.
Fig. 3
Fig. 3. Topological association between upDEGs.
A Chromosome location enrichment analysis of upDEGs (Kolmogorov–Smirnov test, p adj <0.05; log2FC ≥ 0.5). Codes on the Y-axis correspond to the location of cytogenetic bands. B Cumulative plot reflects the distance between TSSs of upDEGs, and between TSSs of an equal number of random genes (Kolmogorov-Smirnov test, two-tailed, p adj <0.05; log2FC > 0.5; D = 0.14; p = 0.00004). C Percentage of genes located in compartment A or B for the genesets: all genes, neuronal and nonneuronal genes, and upregulated and downregulated genes in hippocampus of Kdm1a-ifKOs. To increase the scope of the analysis, we included the genes with log2FC > 0.5 (587 DEGs: 545 up and 42 down). Note that reads in the Hi-C dataset were binned at 25 kb resolution. D Genomic snapshots of upDEGs (red lines) clustering in chromosomes 4, 8, and 15. The location into the A/B compartment is shown. Selection criteria for non-neuronal and neuronal genes were TPM < 5 (14902 genes) and TPM > 5 (11372 genes), respectively, according to data from E Hi-C average interaction frequency within the gene body of upDEGs, genes expressed in neurons and nonneuronal genes not affected by Kdm1a loss (Mann-Whitney U Statistic, two-tailed, pval ***<0.0001). Box plots indicate median value, interquartile range, minimum and maximum value, and individual data points. F Scheme of isolation of Sun1-GFP tagged nuclei. GG’ 2D visualization of CTCF-dependent chromatin interaction at excitatory hippocampal neurons from WT mice. Intrachromosomal interactions at Chr5 (0Mb-104Mb) and Chr8 (0Mb-120Mb) are shown. Black bars: referenced genes at chr8 or chr15. Green dashed line boxes: intrachromosomal loops between upDEGs. H Boxplots present the quantification of CTCF interaction in the sets of upDEGs, nonneuronal genes and neuronal genes. The left panel shows the summation of ChIA-PET counts at CTCF loops encompassing the gene body. The right panel shows the loop span measured as the average distance between the CTCF peaks that encapsulate the upDEGs (Mann–Whitney U Statistic, two-tailed, pval ***<0.0001). Box plots as indicated in panel E. Source data are provided as a Source data file.
Fig. 4
Fig. 4. Topological association between Kdm1a and its target genes.
A Heatmaps of active and repressive marks in the chromatin of WT mice ( ± 2 kb of Kdm1a peaks). B Distribution of Kdm1a peaks between chromatin compartments. C Schematic illustration of CTCF connection in upDEGs. D Density plots showing ChIP-seq signal for H3K27ac, H3K27me3 and H3K4me3 in CTCF loops associated with upDEGs in hippocampal chromatin of control and Kdm1a-ifKO mice. Four graphs are presented for each hPTM corresponding to (i) ±5 kb window centered on the CTCF peaks directly linked to the upDEGs; (ii) upDEGs metagene; (iii) metagene for the CTCF-loop associated genes; and (iv) ±5 kb window centered on the CTCF peaks directly linked to the upDEG-associated genes. Transcript levels in control and ifKO mice, and CTCF and Kdm1a density plots in WT hippocampal chromatin are also shown. E Genomic profiles and CTCF ChIA-PET interactions at the Spint1 locus (purple box). CTCF loops bring the H3K27me3-enriched Spint1 gene closer to active genes Vps18 and Ino80. The lower panels show H3K27ac levels in the chromatin of control and Kdm1a-ifKOs at Spint1 and neighbour genes linked through first and second-order CTCF connections. Vps18 and Ino80 show lower levels of H3K27ac in Kdm1a-ifKOs, in parallel to the increase for this hPTM in Spint1. The dashed line represents H3K27ac density in control mice. Transcript levels are shown in the yellow track. F 4C-seq interaction profiles using the Spint1 promoter as viewpoint (anchor). Interactome profiles were generated using the hippocampus of Kdm1a-ifKO (n = 3) and control mice (n = 3). Significant reduction in the interaction of Spint1 was observed with the gene body of Ino80 and with an intergenic region (in red), while a higher interaction frequency was observed with Gm33412 and Ankrd63 (in blue), which are also upregulated in Kdm1a-ifKO neurons. The position of upDEGs is indicated with black boxes; the tracks for H3K27me3 ChIP-seq and CTCF-ChIA-PET interactions are shown. G Volcano plot showing the most significant changes on interaction frequencies in the 4C-seq generated with Spint1 as viewpoint (likelihood ratio test, pval <0.1). Source data are provided as a Source data file.
Fig. 5
Fig. 5. Altered chromatin compartmentalization in Kdm1a-ifKOs progresses with age.
A Super-resolution images show the colocalization of Kdm1a and H3K27me3-immunoreactivity in the nucleus of CA1 pyramidal neurons in WT mice. B Representative super-resolution images show the disorganization of H3K27me3 condensed aggregates in the nucleus of Kdm1a-ifKO neurons from 4- (top panels), 8- (middle panels) and 20-month-old (bottom panels) mice compared to control littermates. The distribution of H3K27me3 puncta at selected regions (white boxes) is shown as a 2D surface plot in the panels below. Fluorescence intensity of H3K27me3 and DAPI labeling is represented with a color gradient. The red signal indicates the highest detected H3K27me3 signal intensity and the blue the lowest. Scale bar: 5 μm. C Measurement of H3K27me3-immunoreactive signals in the nucleus of CA1 hippocampal neurons (n = 10) of 4-, 8- and 20-month-old Kdm1a-ifKO and control littermates (4 m, n = 3; 20 m, n = 4 per genotype). Tukey’s multiple comparison test, two-sided, ****p-val < 0.0001; ***p-val < 0.001; **p-val < 0.01. D Quantification of association between H3K27me3-positive voxels and H3K27ac signal in Kdm1a-ifKOs and control mice at different ages (4 m, n = 15 cells; 8 m, n = 10 cells; 20 m, n = 11 cells). The quantification of voxels with overlapping signals revealed that the proportion of H3K27me3-positive voxels with H3K27ac signal increased with age in Kdm1a-ifKOs compared to control mice (4 m, n = 3 mice; 8 m, n = 2 mice; 20 m, n = 4 mice per genotype; two-way ANOVA: ****p-val < 0.0001¸***p-val < 0.001). E Representative super-resolution images show the increased coincidence of H3K27me3 and H3K27ac signals in the nucleus of Kdm1a-ifKO neurons from neurons from 4-, 8- and 20-month-old mice compared to control littermates. Scale bar: 2 μm. Data are presented as mean values ± SEM in (C) and (D). Source data are provided as a Source data file.
Fig. 6
Fig. 6. Kdm1a condensates exhibit LLPS properties.
A The PrDOs algorithm identified intrinsically disordered regions at the N-terminus of mouse Kdm1a. B Kdm1a scheme illustrating the separation of the IDR and catalytic domain. C Time-lapse images of the nuclei of HEK293 cells expressing GFP-Kdm1a. Fusion and fission events of Kdm1a puncta were captured in a 2 second interval. Scale bar: 5 µM. D GFP-Kdm1a expression in HEK293 cells produces green-fluorescent puncta with rapid fluorescence recovery after photobleaching (FRAP) (n = 4 independent experiments) Scale bar: 2.5 µM. E GFP-Kdm1a droplets disappeared few minutes after treatment with 1,6-hexanediol. Scale bars: 5 µM. F Quantification of GFP-Kdm1a foci > 0.3 µm per cell before and after 1,6-hexanediol treatment. (n = 17 cells in 3 independent experiments; Mann-Whitney test, two-tailed: ***pval = 0.0004). Scatter plot represents mean ± SEMs. G Scheme of experiments in hippocampal PNCs. E17 Kdm1a f/f embryos infected with a lentiviral vector co-expressing CRE recombinase and GFP (LV-CRE-GFP) or a control lentiviral vector that only expresses GFP (LV-GFP). The same elements (created by B.dB.) in a different order were used in (Lipinski et al., KAT3-dependent acetylation of cell type-specific genes maintains neuronal identity in the adult mouse brain. Nat Comm 2020 May 22;11(1):2588. 10.1038/s41467-020-16246-0). H RT-qPCR analysis demonstrates that de-repression of upDEGs also occurs in Kdm1a-deficient PNCs. (control, n = 3; CRE, n = 3; two-way ANOVA: ****p-val < 0.0001). Boxplots indicate median value, interquartile range, minimum and maximum value, and individual data points. I Schematic representation of the human Kdm1a variants used in rescue experiments. J RT-qPCR analysis demonstrates that hKDM1A protein restores non-neuronal genes repression in Kdm1a-deficient PNCs. However, a truncated KDM1A protein lacking the N-terminal IDR is unable to restore the transcriptional phenotype found in Kdm1a-deficient PNCs. (control, n = 4; CRE, n = 6; Flag-hKDM1A, n = 5 and Flag-(w/oIDR)hKDM1A, n = 4; two-way ANOVA: **p-val2 <  0.001; NS pval >0.01). Boxplots as indicated in panel H. K Schematic model of Kdm1a function at the boundary of H3K27me3 and H3K27ac domains. The loss of Kdm1a causes changes in H3K4 methylation levels, alters the balance between H3K27me3/H3K27ac and disrupts chromatin compartmentalization leading to the de-repression of PCR2-repressed nonneuronal genes that interact with active loci. Kdm1a’s IDR is essential to maintain non-neuronal repression, suggesting that liquid-liquid phase separation is involved in the transcriptional and epigenetic alterations described in Kdm1a-ifKOs. Source data are provided as a Source data file.
Fig. 7
Fig. 7. Derepression of upDEGs both in mice and humans correlates with aging.
A Time course analysis of selected upregulated genes, Prph, Tmem30b, Spint1, Bmp8a, Tcf15 and C1ql4 of Kdm1a-ifKO neurons compared with control neurons using RT-PCR (4 m, n = 3; 8 m, n = 3; 20 m, n = 6 in controls; and 4 m, n = 4; 8 m, n = 5; 20 m, n = 4 in Kdm1a-ifKOs). Boxplots indicate median value, interquartile range, minimum and maximum value, and individual data points. Two-way ANOVA: ****p-val < 0.0001; **p-val < 0.001; * p-val < 0.01; NS pval >0.01. B Density plot of H3K27me3 in adult and fetal human brain samples (datasets used and ages are indicated in the figure). H3K27me3 was plotted at the TSS of the human homolog genes of upDEGs in Kdm1a-ifKOs (log2FC > 1). C Gene expression correlation between age and transcript level of Kdm1a-ifKO upDEGs (log2FC > 1.5) (n = 320). Kdm1a score was calculated using the Kdm1a-ifKO genes represented in the human dataset (100 out of 165 genes). Spearman Correlation, pval <0.05. Several examples of genes with a high and intermediate degree of correlation are shown. D Genome snapshot of H3K27me3 enrichment in fetal brain samples for several genes upregulated during human and mouse aging: TMC8, OTOP2, NAGS, COMP, TCF15, and PRPH. E, F Analysis of regions of conserved synteny using the web-based application The JAX Synteny Browser. Chromosome position analysis of Nags, Otop2, Tmc8, Tk1, and Slc16a3 in the human and mouse genomes (E). Representation of human-mouse synteny across the entire domain spanning Otop2, Tmc8, TK1, and Slc16a3 (chr17 and chr11, respectively in human and mouse) (F). Source data are provided as a Source data file.

References

    1. Franke M, et al. Formation of new chromatin domains determines pathogenicity of genomic duplications. Nature. 2016;538:265–269. doi: 10.1038/nature19800. - DOI - PubMed
    1. Dixon JR, et al. Topological domains in mammalian genomes identified by analysis of chromatin interactions. Nature. 2012;485:376–380. doi: 10.1038/nature11082. - DOI - PMC - PubMed
    1. Szabo Q, Bantignies F, Cavalli G. Principles of genome folding into topologically associating domains. Sci. Adv. 2019;5:eaaw1668. doi: 10.1126/sciadv.aaw1668. - DOI - PMC - PubMed
    1. Lieberman-Aiden E, et al. Comprehensive mapping of long-range interactions reveals folding principles of the human genome. Science. 2009;326:289–293. doi: 10.1126/science.1181369. - DOI - PMC - PubMed
    1. Rao SS, et al. A 3D map of the human genome at kilobase resolution reveals principles of chromatin looping. Cell. 2014;159:1665–1680. doi: 10.1016/j.cell.2014.11.021. - DOI - PMC - PubMed

MeSH terms