. 2024 Mar 7;15(1):2067.
doi: 10.1038/s41467-024-46492-5.

A SWI/SNF-dependent transcriptional regulation mediated by POU2AF2/C11orf53 at enhancer

Affiliations

A SWI/SNF-dependent transcriptional regulation mediated by POU2AF2/C11orf53 at enhancer

Aileen Szczepanski et al. Nat Commun. .

Abstract

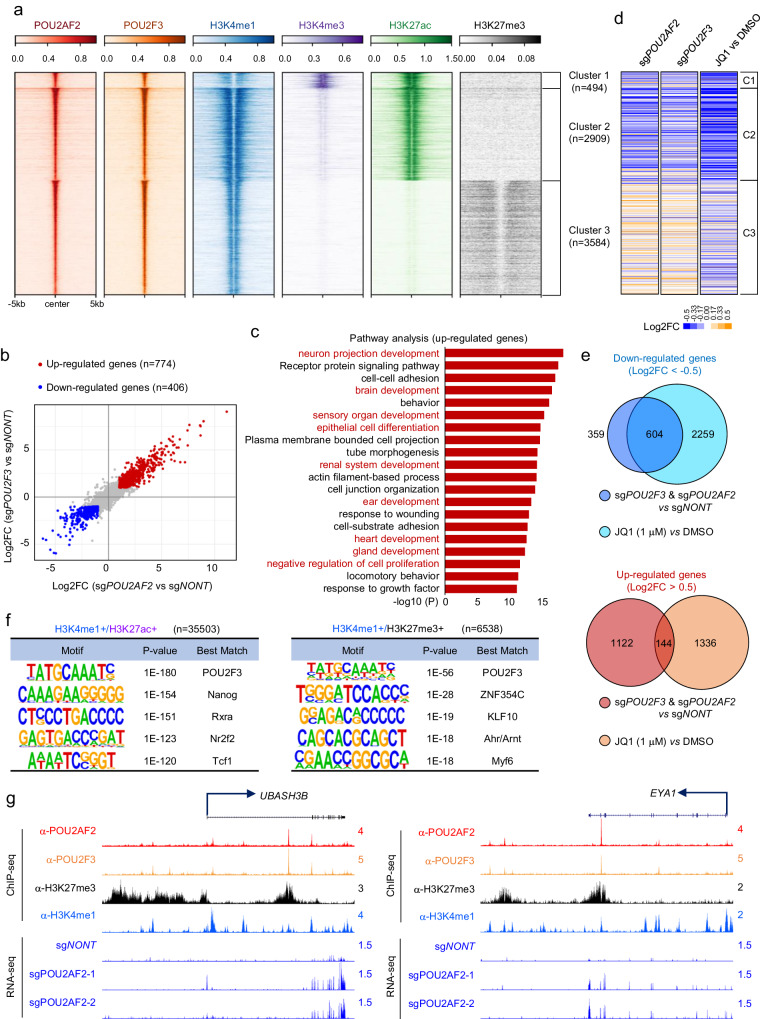
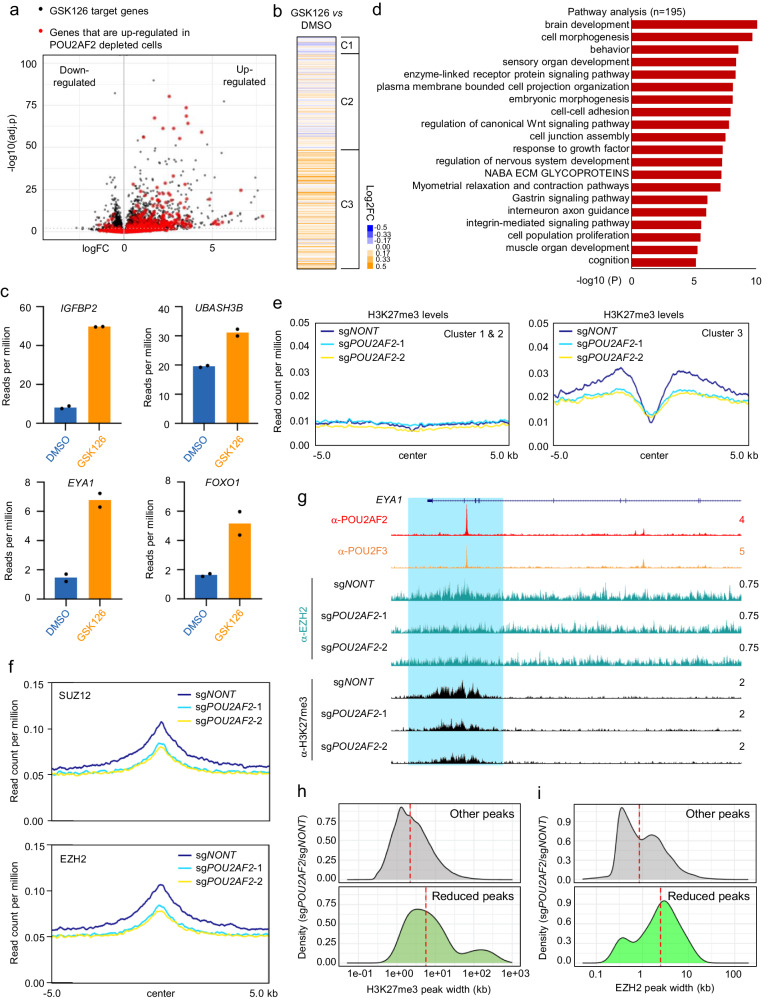
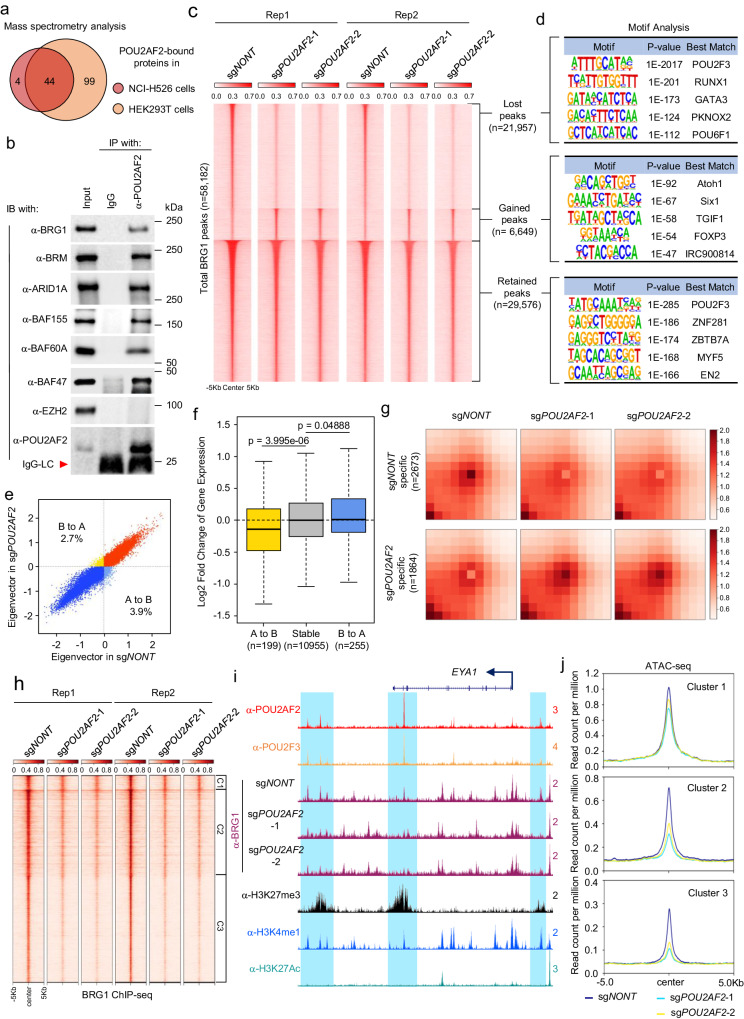
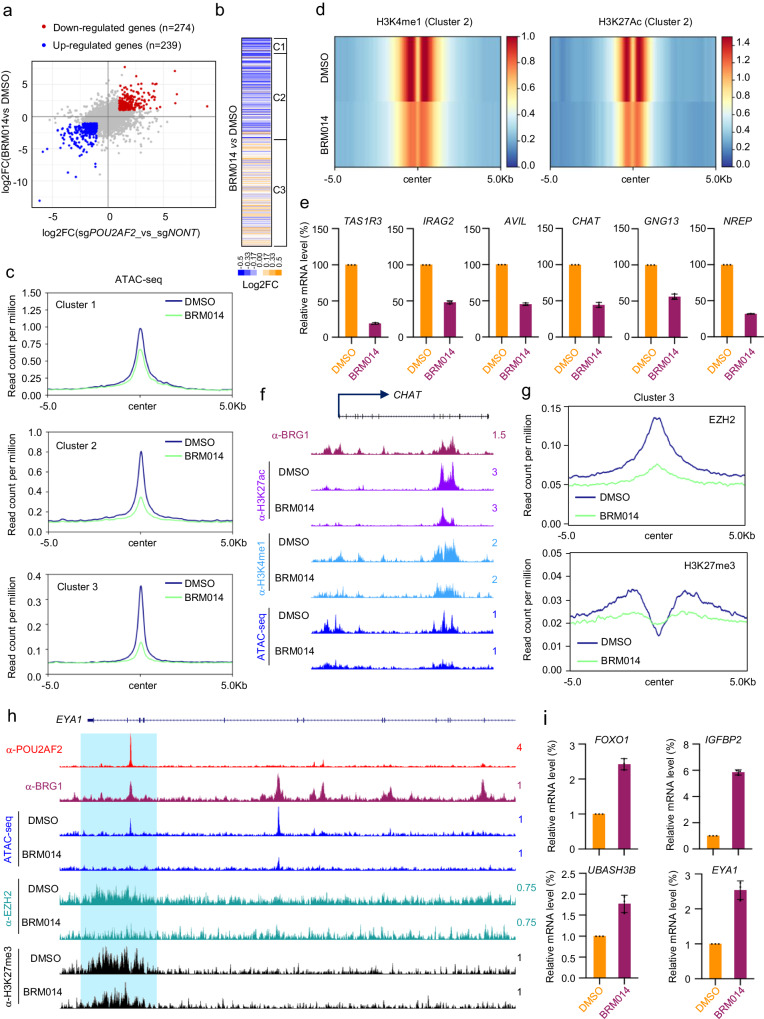
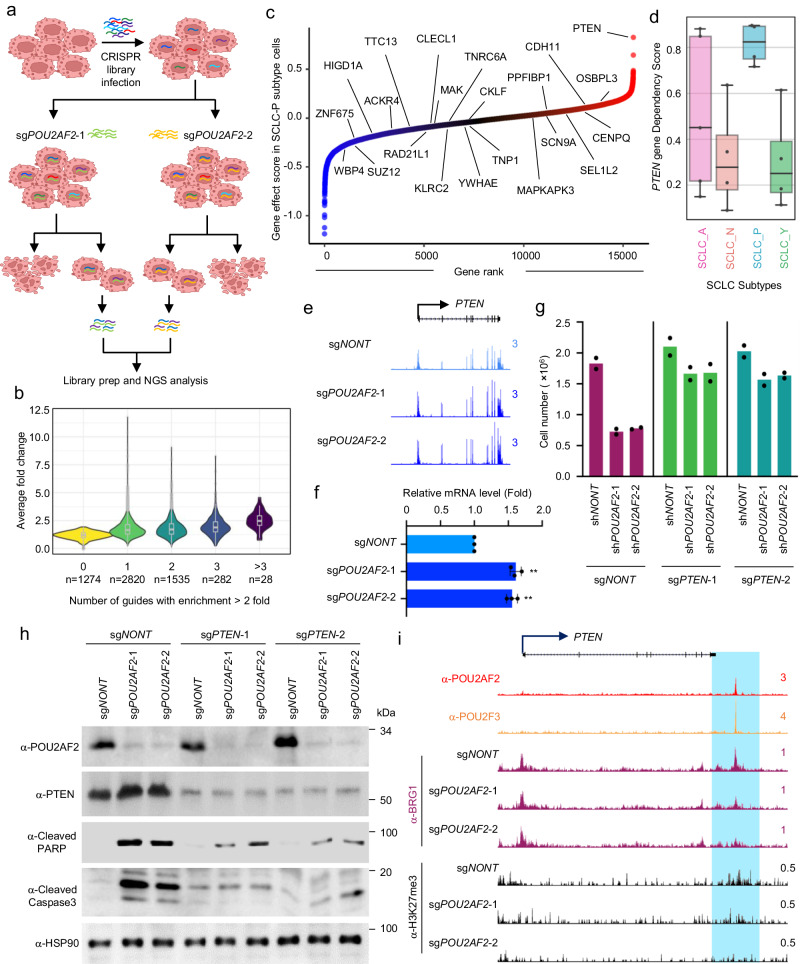
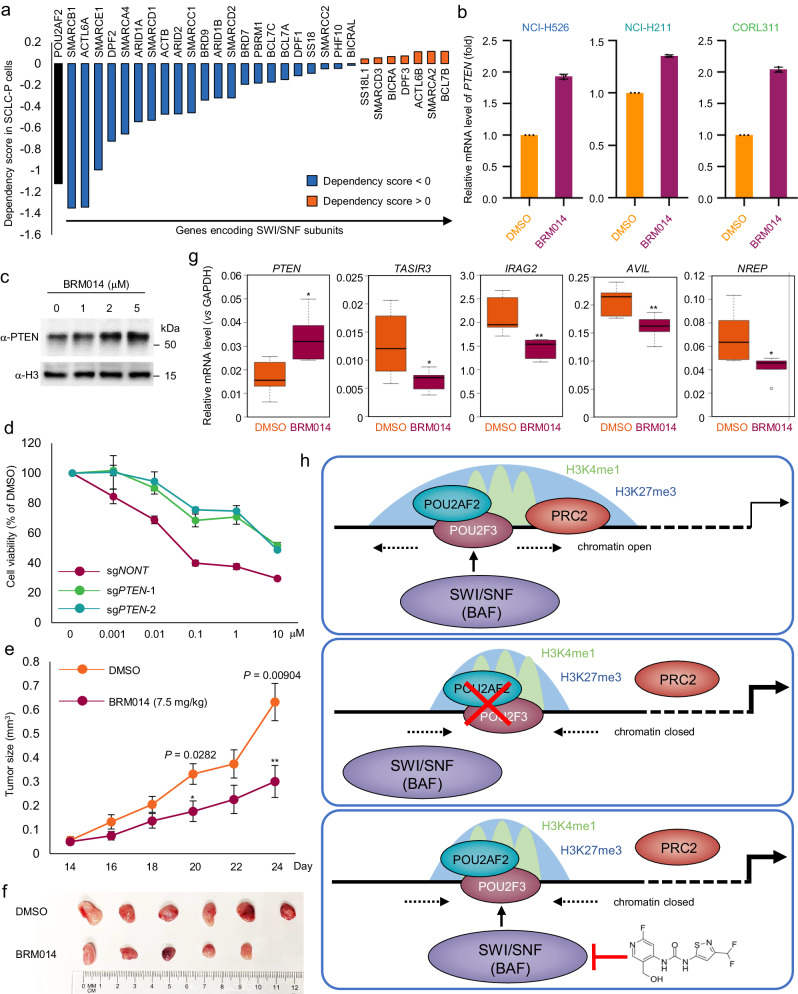
Recent studies have identified a previously uncharacterized protein C11orf53 (now named POU2AF2/OCA-T1), which functions as a robust co-activator of POU2F3, the master transcription factor which is critical for both normal and neoplastic tuft cell identity and viability. Here, we demonstrate that POU2AF2 dictates opposing transcriptional regulation at distal enhance elements. Loss of POU2AF2 leads to an inhibition of active enhancer nearby genes, such as tuft cell identity genes, and a derepression of Polycomb-dependent poised enhancer nearby genes, which are critical for cell viability and differentiation. Mechanistically, depletion of POU2AF2 results in a global redistribution of the chromatin occupancy of the SWI/SNF complex, leading to a significant 3D genome structure change and a subsequent transcriptional reprogramming. Our genome-wide CRISPR screen further demonstrates that POU2AF2 depletion or SWI/SNF inhibition leads to a PTEN-dependent cell growth defect, highlighting a potential role of POU2AF2-SWI/SNF axis in small cell lung cancer (SCLC) pathogenesis. Additionally, pharmacological inhibition of SWI/SNF phenocopies POU2AF2 depletion in terms of gene expression alteration and cell viability decrease in SCLC-P subtype cells. Therefore, impeding POU2AF2-mediated transcriptional regulation represents a potential therapeutic approach for human SCLC therapy.


Conflict of interest statement

The authors declare no competing interests.

Figures

Fig. 1
Fig. 1. POU2AF2 elicits opposing effects of gene expression at distal enhancer elements.
a The POU2AF2 and POU2F3 ChIP-seq was conducted in human SCLC cell line NCI-H526 cells. The overlapping POU2AF2 and POU2F3 peaks (n = 6987) were divided into three clusters by k-means clustering based on POU2AF2, POU2F3, and histone marks (H3K4me1, H3K27ac, H3K4me3, and H3K27me3). The ChIP-seq signal of these histone marks were further centered on the three clusters. b The scatter plot shows the correlation of gene expression change when POU2F3 or POU2AF2 were depleted by sgRNAs. The significantly altered genes (|log2FC|>1, adj. p < 0.01) by POU2F3/POU2AF2 depletion were highlighted in red (upregulated, n = 774) or blue (downregulated, n = 406). Data are derived from two biological replicates. Genes with Benjamini-Hochburg adjusted p-values less than 0.01 were considered to be differentially expressed in the EdgeR analysis. c Metascape pathway enrichment analysis with up-regulated genes in both POU2F3 and POU2AF2 depleted cells. The -log10(P) value was calculated by Metascape software v3.5. d The heatmap shows the nearby gene expression change aligned to the corresponding ChIP-seq peak (Fig. 1a) in either POU2AF2 depleted, POU2F3 depleted, or JQ1 treated NCI-H526 cells. Data are derived from two biological replicates. e The Venn diagram shows the overlap between JQ1 target genes and POU2F3/POU2AF2 common target genes. f The enhancer regions marked by H3K4me1 and H3K27me3 (n = 6538), or H3K4me1 and H3K27ac (n = 35503) were identified in NCI-H526 cells. The motif analysis shows the most significant motifs enriched in each type of enhancer elements. HOMER screens its library of reliable motifs against the target and background sequences for enrichment, returning motifs enriched with a p-value less than 0.05. g The track examples show the occupancy of POU2F3 and POU2AF2 at H3K4me1 and H3K27me3 marked enhancer regions, and the activation of nearby gene expression upon the loss of POU2AF2.
Fig. 2
Fig. 2. POU2AF2 is essential for PRC2 maintenance and repression of Polycomb target genes.
a NCI-H526 cells were treated with EZH2 inhibitor GSK126 (2 µM) for 6 days. The volcano plot shows the overlap between EZH2 inhibitor GSK126 target genes and the up-regulated genes (log2FC > 1) in POU2AF2 depleted cells as highlighted in red. Data are derived from two biological replicates. Genes with Benjamini-Hochburg adjusted p-values less than 0.01 were considered to be differentially expressed in the EdgeR analysis. b The log2FC heatmap shows the nearby gene expression change with EZH2 inhibitor GSK126 treatment aligned to the three cluster ChIP-seq peaks defined in Fig. 1a in NCI-H526 cells. Data are derived from two biological replicates. c The RNA-seq data for several POU2AF2 repressed genes that were also up-regulated by GSK126 treatment. Data are derived from two biological replicates. d Pathway analysis with the co-upregulated genes in POU2AF2 depleted and GSK126 treated cells. The -log10(P) value was calculated by Metascape software v3.5. e Average plots show the H3K27me3 levels at cluster 1&2 (left) and cluster 3 (right) in NCI-H526 cells transduced with either non-targeting sgRNA or two distinct POU2AF2 sgRNAs. f The average plots show the SUZ12 and EZH2 levels at cluster 3 peaks in NCI-H526 cells transduced with either non-targeting CRISPR sgRNA or two distinct POU2AF2 sgRNAs. g The track example shows that loss of POU2AF2 reduced the chromatin occupancy of EZH2 and H3K27me3 levels at the EYA1 gene locus. Differential peak analysis was performed with EdgeR analysis. The density plots show the distribution of peak width of H3K27me3 (h) and EZH2 (i) when POU2AF2 was depleted. The green color represents the peaks that were downregulated in POU2AF2 depleted cells (n = 105 for H3K27me3; n = 112 for EZH2), and the gray color represents the rest of the peaks, including the upregulated and stable peaks (n = 61444 for H3K27me3; n = 8243 for EZH2).
Fig. 3
Fig. 3. POU2AF2 interacts with the SWI/SNF complex and regulates chromatin accessibility.
a GFP-tagged POU2AF2 was purified from HEK293T and SCLC cell line NCI-H526 cells and the co-eluted protein was further subjected to mass spectrometry analysis. The Venn diagram shows the overlap of interacting proteins in both cell lines. b The protein-protein interaction between endogenous POU2AF2 and different subunits within the SWI/SNF complex was validated by immunoprecipitation in NCI-H526 cells. EZH2 was used as a negative control. n = 2 biologically independent experiments. Source data are provided as a Source Data file. c The NCI-H526 cells were transduced with either non-targeting sgRNA or two distinct POU2AF2 sgRNAs. BRG1 occupancy was determined by ChIP-seq with its specific antibody. The BRG1 peaks (n = 58182) were divided into three groups based on the differential peak analysis: peak lost in sgPOU2AF2 versus sgNONT (n = 21957); peak gained in sgPOU2AF2 versus sgNONT (n = 6649); peak retained in sgPOU2AF2 versus sgNONT (n = 29576). Data are derived from two independent biological replicates. D) The motif analysis of the three groups with decreased BRG1 (Group 1), increased BRG1 (Group 2), and retained BRG1 (Group 3) in sgPOU2AF2 vs. sgNONT were performed and shown. HOMER screens its library of reliable motifs against the target and background sequences for enrichment, returning motifs enriched with a p-value less than 0.05. e PC1 was calculated for each 100-kb genomic bin to determine its A or B compartmentalization. Compartment switching, decompaction and compaction upon POU2AF2 depletion are represented in the scatter plot. Percentage of compartment shifts (A to B or B to A) are shown. f Genes located in A-to-B shifted, stable and B-to-A shifted bins were selected (>= ½ gene length located within the bins). Genes with detectable expression levels were further selected (199 for A-B and 255 for B-A) for analysis of the logFC gene expression in sgPOU2AF2 versus sgNONT, shown in the box plot. p-value is calculated by two-sided Wilcoxon test. Center line: median; top and bottom hinges of box: the third and first quantiles; whiskers: quartiles ± 1.5 × interquartile range. g APA plot depicts aggregated signals from sgPOU2AF2-specific loops (n = 1864) versus sgNONT-specific loops (n = 2673). h The BRG1 ChIP-seq signals in sgNONT or sgPOU2AF2 cells were centered on the three clusters defined in Fig. 1a. Data are derived from two independent biological replicates. i The track example shows the loss of POU2AF2 reduces BRG1 occupancy at the enhancer regions marked by both H3K27me3 and H3K4me1. j The chromatin accessibility in POU2AF2 wild-type and depleted cells was determined by ATAC-seq. The peaks were centered on the three clusters.
Fig. 4
Fig. 4. The ATPase activity of SWI/SNF complex is required for POU2AF2 mediated transcriptional regulation.
a The scatter plot shows the correlation of gene expression change when POU2AF2 were depleted by sgRNAs or cells were treated with BRM014. The significantly altered genes (|log2FC|>1, adj. p < 0.01) were highlighted in red (upregulated, n = 239) or blue (downregulated, n = 274). Data are derived from two biological replicates. Data are derived from two biological replicates. Genes with Benjamini-Hochburg adjusted p-values less than 0.01 were considered to be differentially expressed in the EdgeR analysis. b The log2 fold change heatmap shows the nearby gene expression change aligned to the corresponding ChIP-seq peak (Fig. 1a) in BRM014 (1 μM) treated NCI-H526 cells. Data are derived from two biological replicates. c The ATAC-seq experiment was conducted in NCI-H526 cells treated with either BRM014 or DMSO. The average plot shows the ATAC-seq signal centered at the three clusters. d The heatmap bar plot shows H3K4me1 and H3K27ac levels at Cluster 2 (active enhancer) peaks between DMSO and BRM014 treated cells. e The NCI-H526 cells were treated with either DMSO or BRM014 (1 μM) for 24 hours. The mRNA levels of TAS1R3, IRAG2, AVIL, CHAT, GNG13, and NREP were determined by real time PCR. n = 3 technical replicates. Data are presented as mean values ± standard deviation (SD). Source data are provided as a Source Data file. f The track example shows the H3K27ac, H3K4me1, and ATAC-seq signals in cells treated with either DMSO or BRM014 at active enhancer locus of CHAT gene. g The average plot shows the chromatin occupancy of EZH2 and H3K27me3 levels at Cluster 3 in NCI-H526 cells treated with either DMSO or BRM014. h The track example shows the ATAC-seq signals, H3K27me3 levels and EZH2 occupancy at EYA1 gene locus in NCI-H526 cells treated with either DMSO or BRM014. i NCI-H526 cells were treated with 1 μM BRM014 for 24 hours. The mRNA levels of FOXO1, IGFBP2, UBASH3B, and EYA1 were determined by real time PCR. n = 3 technical replicates. Data are presented as mean values ± standard deviation (SD). Source data are provided as a Source Data file.
Fig. 5
Fig. 5. Loss of POU2AF2 results in SCLC cell viability decrease by activating PTEN expression.
a The flowchart shows genome-wide CRISPR-Cas9 screening with GeCKO lentiviral gRNA library in wild type and POU2AF2 depleted NCI-H526 cells. b The violin plot identifies the factors that depletion of which could rescue cell death induced by POU2AF2 depletion. X-axis represents the number of guides per gene identified in the screen (total 6 guides per gene). c The dependency score of the 28 genes that were identified from (b) in the four SCLC-P subtype cell lines: NCI-H526, NCI-H211, NCI-H1048, and CORL311. The gene effect score data were retrieved from the DepMap Portal. Center line: median; top and bottom hinges of box: the third and first quantiles; whiskers: quartiles ± 1.5 × interquartile range. d The dependency score of PTEN gene in the four SCLC subtypes (A, N, P, and Y). The following SCLC cell lines are used in the dependency analysis: A subtype, CORL47, DMS53, NCI-H1092, NCI-H209, SHP77 (n = 5); N subtype, CORL279, NCI-H1694, NCI-H466, NCI-H82 (n = 4); P subtype, CORL311, NCI-H1048, NCI-H211, NCI-H526 (n = 4); Y subtype, NCI-H1339, NCI-H2286, NCI-H841, SW1271 (n = 4). Center line: median; top and bottom hinges of box: the third and first quantiles; whiskers: quartiles ± 1.5 × interquartile range. e) The track example shows the expression levels of PTEN gene in NCI-H526 cells transduced with either non-targeting sgRNA or two distinct POU2AF2 specific sgRNAs. f The mRNA levels of PTEN gene were determined in NCI-H526 cells transduced with either non-targeting sgRNA or two distinct POU2AF2 specific sgRNAs by real time PCR. n = 3 technical replicates. Data are presented as mean values ± standard deviation (SD). Source data are provided as a Source Data file. The NCI-H526 cells were transduced with lentivirus expressing either sgNONT or sgPOU2AF2 after PTEN depletion. The cell viability was determined by cell counting assay. n =2 biologically independent experiments. Source data are provided as a Source Data file (g), and the protein levels of POU2AF2, PTEN, cleaved PARP, and cleaved Caspase 3 were determined by western blot. n  =  2 biologically independent experiments. h Source data are provided as a Source Data file. i The track example shows the loss of BRG1 occupancy at the H3K27me3 marked enhancer region of PTEN gene locus.
Fig. 6
Fig. 6. Inhibition of the ATPase activity of SWI/SNF complex as a viable therapeutic strategy for SCLC treatment.
a The bar plot shows the gene dependency score (retrieved from DepMap database) of subunits of the SWI/SNF complex in NCI-H526 cells. b Three different SCLC-P cell line NCI-H526, NCI-H211, and CORL311 cells were treated with either DMSO or 1 μM BRM014 for 24 hours. The mRNA levels of PTEN were determined by real time PCR. n = 3 technical replicates. Data are presented as mean values ± standard deviation (SD). Source data are provided as a Source Data file. c The NCI-H526 cell line was treated with various concentrations of BRM014 for 24 hours. The protein levels of PTEN were determined by western blot. The total Histone H3 was used as internal control. n = 2 biologically independent experiments. Source data are provided as a Source Data file. d PTEN was depleted by two distinct sgRNAs in NCI-H526 cells. Then the cells were treated with different concentrations of BRM014 for 72 hours. The cell viability was determined by CellTiter-Glo Luminescent Cell Viability Assay. Data are presented as mean values ± standard deviation (SD). n = 3 biologically independent experiments. Source data are provided as a Source Data file. e 5.0 × 106 of NCI-H526 cells were inoculated into the right flank of nude mice. Two weeks after inoculation, vehicle (n = 7) or 7.5 mg/kg of BRM014 (n = 7) was administered daily by intraperitoneal (IP) injections, and the tumor growth was measured every 2 days using a calibrated caliper. Data are represented as mean ± SEM. A two-tailed unpaired Student’s t-test was used for statistical analysis. **P < 0.01; *P < 0.05. Source data are provided as a Source Data file. f Images of representative tumors from each mouse were taken at the end of the experiment. Source data are provided as a Source Data file. g The total RNA was extracted from each tumor at the end of the experiment. The mRNA levels of PTEN, TAS1R3, IRAG2, AVIL, and NREP were determined by real time PCR. n = 3 technical replicates. A two-tailed unpaired Student’s t-test was used for the statistical analysis. **p < 0.01; *p < 0.05. Center line: median; top and bottom hinges of box: the third and first quantiles; whiskers: quartiles ± 1.5 × interquartile range. The P-value for gene expression difference between DMSO and BRM014 group was calculated as follows: PTEN (P = 0.011), TAS1R3 (P = 0.0422), IRAG2 (P = 0.0072), AVIL (P = 0.0097), and NREP (P = 0.0367). Source data are provided as a Source Data file. h The graphic model shows how POU2AF2 establishes the poised enhancer via SWI/SNF activity-dependent recruitment of the Polycomb complex in SCLC-P subtype cells.

Similar articles

Cited by

References

    1. Sung H, et al. Global Cancer Statistics 2020: GLOBOCAN estimates of incidence and mortality worldwide for 36 cancers in 185 countries. CA Cancer J. Clin. 2021;71:209–249. doi: 10.3322/caac.21660. - DOI - PubMed
    1. Gardner EE, et al. Chemosensitive relapse in small cell lung cancer proceeds through an EZH2-SLFN11 Axis. Cancer Cell. 2017;31:286–299. doi: 10.1016/j.ccell.2017.01.006. - DOI - PMC - PubMed
    1. Gazdar AF, Bunn PA, Minna JD. Small-cell lung cancer: what we know, what we need to know and the path forward. Nat. Rev. Cancer. 2017;17:725–737. doi: 10.1038/nrc.2017.87. - DOI - PubMed
    1. Rudin CM, Brambilla E, Faivre-Finn C, Sage J. Small-cell lung cancer. Nat. Rev. Dis. Primers. 2021;7:3. doi: 10.1038/s41572-020-00235-0. - DOI - PMC - PubMed
    1. Miller KD, et al. Cancer treatment and survivorship statistics, 2022. Ca-Cancer J. Clin. 2022;72:409–436. doi: 10.3322/caac.21731. - DOI - PubMed

Substances