

Obesity affects brain cortex gene expression in an APOE genotype and sex dependent manner
- PMID: 38454009
- PMCID: PMC11379128
- DOI: 10.1038/s41366-024-01481-y
Obesity affects brain cortex gene expression in an APOE genotype and sex dependent manner
Abstract
Objective: Obesity is the top modifiable risk factor for Alzheimer's disease. We hypothesized that high fat diet (HFD)-induced obesity alters brain transcriptomics in APOE-genotype and sex dependent manners. Here, we investigated interactions between HFD, APOE, and sex, using a knock-in mouse model of the human APOE3 and APOE4 alleles.
Methods: Six-month-old APOE3-TR and APOE4-TR mice were treated with either HFD or control chow. After 4 months, total RNA was extracted from the cerebral cortices and analyzed by poly-A enriched RNA sequencing on the Illumina platform.
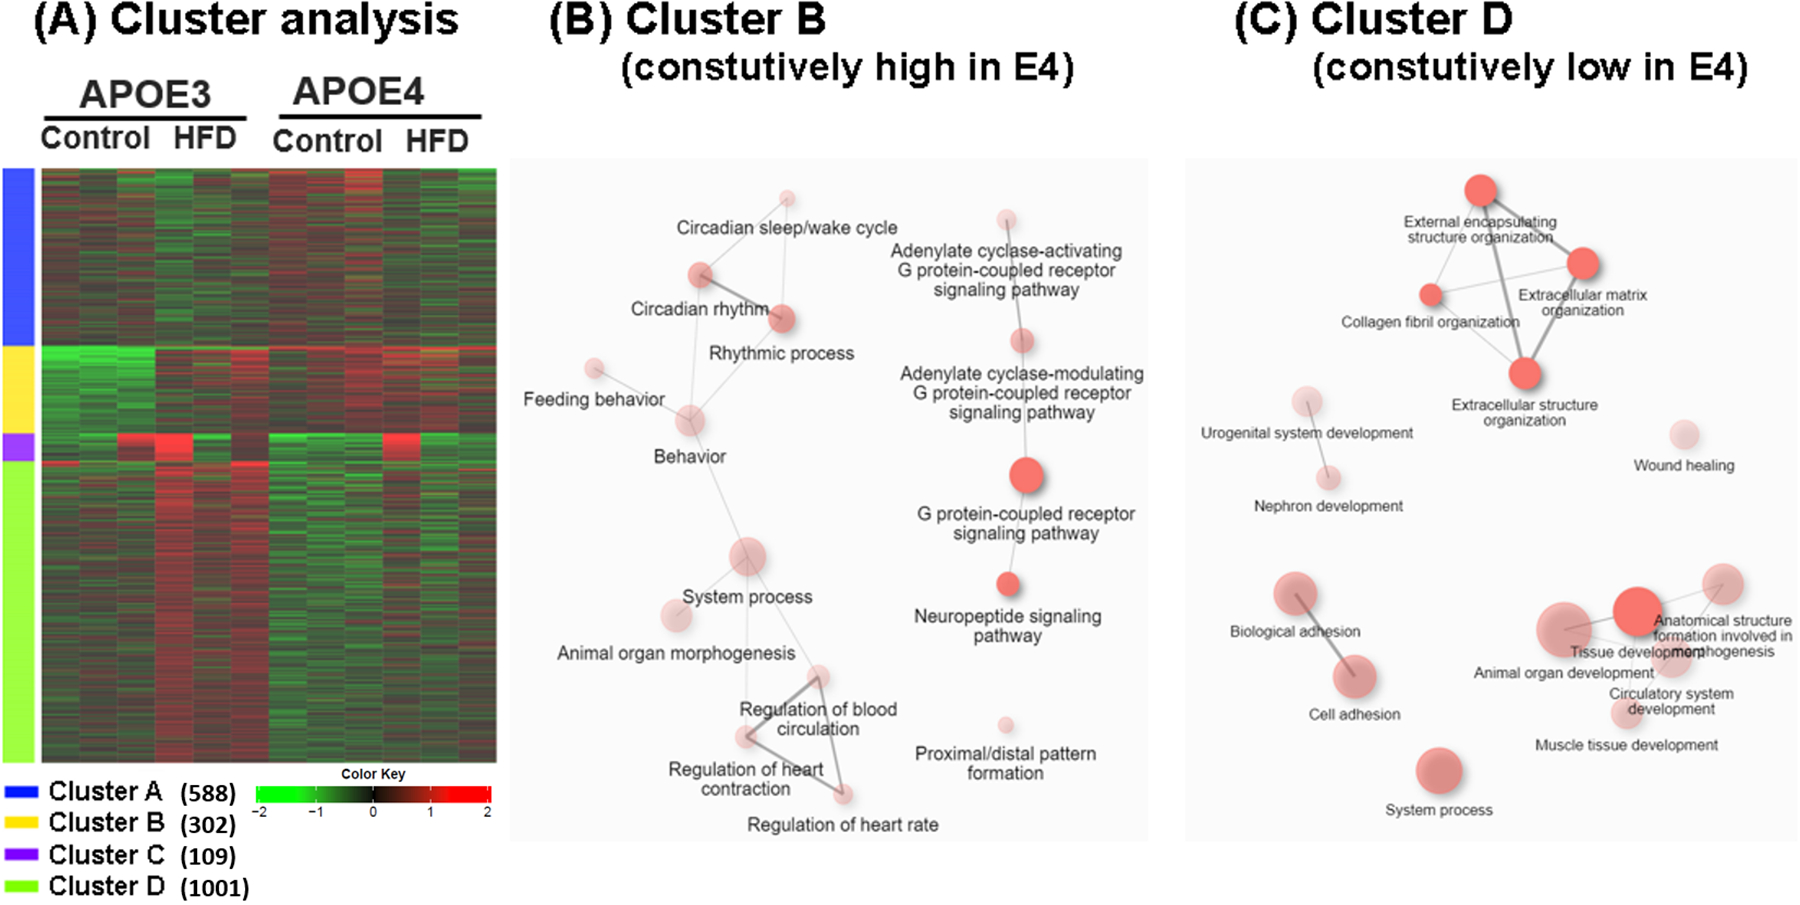
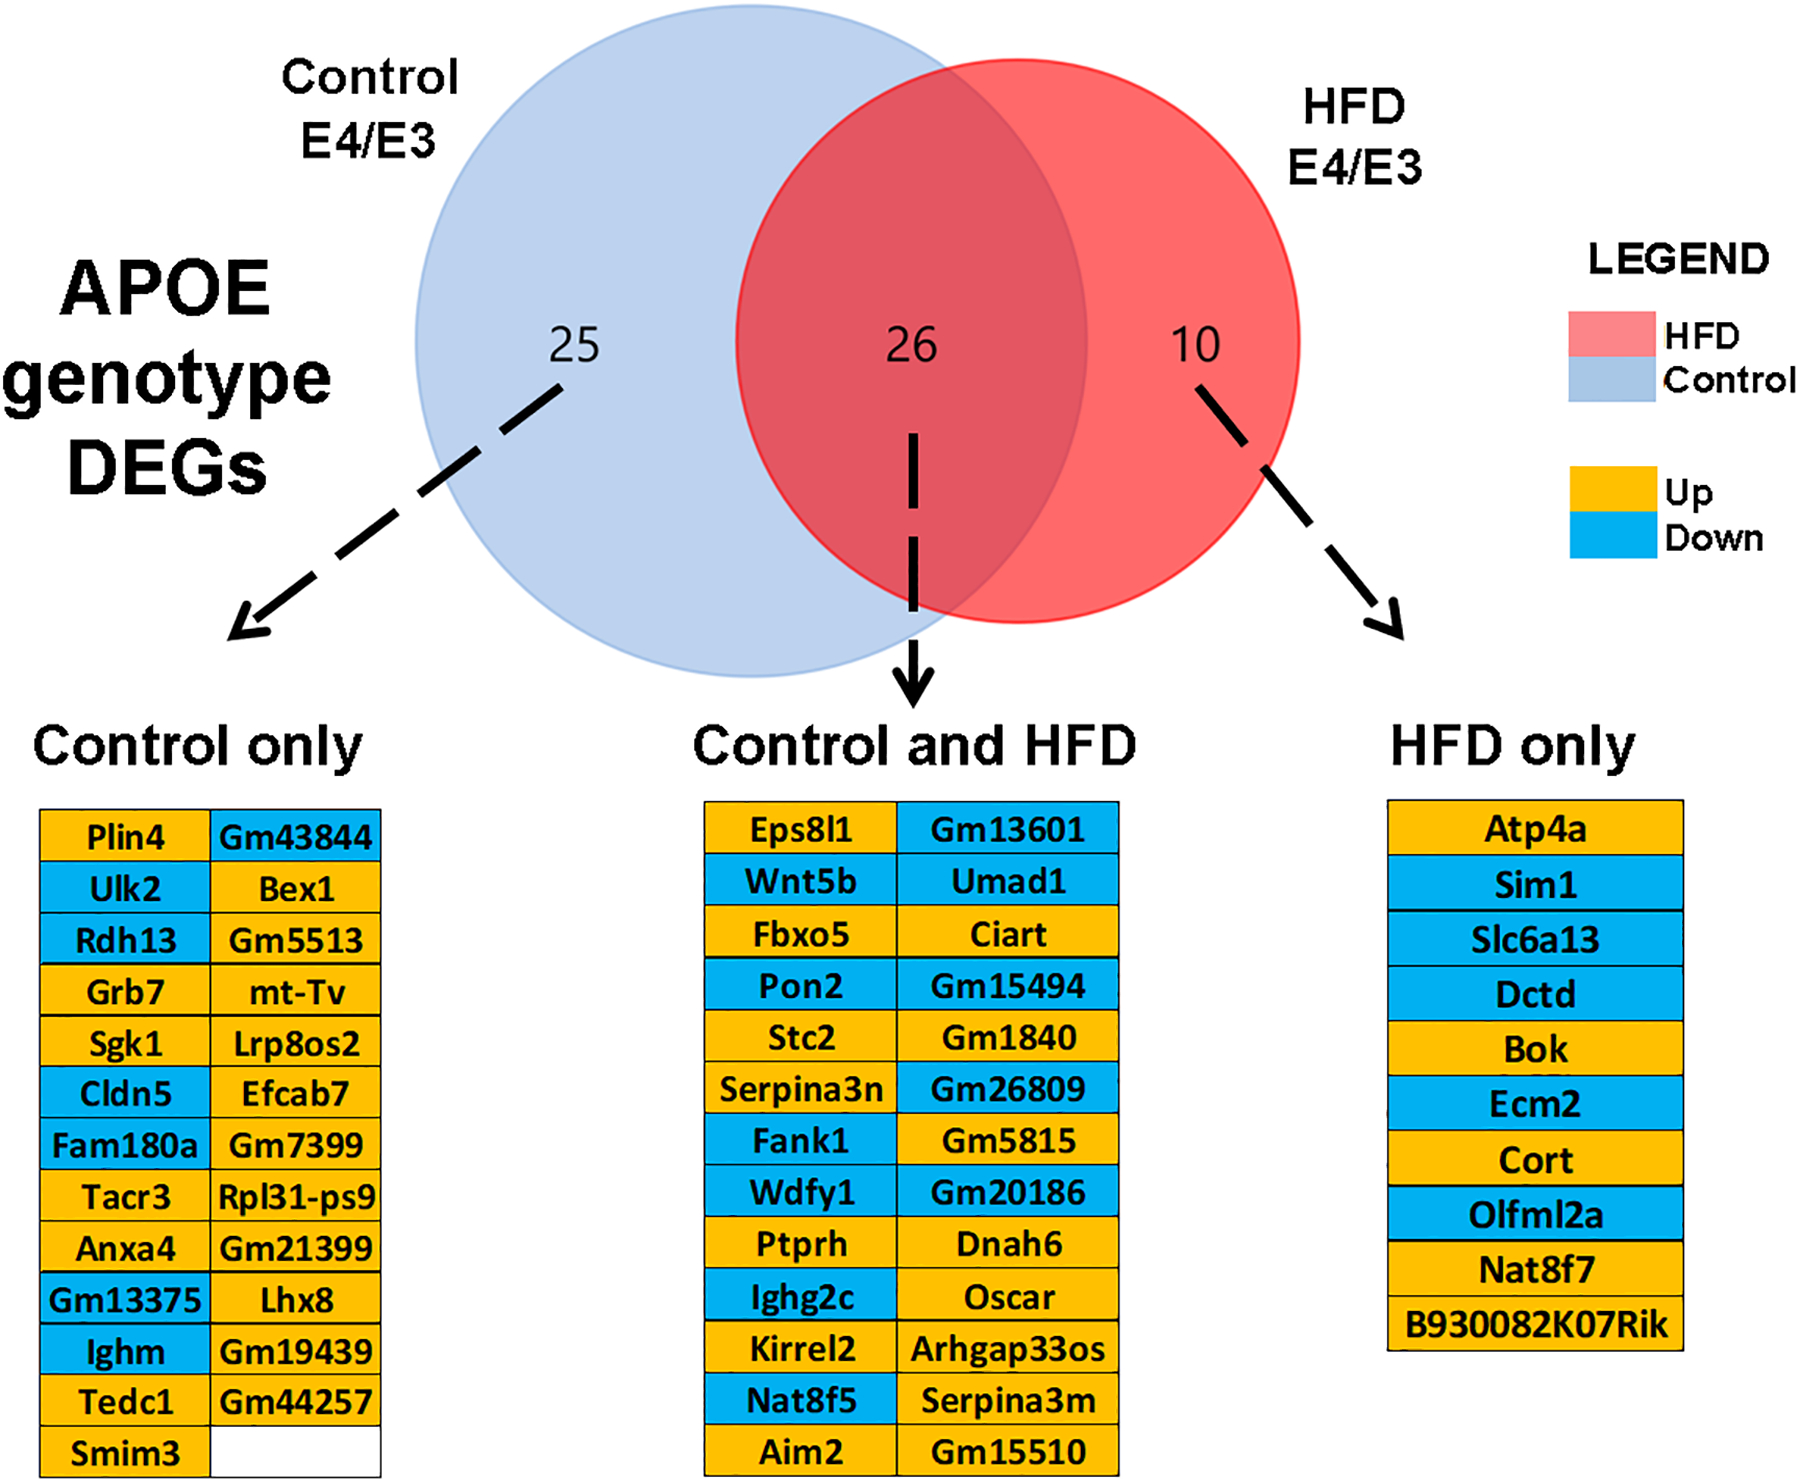
Results: Female mice demonstrated profound HFD-induced transcriptomic changes while there was little to no effect in males. In females, APOE3 brains demonstrated about five times more HFD-induced transcriptomic changes (399 up-regulated and 107 down-regulated genes) compared to APOE4 brains (30 up-regulated and 60 down-regulated). Unsupervised clustering analysis revealed two gene sets that responded to HFD in APOE3 mice but not in APOE4 mice. Pathway analysis demonstrated that HFD in APOE3 mice affected cortical pathways related to feeding behavior, blood circulation, circadian rhythms, extracellular matrix, and cell adhesion.
Conclusions: Female mice and APOE3 mice have the strongest cortical transcriptomic responses to HFD related to feeding behavior and extracellular matrix remodeling. The relative lack of response of the APOE4 brain to stress associated with obesity may leave it more susceptible to additional stresses that occur with aging and in AD.
© 2024. The Author(s), under exclusive licence to Springer Nature Limited.
Conflict of interest statement
DISCLOSURE (CONFLICT OF INTERESTS)
The authors declare that they have no conflict of interest with the contents of this article.
Figures


Similar articles
-
High-fat diet increases gliosis and immediate early gene expression in APOE3 mice, but not APOE4 mice.J Neuroinflammation. 2021 Sep 18;18(1):214. doi: 10.1186/s12974-021-02256-2. J Neuroinflammation. 2021. PMID: 34537055 Free PMC article.
-
Central and Peripheral Mechanisms in ApoE4-Driven Diabetic Pathology.Int J Mol Sci. 2020 Feb 14;21(4):1289. doi: 10.3390/ijms21041289. Int J Mol Sci. 2020. PMID: 32075060 Free PMC article.
-
Accumulation of amyloid-β in the brain of mouse models of Alzheimer's disease is modified by altered gene expression in the presence of human apoE isoforms during aging.Neurobiol Aging. 2023 Mar;123:63-74. doi: 10.1016/j.neurobiolaging.2022.12.003. Epub 2022 Dec 17. Neurobiol Aging. 2023. PMID: 36638682
-
Effect of Chronic Cadmium Exposure on Brain and Liver Transporters and Drug-Metabolizing Enzymes in Male and Female Mice Genetically Predisposed to Alzheimer's Disease.Drug Metab Dispos. 2022 Oct;50(10):1414-1428. doi: 10.1124/dmd.121.000453. Epub 2022 Jul 25. Drug Metab Dispos. 2022. PMID: 35878927 Free PMC article.
-
Metabolic Disturbances of a High-Fat Diet Are Dependent on APOE Genotype and Sex.eNeuro. 2019 Oct 16;6(5):ENEURO.0267-19.2019. doi: 10.1523/ENEURO.0267-19.2019. Print 2019 Sep/Oct. eNeuro. 2019. PMID: 31554665 Free PMC article.
Cited by
-
Effects of obesity on aging brain and cognitive decline: A cohort study from the UK Biobank.IBRO Neurosci Rep. 2025 Jan 5;18:148-157. doi: 10.1016/j.ibneur.2025.01.001. eCollection 2025 Jun. IBRO Neurosci Rep. 2025. PMID: 39896714 Free PMC article.
-
Effects of obesogenic diet and 17β-estradiol in female mice with APOE 3/3, 3/4, and 4/4 genotypes.Front Aging Neurosci. 2024 Sep 13;16:1415072. doi: 10.3389/fnagi.2024.1415072. eCollection 2024. Front Aging Neurosci. 2024. PMID: 39347015 Free PMC article.
References
-
- Association As. 2022 Alzheimer’s disease facts and figures. Alzheimers Dement. 2022;18(4):700–89. - PubMed
-
- Braak H, Del Tredici K. The preclinical phase of the pathological process underlying sporadic Alzheimer’s disease. Brain. 2015;138(Pt 10):2814–33. - PubMed
-
- Hyman BT, Van Hoesen GW, Damasio AR, Barnes CL. Alzheimer’s disease: cell-specific pathology isolates the hippocampal formation. Science. 1984;225(4667):1168–70. - PubMed
-
- Farrer LA, Cupples LA, Haines JL, Hyman B, Kukull WA, Mayeux R, et al. Effects of age, sex, and ethnicity on the association between apolipoprotein E genotype and Alzheimer disease. A meta-analysis. APOE and Alzheimer Disease Meta Analysis Consortium. JAMA. 1997;278(16):1349–56. - PubMed
Publication types
MeSH terms
Substances
Grants and funding
LinkOut - more resources
Full Text Sources
Medical
Miscellaneous
