. 2024 Mar 7;7(1):283.
doi: 10.1038/s42003-024-05969-1.

SAM68 directs STING signaling to apoptosis in macrophages

Affiliations

SAM68 directs STING signaling to apoptosis in macrophages

Demi van der Horst et al. Commun Biol. .

Abstract

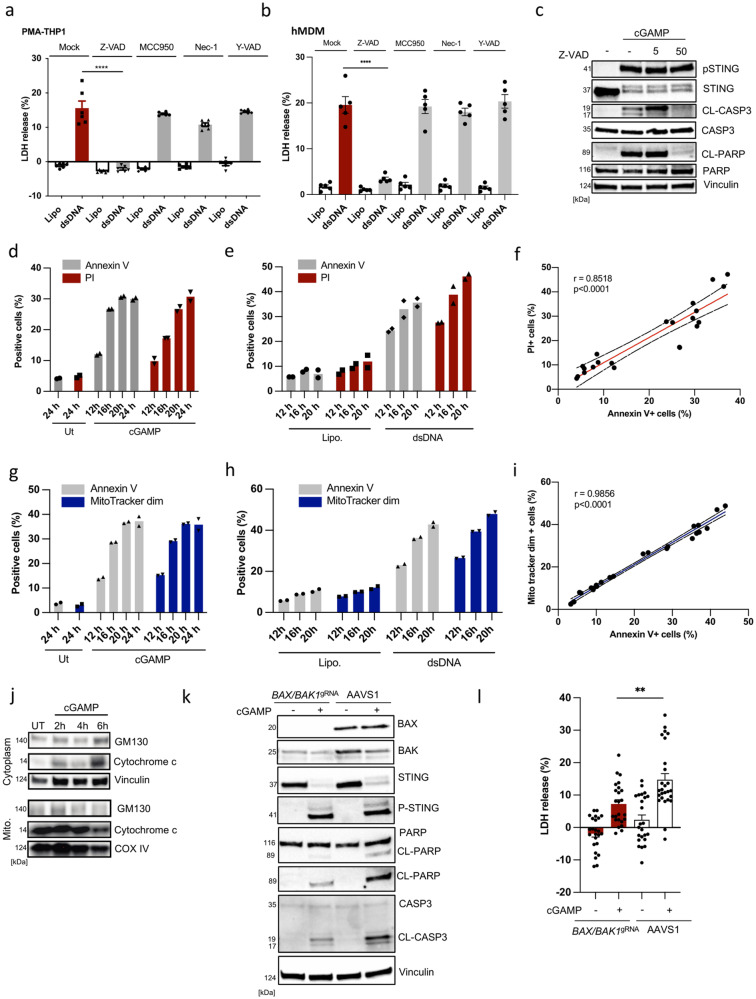
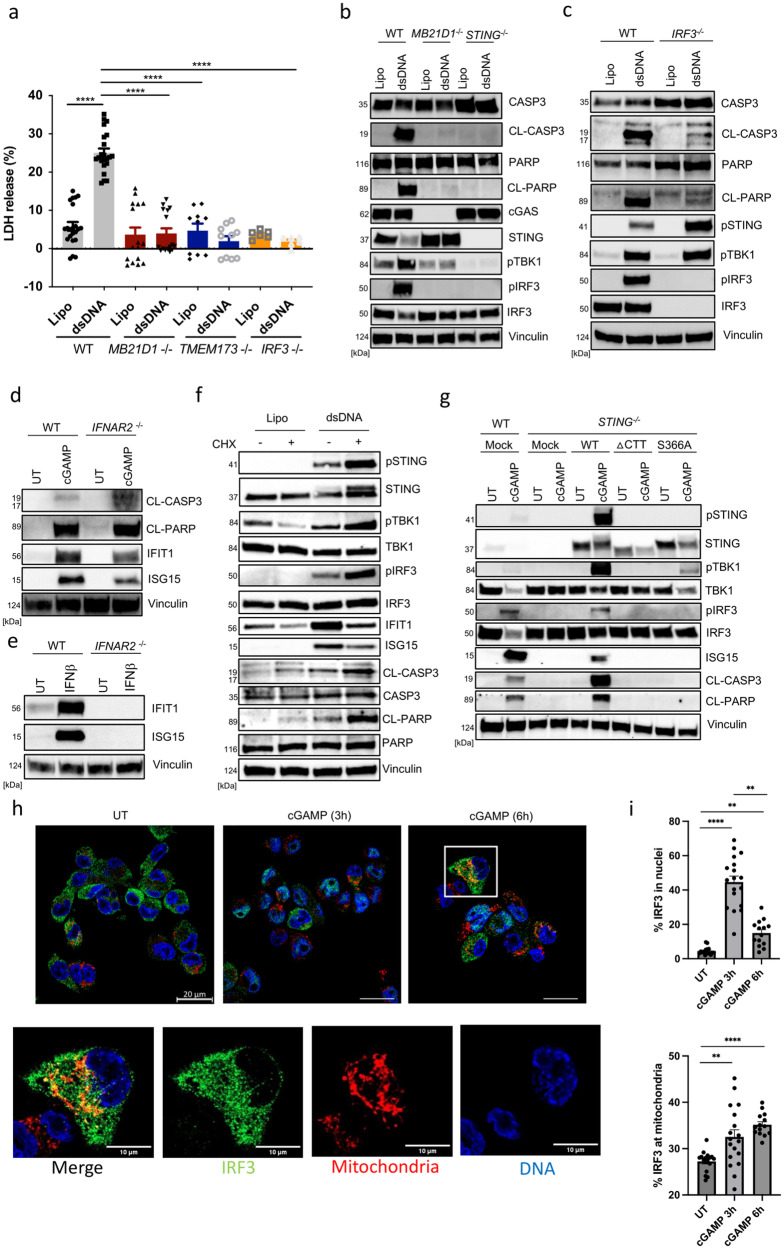
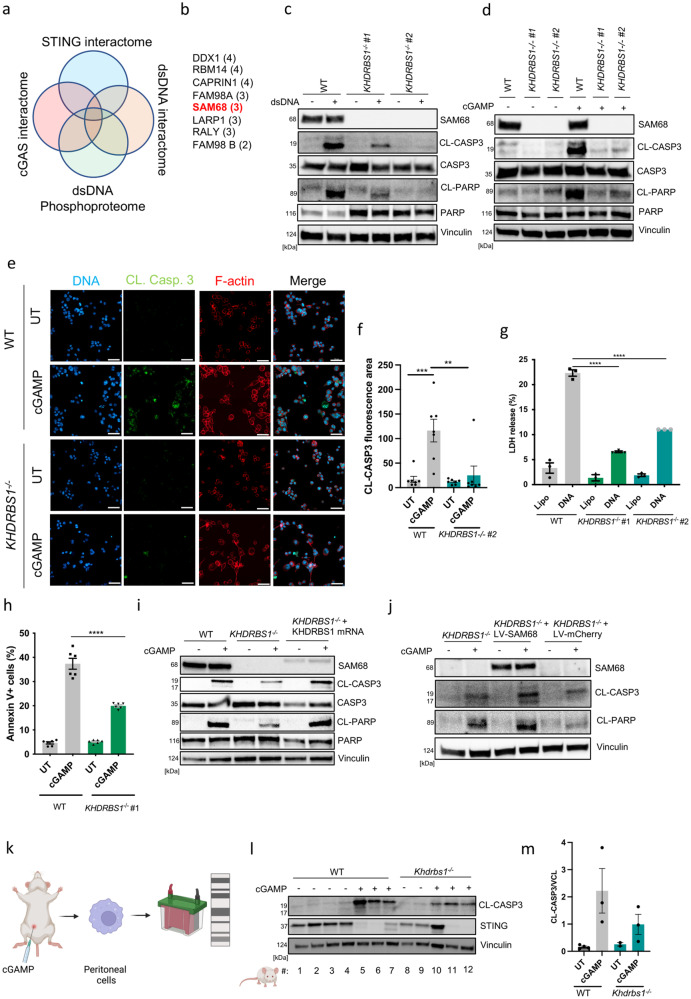
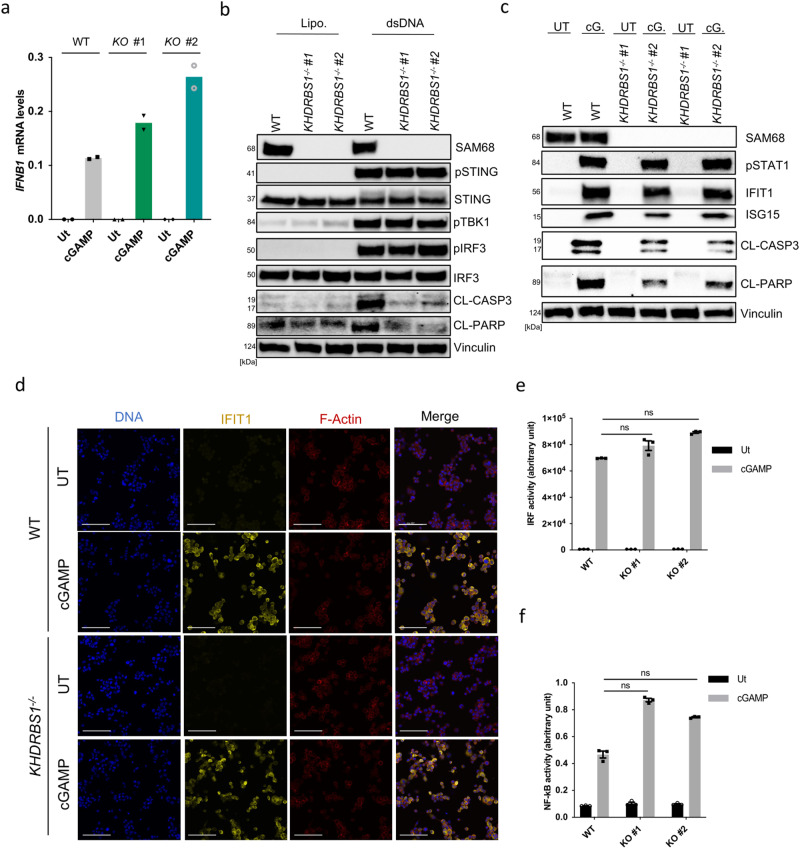
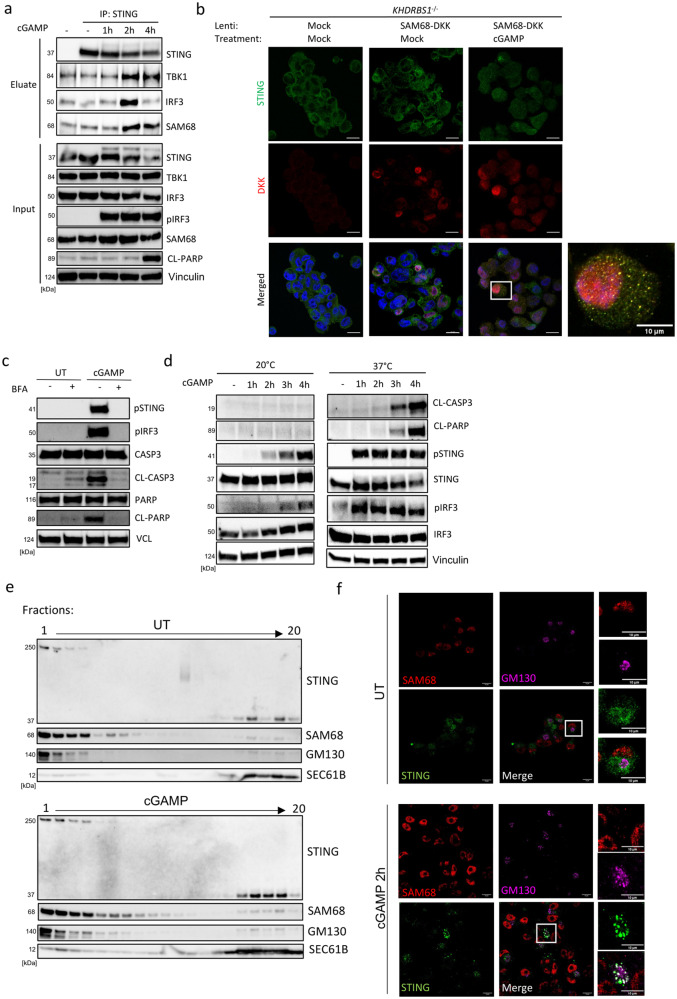
DNA is a danger signal sensed by cGAS to engage signaling through STING to activate innate immune functions. The best-studied downstream responses to STING activation include expression of type I interferon and inflammatory genes, but STING also activates other pathways, including apoptosis. Here, we report that STING-dependent induction of apoptosis in macrophages occurs through the intrinsic mitochondrial pathway and is mediated via IRF3 but acts independently of gene transcription. By intersecting four mass spectrometry datasets, we identify SAM68 as crucial for the induction of apoptosis downstream of STING activation. SAM68 is essential for the full activation of apoptosis. Still, it is not required for STING-mediated activation of IFN expression or activation of NF-κB. Mechanistic studies reveal that protein trafficking is required and involves SAM68 recruitment to STING upon activation, with the two proteins associating at the Golgi or a post-Golgi compartment. Collectively, our work identifies SAM68 as a STING-interacting protein enabling induction of apoptosis through this DNA-activated innate immune pathway.


Conflict of interest statement

The authors declare no competing interests.

Figures

Fig. 1
Fig. 1. STING induces cell death through the mitochondrial apoptosis pathway in monocytes/macrophages.
a PMA-differentiated THP1 cells (PMA-THP1) were treated with Z-VAD, MCC950, Nec-1, and Y-VAD at 10 μM for 1 h prior to transfection with dsDNA (4 μg.mL−1). LDH release was assessed in the culture supernatants 9 h post dsDNA treatment. Data are the means ± SEM of three independent experiments performed in biological duplicates. b Human monocyte-derived macrophages (hMDM) were treated with Z-VAD, MCC950, Nec-1, and Y-VAD at 10 μM for 1 h prior to transfection with dsDNA (4 μg.mL−1). LDH release was assessed in the culture supernatants 16 h post dsDNA treatment. The data are the means ± SEM of one experiment performed in five biological replicates from one PBMC donor. c PMA-THP1 cells were treated with Z-VAD (5 or 50 μM) for 1 h following exogenous stimulation with cGAMP (100 μg.mL−1) for 5 h. Cells were lysed and immunoblotted for the indicated proteins (n = 3). CL cleaved; pSTING (phosphorylated STING). de PMA-THP1 cells were treated with dsDNA (4 μg.mL−1) and cGAMP (100 μg.mL−1) for the indicated time intervals and evaluated for staining for Annexin V and Propidium Iodide (PI) by flow cytometry. Data are from one representative experiment performed in biological duplicates. Experiment has been repeated twice with a similar trend. f Illustration of data presented in panel D and E as PI+ versus Annexin V+. g, h THP1 cells were treated with exogenous cGAMP (100 μg.mL−1) or dsDNA (4 μg.mL−1) for the indicated time intervals and evaluated for staining of Annexin V and Mitotracker by flow cytometry. Data are from one representative experiment performed in biological duplicates. Experiment has been repeated twice with a similar trend. i Illustration of data presented in panel D and E as Mitotrackerdim versus Annexin V+. j PMA-THP1 cells were treated with exogenous cGAMP (100 μg.mL−1) for the indicated time intervals. Cytoplasmic and mitochondrial lysates were monitored for the indicated proteins by Immunoblotting (n = 3). k, l THP1 cells were treated with Cas9-gRNA RNP complexes targeting AAVS1 or a combination of BAX and BAK1 gRNA and treated with cGAMP (100 μg.mL−1) for 5 h in k and 19 h in l. Cell survival was monitored by LDH release assay in l and immunoblotting for cleavage of Caspase 3 and PARP in k. Data are the means ± SEM of four independent experiments performed in biological triplicates or duplicates (l). Data are from one representative experiment in k that has been performed twice. Statistical analysis of the data in a, b, and l was performed using a two-tailed one-way ANOVA followed by Sidak’s multiple comparison test. Vertical stacks of bands are not derived from the same membrane in c, j and k.
Fig. 2
Fig. 2. STING operates through IRF3 to trigger apoptosis in THP1 macrophages.
a Parental, cGAS KO, STING KO, and IRF3 KO PMA-THP1 cells were transfected with dsDNA (4 μg.mL−1). LDH release was assessed in the culture supernatants 9 h post dsDNA treatment. Data are the means ± SEM of four independent experiments performed in four to six biological replicates. bd WT, cGAS−/−, STING−/−, IRF3−/−, TBK1−/−, and IFNAR2−/− PMA-THP1 cells were treated with dsDNA (4 μg.mL−1) or cGAMP (100 μg.mL−1) for 5 h, and lysates were immunoblotted for the indicated protein (n = more than 3 for most of the KO cell lines tested). CL cleaved, pSTING phosphorylation at S366, pTBK1 phosphorylation as S172, pIRF3 phosphorylation at S396. e WT and IFNAR2−/− PMA-THP1 cells were treated with IFNβ (100 units/mL) for 1 h, and lysates were immunoblotted for the indicated protein (n = 2). f PMA-THP1 cells were treated with cycloheximide (CHX) (1 μg.mL−1) for 1 h and transfected with dsDNA (4 μg.mL−1). Lysates isolated 3 h post dsDNA transfection were immunoblotted for the indicated protein (n = 3). pIRF3, phosphorylated IRF3 (S396). CL, cleaved. g STING-deficient THP1 cells were transduced with lentivirus encoding WT, ΔCTT or S366A STING. The cells were treated with cGAMP (100 μg.mL−1) for 3 h and lysates were immunoblotted for the indicated proteins (n = 2). CL cleaved, p phospho. h PMA-THP1 cells were treated with cGAMP (100 μg.mL−1) for the indicated period of times, and stained for DNA, IRF3 and mitochondria. Cells were visualized by confocal microscopy (n = 3). Scale bars, 20 μm. White box indicates the region of interest which was selected by the rectangular function in ImageJ and displayed as separate images, the scalebar corresponds to 10 μm. i Quantification of the percentage of IRF3 area within nuclei or mitochondria from h. Data are the means ± SEM of three independent experiments. Statistical analysis of the data in a and i was performed using a two-tailed one-way ANOVA followed by Sidak’s multiple comparison test. Vertical stacks of bands are not derived from the same membrane in bg.
Fig. 3
Fig. 3. SAM68/KHDRBS1 is essential for induction of apoptosis downstream of STING.
a Venn diagrams illustrating data sets included in the screen and selection criteria. b Proteins fulfilling the selection criteria. number in brackets, indicate the number of data sets in which the individual proteins were identified. c, d WT and KHDRBS1−/− (SAM68) PMA-THP1 cells (two different clones) were treated with dsDNA (4 μg.mL−1) or cGAMP (100μg.mL−1) for 5 h, and lysates were immunoblotted for the indicated proteins. (n = 3). CL cleaved. e WT and KHDRBS1−/− PMA-THP1 cells were treated with cGAMP (100 μg.mL−1) for 5 h, fixed, and were stained for cleaved caspase 3 (CL-CASP3) and visualized by confocal microscopy (n = 2). Scale bars, 50 μm. f Quantification of data from panel e. Pixel density from the CL-CASP3 staining was evaluated using ImageJ software. The data are represented as total CL-CASP3 immunofluorescent area. Data are the means ± SEM of two independent experiments. g WT and KHDRBS1−/− PMA-THP1 cells were stimulated with dsDNA (4 μg.mL−1) for 9 h. Levels of cell death were evaluated by LDH release assay. Data are the means ± SEM of one representative experiment performed in biological triplicates. Experiment has been repeated twice with a similar trend. h WT and KHDRBS1−/− THP1 cells were stimulated with cGAMP (100 μg.mL−1) for 18 h. Levels of apoptosis were evaluated by annexin V staining and flow cytometry. Data are the means ± SEM of two experiments performed in biological triplicates. i KHDRBS1−/− (SAM68) THP1 cells were transfected with mRNA encoding SAM68 and subjected to PMA-differentiation in parallel with WT and KHDRBS1−/− THP1 cells. The cells were stimulated with cGAMP (100 μg.mL−1) for 5 h, and evaluated for the specific proteins by immune blotting. (n = 2). CL cleaved. j KHDRBS1−/− (SAM68) THP1 cells were transduced with a lentivirus encoding for SAM68 and subjected to PMA-differentiation. Cells were stimulated with cGAMP (100 μg.mL−1) for 5 h, and evaluated for the specific proteins by immunoblotting. (n = 2). CL cleaved. k Schematic representation of the work layout. Animals were injected intraperitoneally with 2’3’-cGAM(PS)2 (Rp/Sp) (125 μg/mouse). Following cGAMP administration (8 h), peritoneal cells were collected and subjected to immunoblotting. Each line represents an individual animal. This figure was created using BioRender.com. l Peritoneal cells from cGAMP-injected animals were resolved on SDS-PAGE and subjected to immunoblotting. Each line represents an individual animal. m Quantification of CL-CASP3 protein levels presented in l. Statistical analysis of the data in fh was performed using a two-tailed one-way ANOVA followed by Sidak’s multiple comparison test. Vertical stacks of bands are not derived from the same membrane in c, d, i, j and l.
Fig. 4
Fig. 4. SAM68 is not involved in STING-dependent activation of the IFN and NF-κB responses.
a WT and KHDRBS1−/− PMA-THP1 cells were treated with cGAMP (100 μg.mL−1) for 5 h. RNA was isolated and examined for levels of IFNB1. The data are the means of one experiment performed in biological duplicates. b, c WT and KHDRBS1−/− PMA-THP1 cells were treated with dsDNA (4 μg.mL−1) and cGAMP (100 μg.mL−1) for 5 h and 18 h, respectively. Lysates were immunoblotted for the indicated proteins (n = 3). pSTING phosphorylation at S366, pTBK1 phosphorylation as S172, pIRF3 phosphorylation at S396, pSTAT1 phosphorylation at Y701. d WT and KHDRBS1−/− THP1 cells were treated with cGAMP (100 μg.mL−1) for 5 h, fixed stained with antibodies against IFIT1 and actin, and visualized by fluorescence microscopy (n = 1). Scale bars, 100 μm. e, f WT and KHDRBS1−/− PMA-THP1 cells were treated with cGAMP (100 μg.mL−1) for 5 h, IRF and NF-κB gene activities were measured as reported in the methodological section (n = 3). Statistical analysis of the data performed on means ± SEM in e and f and assessed using a two-tailed one-way ANOVA followed by Sidak’s multiple comparison test. Vertical stacks of bands are not derived from the same membrane in b and c.
Fig. 5
Fig. 5. SAM68 links the STING-IRF3 complex to the mitochondrial apoptosis pathway.
a PMA-THP1 cells were treated with cGAMP (100 μg.mL−1) for 1, 2, and 4 h, and lysates were subjected to immunoprecipitation with anti-STING antibodies and immunoblotted for the indicated proteins (n = 2). CL, cleaved. b KHDRBS1-deficient PMA-THP1 cells reconstituted with a lenti-DKK-tagged SAM68 were treated with cGAMP (100 μg.mL−1) for 5 h, fixed, stained with anti-STING and anti-DKK, and visualized by fluorescence microscopy (n = 2). Scale bars, 20 μm. White box indicates the region of interest which was selected by the rectangular function in ImageJ and displayed as separate images, the scalebar corresponds to 10 μm. c PMA-THP1 cells were pre-treated with Brefeldin A (BFA) 3 μg.mL−1 for 30 min prior to cGAMP challenge (100 μg.mL−1) for 5 h. Cell lysates were immunoblotted for the indicated proteins (n = 2). CL, cleaved. pSTING, phosphorylation at S366; pIRF3, phosphorylation at S396. d PMA-THP1 cells were treated with cGAMP (100 μg.mL−1) at 20 °C or 37 °C for 1, 2, 3, and 4 h, and lysates were immunoblotted for the indicated proteins (n = 2). CL, cleaved. pSTING, phosphorylation at S366; pIRF3, phosphorylation at S396. e ER- and Golgi-enriched pellets from mock- or cGAMP-treated cells were fractionated and immunoblotted for STING, SAM68, GM130 (Golgi) and Sec61B (ER) (n = 2). f WT PMA-THP1 cells were treated with cGAMP (100 μg.mL−1) for 2 h, and stained for STING, SAM68 and the Golgi marker GM130. Cells were visualized by confocal microscopy (n = 3). Scale bars, 10 μm. White box indicates the region of interest which was selected by the rectangular function in ImageJ and displayed as separate images, the scalebar corresponds to 10 μm. Vertical stacks of bands are not derived from the same membrane in a, c, d and e.

References

    1. Tan X, Sun L, Chen J, Chen ZJ. Detection of Microbial Infections Through Innate Immune Sensing of Nucleic Acids. Annu. Rev. Microbiol. 2018;72:447–478. doi: 10.1146/annurev-micro-102215-095605. - DOI - PubMed
    1. Isaacs A, COX RA, ROTEM Z. Foreign nucleic acids as the stimulus to make interferon. Lancet. 1963;2:113–116. doi: 10.1016/S0140-6736(63)92585-6. - DOI - PubMed
    1. ROTEM Z, COX RA, Isaacs A. Inhibition of virus multiplication by foreign nucleic acid. Nature. 1963;197:564–566. doi: 10.1038/197564a0. - DOI - PubMed
    1. Hemmi H, et al. A Toll-like receptor recognizes bacterial DNA. Nature. 2000;408:740–745. doi: 10.1038/35047123. - DOI - PubMed
    1. Hornung V, et al. AIM2 recognizes cytosolic dsDNA and forms a caspase-1-activating inflammasome with ASC. Nature. 2009;458:514–518. doi: 10.1038/nature07725. - DOI - PMC - PubMed

Publication types