. 2024 Apr;26(4):542-551.
doi: 10.1038/s41556-024-01373-3. Epub 2024 Mar 7.

Loss of WIPI4 in neurodegeneration causes autophagy-independent ferroptosis

Affiliations

Loss of WIPI4 in neurodegeneration causes autophagy-independent ferroptosis

Ye Zhu et al. Nat Cell Biol. 2024 Apr.

Abstract

β-Propeller protein-associated neurodegeneration (BPAN) is a rare X-linked dominant disease, one of several conditions that manifest with neurodegeneration and brain iron accumulation. Mutations in the WD repeat domain 45 (WDR45) gene encoding WIPI4 lead to loss of function in BPAN but the cellular mechanisms of how these trigger pathology are unclear. The prevailing view in the literature is that BPAN is simply the consequence of autophagy deficiency given that WIPI4 functions in this degradation pathway. However, our data indicate that WIPI4 depletion causes ferroptosis-a type of cell death induced by lipid peroxidation-via an autophagy-independent mechanism, as demonstrated both in cell culture and in zebrafish. WIPI4 depletion increases ATG2A localization at endoplasmic reticulum-mitochondrial contact sites, which enhances phosphatidylserine import into mitochondria. This results in increased mitochondrial synthesis of phosphatidylethanolamine, a major lipid prone to peroxidation, thus enabling ferroptosis. This mechanism has minimal overlap with classical ferroptosis stimuli but provides insights into the causes of neurodegeneration in BPAN and may provide clues for therapeutic strategies.


Conflict of interest statement

D.C.R. is a consultant for Drishti Discoveries, PAQ Therapeutics, MindRank AI, Retro Biosciences and Nido Biosciences. All other authors declare no competing interests.

Figures

Fig. 1
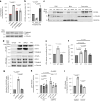
Fig. 1. WIPI4 loss of function induces ferroptosis.
a, LDH release, as a measure of cytotoxicity (n = 5), from control and WIPI4-knockdown SH-SY5Y cells following treatment with dimethylsulfoxide (DMSO; control), 1 µM Z-VAD-fmk (Z-VAD), 10 µM necrostatin-1 (Nec-1), 100 nM liproxstatin-1 (Lip-1) or 1 µM Fer-1 for 48 h. Unless specified otherwise, oligonucleotide J-019758 was used as the siWIPI4 in all experiments. b, Cell viability, measured using AquaBluer (n = 3), of control and WIPI4-knockdown SH-SY5Y cells treated as in a. c, HeLa cells transiently transfected with pSpCas9(BB)-2A-GFP with single guide RNA (sgRNA) targeting WIPI4 exon 3 (sgWIPI4) or its control construct were cultured for 24 h before treatment with N-acetyl-l-cysteine (NAC) or deferoxamine (DFO), at the indicated concentrations, in media containing IncuCyte red dye. The cells were imaged 72 h post transfection. The number of dead cells were determined as the number of red objects per well normalized to that of the scramble and spCas9 control construct-transfected cells treated with DMSO (n = 3). d, Levels of MDA of control and WIPI4-knockdown SH-SY5Y cells treated with DMSO or 1 µM Fer-1 for 24 h (n = 3). e, Images of BODIPY581/591C11-stained i3 neurons. On Day 14 of differentiation, the i3 neurons were treated with scramble and anti-human WIPI4 smartpool shRNA (shWIPI4) delivered by PLKO.1 packaged in lentivirus for 24 h, followed by treatment with 5 µM Fer-1 or DMSO in fresh media without virus for another 24 h before imaging. Scale bars, 10 µm. f, Average ratio of the intensities of the 510 and 591 nm emissions quantified from the images in e (n = 5; ≥5 fields imaged per experiment). ad,f, Data are the normalized mean ± s.d.; two-tailed one-sample Student’s t-test for comparisons with the control and two-tailed paired Student’s t-test for comparisons with other samples (ad); two-tailed paired Student’s t-test (f); *P < 0.05 and **P < 0.01. Scr, scramble; n, number of biologically independent experiments. Source numerical data are provided. Source data
Fig. 2
Fig. 2. WIPI4 loss of function induces ferroptosis in zebrafish.
a, Zebrafish juveniles with wdr45 knockdown (wdr45 KD) by CRISPR injection had reduced lifespans compared with their uninjected siblings from the age of 4 weeks. Survival rate of WIPI4 CRISPR mutants and their uninjected siblings over a period of 7 weeks (n = 60 fish per group); log-rank Mantel–Cox test. b, Treatment of rho:EGFP transgenic fish with 10 μM Fer-1 from 5 to 10 d.p.f. rescued the loss of photoreceptors following wdr45 KD by CRISPR injection, whereas Fer-1 did not cause any change in the fluorescence rod area of uninjected fish. Representative images of sections across the eye of 10 d.p.f. rho:EGFP fish injected with wdr45-targeting CRISPRs and their uninjected siblings treated with DMSO or 10 μM Fer-1, respectively. Scale bar, 50 μm. c, Photoreceptor areas from the images in b; n ≥ 23 eyes per group. d, Increase in lipid peroxidation, represented by higher concentrations of MDA, in wild-type fish subjected to wdr45 KD by CRISPR injection at 5 d.p.f. compared with their uninjected siblings; n = 5 biologically independent experiments, 30 fish each. Data are the mean ± s.d. *P < 0.05 and **P < 0.01; two-tailed unpaired Student’s t-test. Source numerical data are provided. Source data
Fig. 3
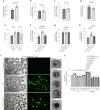
Fig. 3. WIPI4-mediated ferroptosis is autophagy independent but ATG2 dependent.
a, LDH release from SH-SY5Y cells following WIPI4-knockdown and WIPI2-knockdown via siRNA treatment (siWIPI4 and siWIPI2, respectively) in comparison to control cells (n = 3). b, LDH release from siWIPI4- and scramble siRNA (scr)-treated ATG16L1-KO and control (wild-type, WT) HeLa cells (n = 3). c, Rod photoreceptor area of rho:EGFP zebrafish retinas at 10 d.p.f. showing the autophagy-independent effect of wdr45-targeting CRISPR knockdown via injection with wdr45-targeting CRISPR guides (wdr45 KD). We analysed cryosections across fish retinas of uninjected zebrafish larvae and their siblings injected with either wdr45 KD or atg7-targeting CRISPR guides (atg7 KD), or both in combination, followed by treatment with DMSO or 10 μM Fer-1 at 5–10 d.p.f. Data are the mean ± s.d.; n = 22 eyes per group; two-tailed unpaired Student’s t-test. d, Representative images of rho:EGFP zebrafish retinas at 10 d.p.f. showing the autophagy-independent effect of wdr45 KD. Scale bar, 50 μm. e, ATG2A/B WT or CRISPR KO (ATG2A/B KO) HeLa cells were transfected with control siRNA or siWIPI4 for 72 h and subjected to an LDH assay (n = 3). f, MDA analysis of the cells in e (n = 3). Controls normalised to 100. g, Cell viability of ATG2A/B KO HeLa cells transfected with GFP or GFP–ATG2A for 24 h and treated with 100 nM Lip-1 or 1 µM Fer-1 for 20 h following a medium change (n = 3). h, LDH release from control and WIPI4-knockdown HeLa cells transfected with GFP, GFP–WIPI4 WT or LOOP3 siRNA-resistant mutant (ΔLOOP3; n = 4). a,b,eh, Data are the normalized mean ± s.d.; n, number of biologically independent experiments; two-tailed one-sample Student’s t-test for comparisons to the control and two-tailed paired Student’s t-test for comparisons between other samples. *P < 0.05 and **P < 0.01. Source numerical data are provided. Source data
Fig. 4
Fig. 4. WIPI4 depletion mislocalizes ATG2.
a, Average duration of GFP–ATG2 and RFP–LC3 co-localization in HeLa cells stably expressing RFP–LC3 quantified from videos taken of living cells (n = 3 independent biological repeats; ≥3 co-localization events in different cells imaged per experiment). The maximum length of each video was 140 s. Data are the mean ± s.d.; two-tailed paired Student’s t-test. b, HeLa cells transfected with control siRNA or siWIPI4 were subjected to cell fractionation and immunoblotted with antibodies to the indicated proteins. For fractionation, isotonic buffer was used. Mitochondria were collected as pellets resuspended in PBS. This may explain the different mobility of WIPI4 in these different fractions. PNS, post-nuclear supernatant; mito, mitochondrial fraction; post-mito, post mitochondrial fraction. c, Pearson’s coefficient of endogenous ATG2A with calnexin in ATG16-KO and wild-type control cells (n = 3 biologically independent experiments; ≥20 fields imaged in each experiment). Data are the normalized mean ± s.d.; two-tailed one-sample Student’s t-test for comparisons to the control and two-tailed paired Student’s t-test for comparisons between other samples. d, ATG2A/B-WT and -KO HeLa cells transfected with control siRNA or siWIPI4 were immunoprecipitated (IP) with endogenous anti-TMEM41b and blotted for ATG2A and TOMM40. *P < 0.05 and **P < 0.01. Source numerical data and unprocessed blots are provided.
Fig. 5
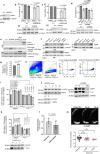
Fig. 5. The ATG2–WIPI4 axis regulates ferroptosis dependent on mitochondria.
a, LDH release from HeLa cells transfected with the indicated siRNAs (n = 3). LDH release was measured 72 h post transfection (top). The western blots show the silencing efficiency of siWIPI4 and siRNA targeting TOMM40 (siTOMM40). b, Ratio of ATG2A levels in the mitochondrial versus post-mitochondrial fractions (n = 4). c, ATG2A/B-KO HeLa cells transfected with GFP, GFP–ATG2A-WT, GFP-ATG2A-ΔMLD or GFP-ATG2A-YFS were subjected to cell fractionation and immunoblotted. d, HeLa cells transfected with GFP, GFP–ATG2A-WT, GFP-ATG2A-ΔMLD or GFP-ATG2A-YFS were immunoprecipitated by GFP-Trap beads and blotted for TOMM40 and WIPI4. e, LDH release from ATG2A/B-KO HeLa cells transfected with GFP, GFP-ATG2A-WT or GFP-ATG2A-ΔMLD (n = 3). f, Levels of MDA in ATG2A/B-KO HeLa cells transfected with GFP, GFP-ATG2A-WT, GFP-ATG2A-ΔMLD or GFP-ATG2A-YFS (n = 4). Control normalised to 100. g, Lipid peroxidation evaluated by MitoPerOx staining of primary neurons (n = 3; ≥5 fields were imaged per sample). The peroxidation levels were calculated as the fluorescence intensities of peroxidized (510 nm emission) signal normalized to total signal (591 nm emission). The values were then normalized to that of scramble DMSO. Mouse primary neurons were cultured for five days before infection with scramble or anti-hWIPI4 smartpool shRNA delivered by lentivirus for 24 h, and then treated with 5 µM inPISD or DMSO in fresh media for one day. h, LDH release of SH-SY5Y cells transfected with control siRNA or siWIPI4 for 72 h, followed by incubation with the indicated concentration of MitoTEMPO (MT) for 48 h (n = 4). i, Mitophagy was induced in HeLa cells stably expressing PARKIN–FLAG with 12.5 µM CCCP for 48 h before transfection with siWIPI4. The cells were then cultured for 24 h in fresh media and LDH release was assessed (n = 3). a,b,ei, Data are the normalized mean ± s.d.; two-tailed one-sample Student’s t-test for comparisons to the control and two-tailed paired Student’s t-test for comparisons between other samples; n, number of biologically independent experiments. WT, GFP–ATG2A-WT; ΔMLD, GFP-ATG2A-ΔMLD; YFS, GFP-ATG2A-YFS. *P < 0.05, **P < 0.01 and ***P < 0.001. Source numerical data and unprocessed blots are provided.
Fig. 6
Fig. 6. Mitochondrial PE levels are increased by ATG2 and depend on its lipid transfer function.
ad, HeLa cells transfected with control siRNA or siWIPI4 were subjected to cell fractionation. Equal amounts of protein samples were then used for PE, PC and PS measurements (a, n = 4; bd, n = 3). e, Unsaturated fatty acid (UFA) levels in the mitochondrial fractions and total lysates of HeLa cells transfected with siWIPI4 or scramble siRNA (n = 3). HeLa cells transiently transfected with pSpCas9(BB)-2A-GFP with sgRNA targeting WIPI4 exon 3 or its control construct were cultured for 48 h before mitochondrial purification and lipid extraction (after calibration to protein concentrations). f,g, Levels of PE in mitochondria (f) and whole-cell lysates (g) of ATG2A/B-KO HeLa cells transfected with GFP, GFP-ATG2A-WT or GFP-ATG2A-LTD (n = 3). h, LDH release from ATG2A/B-KO HeLa cells transfected with GFP, GFP-ATG2A-WT or GFP-ATG2A-LTD (n = 7). i, Representative bright-field (left) and fluorescence (right) images of the phenotypic abnormalities found in clutches injected with 200 pg GFP empty vector or GFP-ATG2A-WT constructs compared with their uninjected siblings at 24 h post fertilization (h.p.f.). Injection of GFP-tagged constructs resulted in green-fluorescent fish with a mosaic pattern. Higher levels of toxicity were observed for the clutches injected with GFP-ATG2A-WT compared with the GFP-injected clutches and their uninjected siblings, as indicated by more dead embryos (eggs containing black dense material) or abnormal phenotypes (yellow arrowheads). The higher-magnification images (right) showcase the range of morphological defects observed. Scale bars, 2 mm (main images showing clutches) and 1 mm (higher-magnification images showing individual embryos). j, Day 15 i3 neurons were pre-treated with DMSO (control), 10 µM Z-VAD-fmk (Z-VAD), 20 µM necrostatin (Nec-1), 500 nM liproxstatin-1 (Lip-1), 5 µM Fer-1, 10 µM MitoTEMPO (MT), 10 nM MitoQH2 (QH2) or 5 µM inPISD for 12 h, followed by scramble shRNA or shWIPI4 lentivirus treatment in combination with the same drugs for 24 h. LDH release was then assayed as a measure of cytotoxicity (n = 3). ag, Data are the mean ± s.d.; two-tailed paired Student’s t-test. h,j, Data are the normalized mean ± s.d.; two-tailed one-sample Student’s t-test for comparisons with scramble DMSO and two-tailed paired Student’s t-test for comparisons with other samples. ah,j, n, number of biologically independent experiments. *P < 0.05, **P < 0.01 and ***P < 0.001. Source numerical data are provided. Source data
Fig. 7
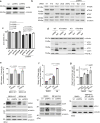
Fig. 7. ATG2 transports PS into mitochondria, which is then locally converted to PE.
a, HeLa cells were transfected with scramble siRNA, siWIPI4 or siRNA targeting mitochondrial PISD-2 (simPISD) for 48 h and the levels of LDH release were measured (n = 3). b, ATG2A/B-KO HeLa cells were transfected with scramble siRNA or simPISD for 48 h before transfection with GFP or GFP–ATG2A constructs for another 24 h. Conditioned media were used for the LDH assay (n = 3). c,d, Cells from b were lysed and assayed for MDA (c) and PE (d). Two-tailed paired Student’s t-test (n = 3). e, Cell death of HeLa cells transfected with CMV-myc-DDK or mitoPISD-myc-DDK (n = 3). The cells were cultured for 24 h before treatment with DMSO or 100 nM Lip-1 in media containing IncuCyte red dye. The samples were imaged 48 h post transfection and dead cells were counted (number of red objects). Data are the average number of dead cells per well normalized to the CMV-myc-DDK-transfected/DMSO-treated control. f, Mitochondrial conversion of 18:1-12:0 NBD-PS to PE within 1.5 h measured by microscopy (n = 3). g, HeLa cells were first treated with Seahorse for 15 min and then treated, imaged and assayed as in f (n = 4). h, Cell death of SH-SY5Y cells transfected with 50 nM siWIPI4 and/or siRNA to ORP5/8 (siORP5/8; n = 3). Cells were stained with CellTox green dye 48 h post transfection. Cell death was determined as the ratio of the green area (dead cells) to the phase area (total cells). i, Levels of PE in the mitochondrial fractions of HeLa cells transfected with the indicated siRNAs (n = 3). Cell fractionation was performed 48 h post transfection and mitochondrial samples with same protein abundance were used for the PE assay. a,b,e,h, Data are the normalized mean ± s.d. Two-tailed one-sample Student’s t-test for comparisons to the siWIPI4 (a) or controls (b,e,h) and two-tailed paired Student’s t-test for comparisons between other samples. f,g,i, Data are the mean ± s.d. Two-tailed paired Student’s t-test. ai, n, number of biologically independent experiments. *P < 0.05, **P < 0.01 and ***P < 0.001. Source numerical data are provided. Source data
Extended Data Fig. 1
Extended Data Fig. 1. WIPI4 loss of function induces ferroptosis.
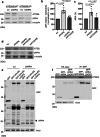
a. Blots of SH-SY5Y cells transfected with control or WIPI4 siRNAs for 72 hours (this western blots were run 4 times, once for each biological repeats). b and c. SH-SY5Y (b, i) or HeLa cells (c, i) were transfected with control or WIPI4 siRNA Oligo 2. Cell viability was examined in the cells prior to treatment with DMSO or 1 µM Fer-1 (b) or 100 nM Lip-1 (c) (n = 3 independent experiments). Blots below show the knockdown efficiency (n = 3). d. Cell viability (n = 5 independent experiments) measured using AquaBluer in control and WIPI4 knockdown HeLa cells treated with DMSO (control), 1 µM Z-VAD-fmk, 10 µM necrostatin-1, 100 nM liproxstatin-1 (Lip-1) and 1 µM ferrostatin-1 (Fer-1) for 48 hours. Cells were grown for another 24 hours before immunoblotting. e. HeLa cells transfected with control, WIPI4 siRNA, GFP, or GFP-ATG2A were immunoblotted. Cells treated with 1 µM staurosporine for 4 hours were positive control for cleaved caspase 3 (this experiment was done twice). f.HeLa cells transfected with pSpCas9(BB)-2A-GFP with gRNA targeting WIPI4 Exon 3 or its control construct were grown for indicated time before lysis for knockout efficiency detection. g.Lipid peroxidation evaluated by Bodipy581/591C11 staining of SH-SY5Y cells. The ratio of peroxidised (510 emission) to total (591 emission) signal was calculated as a derivative in Flowjo (n = 3 independent experiments). h. The sequential gating strategy for flow cytometry experiments in g. SH-SY5Y cells positive of Bodipy581/591C11 staining was defined by thresholding against unstained SH-SY5Y cells. Cells with greater red (YL1-A) fluorescence than that of unstained cells (YL1-A + ) were selected as positive of Bodipy581/591C11 staining (Q2 and Q3). Cells in Q2 are positive of both reduced and oxidized Bodipy581/591C11 signal and are quantified for oxidized (510) and total (591) signals. The ratio of GFP-A median vs YL1-A median is 1984/8723 = 0.2274 for scr and 2144/7826 = 0.274 for siWIPI4 sample in this experiment. The numbers of events are 568000 for scr and 978000 for siWIPI4. i. Cytotoxicity of i3 neurons treated by scramble or 5 deconvoluted shRNA oligos for 24 hours (n = 3 independent experiments). j. i3 neurons infected with lentivirus packaged with anti-human WIPI4 shRNAs from i. The right panel: i3 neurons infected with shRNA6 and shRNA7 lentiviruses, undifferentiated iPSC cells. Microtubule-Associated Protein 2 (MAP2) is a neuron specific protein. Tuj1 antibody reacts with the β-III isoform of tubulin, which is expressed primarily in neurons. Both MAP2 and Tuj1 are used to distinguish neurons from other cell types. Western blots were run 3 times, once for each biological repeat. k. Primary neurons infected with lentiviruses packaged with anti-mouse WIPI4 shRNAs were subjected to LDH assay before lysis and blotting (n = 3 independent experiments). l. The injection of wdr45-targetting CRISPRs caused a reduction in the expression of zebrafish wdr45 measured by qPCR at 5 d.p.f. Graph represents the relative expression of wdr45 normalized to the levels of rbs11 in fish injected with wdr45-CRISPRs compared to their uninjected siblings (N = 7 independent experiments 10 fish per group; unpaired t-test after log-transformation). m. wdr45-KD by the injection of 64 or 96 pg of CRISPRs caused a reduction in the population of fluorescently-labelled rods in rho:EGFP transgenic fish at 10 d.p.f. The upper panel shows representative images of EGFP-labelled rods in cryosections across the central retina of rho:EGFP zebrafish at 10 d.p.f. Scale bar = 10 μm. The lower panel shows the quantification of the photoreceptor area. N = 12 eyes per group. Data and error bars in b-k are normalized. Mean ± SD, two-tailed one-sample t-test to control and two-tailed paired t-test between other samples. l and m: Mean ± SD, unpaired t-test. Source numerical data and unprocessed blots are provided.
Extended Data Fig. 2
Extended Data Fig. 2. WIPI4-depletion induced ferroptosis is autophagy-independent.
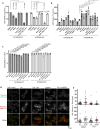
a. Blots of samples in Fig. 3a showing the knockdown efficiency of WIPI4 and WIPI2 (n = 3). b. Blots showing the knockdown efficiency of ATG7, WIPI4, ATG7, ATG16, ATG2A (n = 3). Two-tailed one sample t-test between scramble and siRNA knockdown of ATG2 genes and WDR45, two-tailed paired t-test between siWIPI4 and siWIPI4+ siATG7/10 double knockdown, siWIPI4 and siWIPI4 + siATG16 double knockdown, aiWIPI4 and siATG2A/B double knockdown. c. Cytotoxicity (n = 4) of SH-SY5Y cells with siRNA KD of ATG7/10, ATG16L1 or ATG2A/B, alone or in combination with WIPI4 knockdown. d. Blots showing that there is no LC3-II due to defective lipid conjugation in ATG16L1 knockout HeLa cell line we used and this is an autophagy-null cell line. Cells were treated with DMSO or 250 nM bafilomycin A1 for 4 hours (n = 3). e. Cytotoxicity measured by LDH assay of Beclin-1 knockout HeLa and its control cells treated as indicated (n = 4). On Day 0, cells were transfected with WIPI4 or scramble siRNA and grown for 48 hours before LDH assay. The western blots show the WIPI4 and Beclin-1 levels in the cells treated as described above. Note that the data points from each individual biological replicate are shown in different colours. Two-tailed one-sample t-test between scramble and siWIPI4 of WT cells, and same with scramble and siWIPI4 of Beclin 1 knockout cells. f. Cell death levels of HeLa cells measured with staining with CellTox Green Dye from Promega (n = 3). Cells were transfected with 50 nM WIPI4 or scramble siRNA and then treated with 5 µM ULK1 inhibitor SBI-0206965 for 24 hours before staining. Images were taken with the IncucyteS3 live imaging system and dead cells were quantified as the ratio of green (dead cells) area vs. phase (total cells) area using the Incucyte 2020 software. Western blots show the WIPI4 and LC3-II levels in the cells treated as described above (western blots were done for each biological replicates to detect knockdown efficiency). g. Cell death levels of HeLa cells treated as indicated (n = 3). On Day 0, HeLa cells were transfected with pSpCas9(BB)-2A-GFP construct containing gRNA targeting WIPI4 gene Exon 3 (KO) or its control construct (spCas9). Cells were grown for 24 hours before treatment with 200 nM rapamycin in media containing Incucyte Cytotox Red Dye from Sartorius. Images were taken between 48-72 hours after transfection. Dead cells were counted as red objects. WIPI4 and LC3-II levels are in blots. Data and error bars in c, e-g are normalized Mean ± SD. Two-tailed one sample t-test to control and two-tailed paired t-test between other samples. N represents the number of biologically independent experiments. Source numerical data and unprocessed blots are provided.
Extended Data Fig. 3
Extended Data Fig. 3. WIPI4-depletion induced ferroptosis is ATG2-dependent.
a. Blots of samples in Fig. 3e stained with indicated antibodies (representative blots of 6 biological replicates). b, c. SH-SY5Y cells were transfected with scramble, WIPI4, or WIPI4 in combination with ATG2A/B siRNAs for 72 hours and tested for cytotoxicity with LDH assay (b, n = 4), MDA levels (c, n = 4) and cell viability with AquaBluer (d, n = 4). Normalized mean ± SD. Two-tailed one sample t-test to control and two-tailed paired t-test between other samples. ns; not significant, *P < 0.05, **P < 0.01, ***P < 0.001. d. SH-SY5Y cells in b-c were lysed and subjected to western blot and immunoblotted with indicated antibodies (n = 3). e. Control or WIPI4 knockdown HeLa cells transfected with GFP, GFP-WIPI4-siRNA resistant mutant, or GFP-WIPI4-LOOP3-siRNA-resistant mutant were blotted with GFP and WIPI4 antibodies to check the recovery of WIPI4 levels (this experiment was done 3 times). f. HeLa cells transfected with GFP, GFP-WIPI4 WT, or GFP-WIPI4-LOOP3 were immunoprecipitated by GFP-TRAP and blotted with ATG2A antibody (n = 3). N represents the number of biologically independent experiments. Source numerical data and unprocessed blots are provided (this experiment was done twice).
Extended Data Fig. 4
Extended Data Fig. 4. WIPI4–ATG2 axis is a novel ferroptosis pathway.
a. Cell viability was measured by Aquabluer staining in ATG2A/B WT and KO HeLa cells treated with DMSO, 10 µM erastin, 3 µM RSL3, 1 µM iFSP1, 100 nm Lip-1, or indicated combinations of these drugs (n = 3). b. Cell cytotoxicity was examined by LDH assay in ATG2A/B WT and KO HeLa cells treated with 3 µM RSL3, 10 µm sorafenib, 10 µM erastin,5 µM FIN56 with or without 100 nm Lip-1 for 24 hours (n = 3). P values could be found in the numerical source data. c. Cell viability measured by Aquabluer assay in ATG2A/B WT and KO HeLa cells treated with 1.25 µM, 2.5 µM, or 5 µM arachidonic acid or same concentration of BSA, with or without 100 nM Lip-1 (n = 5) for 24 hours. d. HeLa cells transfected with control or WIPI4 siRNAs for 72 hours were treated with 1 µM Fer-1 for 24 hours. The cells were incubated with Bodipy581/591C11 for 15 minutes before cell lysis and were then subjected to needle homogenization without detergent prior to immunoprecipitation with endogenous ATG2A. Indicated fluorescent strength on the objects attached to magnetic beads was observed with confocal microscopy. This experiment was done twice with HeLa and SH-SY5Y cells. e. Quantification of representative experiments measuring the shift of Bodipy C11 signal on ATG2A pulled-down beads in SH-SY5Y cells (upper, n = 1) and HeLa cells (lower, n = 1). Datapoints represent the ratio of two fluorescent levels (510 nm, oxidized / 590 nm, reduced) of each taken field. Median with 95% CI. Data and error bars in a-c are normalized mean ± SD. Two-tailed one sample t-test to control and two-tailed paired t-test between other samples. N represents the number of biologically independent experiments. Source numerical data are available in source data. Source data
Extended Data Fig. 5
Extended Data Fig. 5. ATG2A mislocalises more onto mitochondria in WIPI4 depleted conditions.
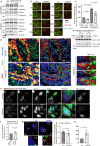
a. After immunoprecipitation with endogenous ATG2A (ED Fig. 4e), proteins were eluted from the magnetic beads with Laemmli buffer. Sec23a is the marker for ribosome-free transitional face of the endoplasmic reticulum (ER) and associated vesicles. Calreticulin is a marker for ER resident proteins (n = 2). b. Representative images from videos of RFP-LC3 stable HeLa cell line 24 hours after transfection with GFP-ATG2A. The images are from videos taken in one representative of 3 biologically independent experiments. c. HeLa cells transfected with pHAGE-GFP-ATG2AmLIR and pHAGE-GFP-ATG2A were treated with DMSO or Lip-1 for 24 hours in media containing Incucyte Cytotox Red Dye (n = 3). Images were taken 30 hours after first transfection. Dead cells were counted as red objects and the number of transfected cells were counted as green objects. Datapoints represent the ratio of red object count vs. the green object count normalized to the transfection efficiency of each sample. At least 30 images were taken per sample per experiment. Protein levels of overexpressed wildtype ATG2A and ATG2AmLIR are shown in the blots. d. Representative super-resolution structured illumination microscopy images of endogenous ATG2A co-stained with mitochondria marker TOMM20 and ER protein Sec61-BFP. Left hand panels are unprocessed and other panels are rendered using Imaris software. Scale bar in the left 4 panels = 0.4 µm, scale bar in the right hand panels = 0.2 µm. This shows increased ATG2 on TOMM20 (mitochondria) in WIPI4 knockout cells. In control cells, 471/2531 ATG2A structures colocalised with mitochondria, while in WIPI4 knockout cells, 407/1438 ATG2A structures colocalised with mitochondria (p = 1.52216E-12 by chi-squared test). 5 cells were scored per condition. e. Representative confocal images of endogenous ATG2A co-stained with Mitotracker Far-red and ER protein Sec61-BFP. f. Quantification of Pearson’s coefficient of ATG2A and Mitotracker Far-red from confocal images (n = 3, >= 20 images per experiment). Scale bar = 10 µm. g. Live imaging of HeLa cells transfected with GFP-ATG2A and stained with BodipyC12 (n = 3). Scale bar = 5 µm. Two-tailed paired t-test. h. The ATG2A levels in Fig. 4b were compared based on the proportion in mitochondrial fraction to post-mitochondrial fraction (n = 4). Two-tailed one sample t-test to control and two-tailed paired t-test between other samples. Graphs c, f, h present normalized mean ± SD. Graph in g presents mean ± SD. N represents biologically independent experiments. Source numerical data and unprocessed blots are provided.
Extended Data Fig. 6
Extended Data Fig. 6. ATG2A mislocalises more onto ER–mitochondria contact sites in WIPI4 depleted conditions.
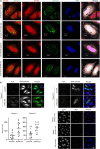
a. Confocal images of endogenous ATG2A co-stained with MAM marker calnexin in wildtype and ATG16 knockout HeLa cells depleted of WIPI4. These images are from one representative experiment out of 3 biological repeats. b. N = 2 biologically independent experiments of proximity ligation assay for VDAC1 and IP3R1 proteins (>= 15 images were taken per sample per experiment). After fixation and blocking, HeLa cells were incubated overnight with rabbit anti-IP3R3 1:100 and mouse anti-VDAC1 1:100 primary antibodies. After PBS wash, PLA probes anti-rabbit PLUS and anti-mouse MINUS were added for 1 hour in the antibody diluent buffer and then stained with Duolink fluorophore red (excitation/emission = 594/624). As a negative control, one or both of the primary antibodies was/were omitted, and the PLA probe background staining was imaged. The background staining was limited for both probes. The average area of PLA signal in cells positive of GFP-spCas9 was quantified using ImageJ. Each datapoint represents the average area (in arbitrary units) of PLA signal per GFP-spCas9 positive cell in the given image. Source numerical data are provided. Source data
Extended Data Fig. 7
Extended Data Fig. 7. ATG2A mislocalization induced mitochondrial lipid peroxidation.
a. HeLa cells transfected with control or WIPI4 siRNAs were immunoprecipitated with endogenous ATG2A antibody and blotted for TOMM40 and TMEM41b (n = 3). Data points represents TOMM40 or TMEM41B levels normalized to ATG2A. b. ATG2A/B WT or KO HeLa cells transfected with control or WIPI4 siRNAs were immunoprecipitated with endogenous TMEM41b antibody and blotted for ATG2A and TOMM40 (WT cells: n = 4; ATG2A/B KO cells: n = 3). Data points are TOMM40 levels normalized to TMEM41b. c. Representative confocal images showing the MitoBodipy581/591C11 staining of primary neurons infected with scramble or anti-mouse WDR45 shRNA lentiviruses. These images are from one representative experiment out of 3 biological repeats. d. Day 13 i3 neurons were infected with lentiviruses expressing the empty backbone construct or wildtype ATG2A for 24 hours (n = 3). Neurons were then treated with 1 µM Fer-1 or 10 µM Mitotempo (MT) for 24 hours in fresh media before cytotoxicity assay on Day 15. e. i3 neurons in d were then harvested and blotted to check the differentiation efficiency and overexpression of ATG2A (n = 3). These blots are from one representative experiment out of 3 biological repeats. f. Representative confocal images of PARKIN-FLAG stable HeLa cells from Fig. 5i showing the mitochondrial depletion using MitoTracker Far-red staining. Cells were also lysed and immunoblotted with mitochondria marker NUDFA9 to check the depletion of mitochondria. These images are from one representative experiment out of 3 biological repeats. g. Cell death levels measured as dead cell numbers counted as red objects (n = 3). HeLa cells transiently knocked out of WIPI4 were transfected with 50 nM of NIX or scramble siRNA oligos 24 hours later and then grown for another 24 hours before staining with Incucyte Cytotox Red Dye. Images were taken between 48-72 hours after transfection of gRNAs. Western blots show the silencing efficiency of WIPI4 and NIX. Here we have used 1 as an arbitrary number for normalizing the control data to account for variability between biological replicate experiments. The number of dead cells per well in the control ranges from 400 to 1200 and this is a function of the variability in the numbers of cells initially seeded in the wells in the different experiments. h. Mitochondrial abundance as measured by flow cytometry with the intensity of nonylacridine orange (NAO) staining (n = 3). HeLa cells were transfected with indicated siRNAs and grown for 24 hours before analysis. The histogram below shows the intensity of green signal of a representative experiment. Anti-NIX siRNA transfected HeLa cells were used as a positive control for increase of mitochondria mass. Data and error bars in this graph are normalized mean ± SD. Two-tailed one sample t-test to control and two-tailed paired t-test between other samples. N represents the number of biologically independent experiments. Source numerical data and unprocessed blots are provided.
Extended Data Fig. 8
Extended Data Fig. 8. ATG2 overexpression induces toxicity through its lipid transfer function.
a. Representative GFP immunofluorescence images and western blots in ATG2A/B KO HeLa transfected with indicated constructs showing that the localization and expression of GFP-ATG2-LTD is similar with GFP-ATG2A-WT. Scale bar: 10 µm. This experiment was done twice. b. Representative brightfield and fluorescence images of the phenotypic abnormalities found in clutches injected either with 200 pg GFP empty vector or GFP-ATG2A WT constructs compared to their uninjected siblings at 48 h.p.f. Scale bars: 2 mm for clutches, 1 mm for individual embryos. N = 4 independent experiments. c. Primary neurons were pretreated with the following drugs: DMSO (control), 10 µM Z-VAD-fmk, 20 µM necrostatin, 500 nM liproxstatin-1 (Lip-1), 5 µM ferrostatin-1 (Fer-1), 10 µM Mitotempo (MT), 10 nM ubiquinol (QH2), 5 µM PISD inhibitor (iPISD) for 12 hours before 24-hour scramble and smartpool shWIPI4 lentivirus treatment together with the above drugs. Cell cytotoxicity (n = 3 biologically independent experiments) was measured by LDH release assay. Data are presented as normalized mean ± SD. ns., not significant, *P < 0.05, **P < 0.005. Two-tailed one-sample t-test when compared with scr DMSO and two-tailed paired t-test with shWIPI4 DMSO. d. The knockdown efficiency of WIPI4 (n = 3 independent experiments) in Fig. 6j and Extended Data Fig. 8c. Source numerical data and unprocessed blots are provided.
Extended Data Fig. 9
Extended Data Fig. 9. ATG2 transports PS onto mitochondria, which is then locally converted to PE.
a. The blots show the knockdown efficiency with two siRNA oligos targeting mitochondria specific form of PISD (mito-PISD) in SH-SY5Y cells (n = 3). Oligo 2 was used for the following experiments because it’s of better knockdown efficiency. b. The silencing efficiency of anti-mitoPISD siRNA in mitochondria fractions, post-mitochondria fractions, total lysates and nuclear pellets (NP) of HeLa cell lysates. HeLa were transfected with 100 nM of scramble or anti-mitoPISD (#2) siRNA oligos and grown for 48 hours before fractionation. TOMM20, the marker of the mitochondrial fraction; calnexin, the MAM enriched fraction. Datapoints represent the PISD protein levels normalized to the loading (α-tubulin) in each fraction (n = 3). c. The blots show the knockdown efficiency of WIPI4 and PISD in Fig. 7a (representative blots of 3 biological replicates). d. SH-SY5Y cells were transfected with scramble, WIPI4 or si-mitoPISD-2 siRNAs and grown for 48 hours before LDH (n = 3) was measured. Mean (normalized to siWIPI4) ± SD. Blots on the right show the knockdown efficiency of WIPI4 and PISD (representative blots of 3 biological replicates). e. Expression levels of mitoPISD-Myc-DDK measured by staining of anti-FLAG and anti-PISD antibodies (n = 3). HeLa cells transfected with CMV-myc-DDK or mitoPISD-myc-DDK were grown for 24 hours before lysis. f. Confocal images showing the colocalisation of mitoPISD-Myc-DDK with Mitotracker Red and BPC12 (neutral lipid/ lipid droplet probe). HeLa cells transfected with CMV-myc-DDK or mitoPISD-myc-DDK were grown for 24 hours before fixation and immunostaining. These images are from one representative experiment of 3 biological repeats. g. PISD levels relative to α-tubulin in HeLa cells lysates measured by western blotting (n = 3). h. PS levels of mitochondria purified from HeLa cells 48 hours after transfection of anti-WIPI4 and anti-mito-PISD-2 siRNAs (n = 3). i. Representative live-imaging experiment showing the colocalization of transiently overexpressed Lactadherin-C2 GFP and Mitotracker Far-red in HeLa cells (n = 1). Datapoints represent the percentage of Lactadherin C2 GFP area positive for Mitotracker Far-red as a function of total Lactadherin-C2 GFP area. Data and error bars in b, d & g: normalized mean ± SD. Two-tailed one sample t-test to scramble and two-tailed paired t-test between other samples; in h: Mean ± SD. Two-tailed paired t-test. Source numerical data and unprocessed blots are available in source data. N = number of biologically independent experiments.
Extended Data Fig. 10
Extended Data Fig. 10. PS transport onto mitochondria is required for WIPI4–ATG2-dependent ferroptosis.
a. Confocal images of the de novo mitochondrial PE-synthesis measurement experiment with ATG2A/B wildtype cells. Scale bar = 10 µm. Time 0: images taken immediately after 50 minutes’ loading of NBD-PS liposomes. Time 1.5 h, images taken 1.5 hours later, including 40 minutes incubation in 37 °C and 50 minutes of restaining of Duramycin-Cy5. These images are from one representative experiment out of 3 biological repeats. b. Representative blots showing the silencing efficiency of WIPI4 in samples (n = 3 independent experiments). c. Representative blots showing the silencing efficiency of ORP5, ORP8 and enrichment of MAM marker calnexin (n = 3 independent experiments). d. SH-SY5Y cells were transfected with 100 nM of scramble or anti-mitoPISD (#2) siRNA oligos. Cells were treated with drugs of indicated concentration in media containing CellTox Green Dye from 48 hours post first transfection. Images were taken at 60 hours post transfection. The levels of cell death were quantified as the ratio of green (dead cells) area vs. phase (total cells) area using the Incucyte 2020 software. Normalized mean ± SD (n = 3 biologically independent experiments). Two-tailed one sample t-test to scramble DMSO control and two-tailed paired t-test for other samples. e. Diagram. WIPI4 stabilizes the C-terminus of ATG2 onto autophagosomes by direct interaction. Without WIPI4 the C-terminus of ATG2 localizes more onto mitochondria, and this mislocalisation leads to more transfer of PS into mitochondria and more conversion to PE by mitochondrial PISD thereafter. The increase in mitochondrial PE levels promotes ferroptosis, possibly because poly unsaturated PE is the main substrate of ferroptosis. When mitochondrial PISD is depleted, the ER mitochondria concentration gradient of PS disappears, which slows the ER mito PS transfer and ferroptosis. Source numerical data and unprocessed blots are available in source data.

References

    1. Haack TB, et al. Exome sequencing reveals de novo WDR45 mutations causing a phenotypically distinct, X-linked dominant form of NBIA. Am. J. Hum. Genet. 2012;91:1144–1149. doi: 10.1016/j.ajhg.2012.10.019. - DOI - PMC - PubMed
    1. Saitsu H, et al. De novo mutations in the autophagy gene WDR45 cause static encephalopathy of childhood with neurodegeneration in adulthood. Nat. Genet. 2013;45:445–449. doi: 10.1038/ng.2562. - DOI - PubMed
    1. Ji CC, Zhao HY, Chen D, Zhang H, Zhao YG. β-Propeller proteins WDR45 and WDR45B regulate autophagosome maturation into autolysosomes in neural cells. Curr. Biol. 2021;31:1666–1677. doi: 10.1016/j.cub.2021.01.081. - DOI - PubMed
    1. Hor CHH, Tang BL. β-Propeller protein-associated neurodegeneration (BPAN) as a genetically simple model of multifaceted neuropathology resulting from defects in autophagy. Rev. Neurosci. 2019;30:261–277. doi: 10.1515/revneuro-2018-0045. - DOI - PubMed
    1. Stockwell BR. Ferroptosis turns 10: emerging mechanisms, physiological functions, and therapeutic applications. Cell. 2022;185:2401–2421. doi: 10.1016/j.cell.2022.06.003. - DOI - PMC - PubMed

Publication types

Substances