Clinical Trial
. 2024 Apr;30(4):1001-1012.
doi: 10.1038/s41591-024-02875-1. Epub 2024 Mar 7.

Locoregional delivery of IL-13Rα2-targeting CAR-T cells in recurrent high-grade glioma: a phase 1 trial

Affiliations
Clinical Trial

Locoregional delivery of IL-13Rα2-targeting CAR-T cells in recurrent high-grade glioma: a phase 1 trial

Christine E Brown et al. Nat Med. 2024 Apr.

Erratum in

Abstract

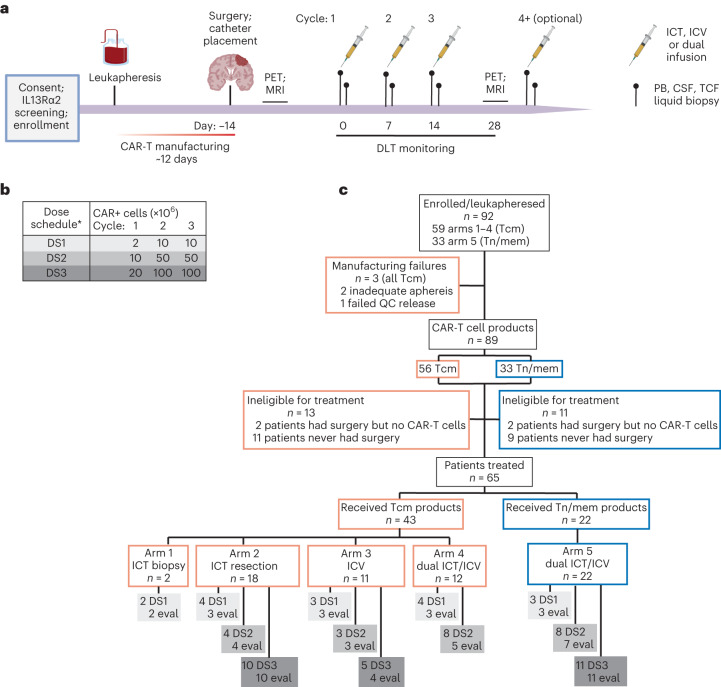
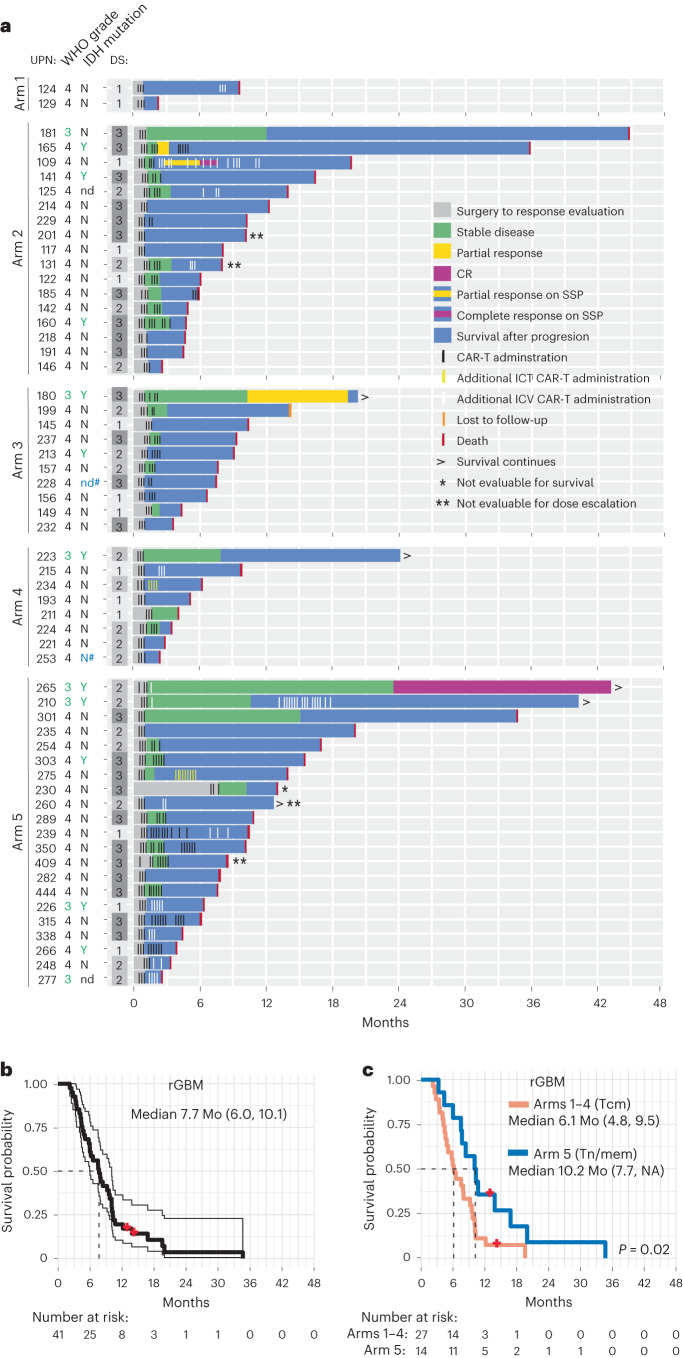
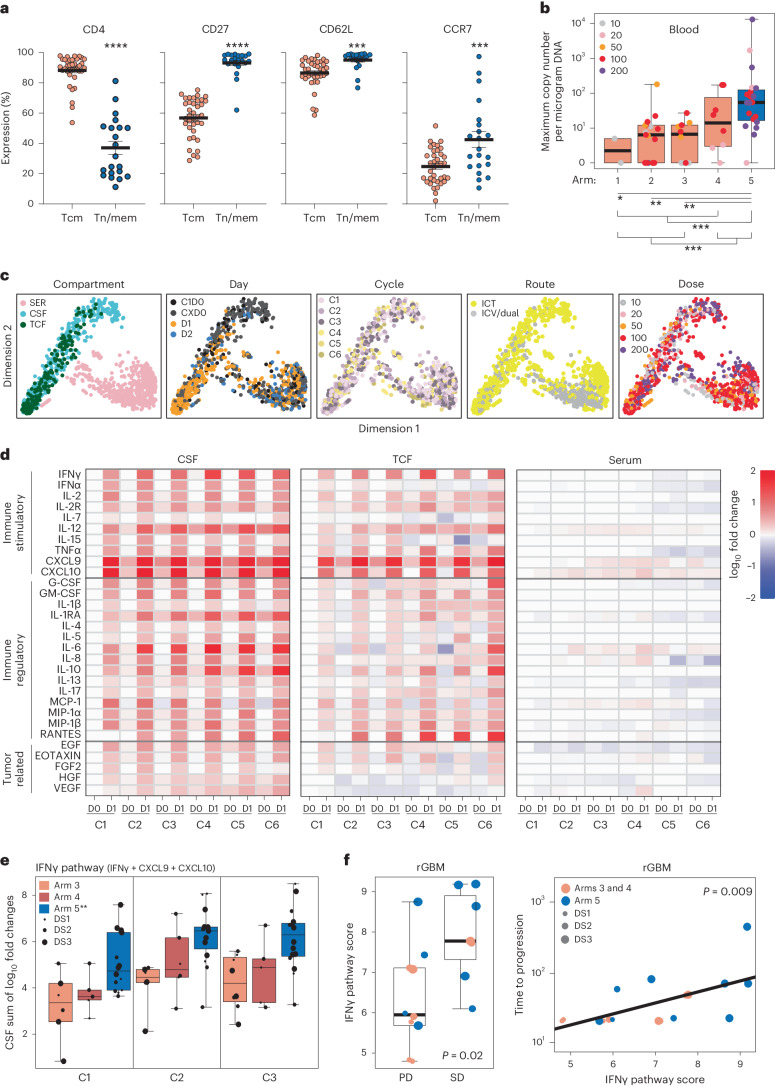
Chimeric antigen receptor T cell (CAR-T) therapy is an emerging strategy to improve treatment outcomes for recurrent high-grade glioma, a cancer that responds poorly to current therapies. Here we report a completed phase I trial evaluating IL-13Rα2-targeted CAR-T cells in 65 patients with recurrent high-grade glioma, the majority being recurrent glioblastoma (rGBM). Primary objectives were safety and feasibility, maximum tolerated dose/maximum feasible dose and a recommended phase 2 dose plan. Secondary objectives included overall survival, disease response, cytokine dynamics and tumor immune contexture biomarkers. This trial evolved to evaluate three routes of locoregional T cell administration (intratumoral (ICT), intraventricular (ICV) and dual ICT/ICV) and two manufacturing platforms, culminating in arm 5, which utilized dual ICT/ICV delivery and an optimized manufacturing process. Locoregional CAR-T cell administration was feasible and well tolerated, and as there were no dose-limiting toxicities across all arms, a maximum tolerated dose was not determined. Probable treatment-related grade 3+ toxicities were one grade 3 encephalopathy and one grade 3 ataxia. A clinical maximum feasible dose of 200 × 106 CAR-T cells per infusion cycle was achieved for arm 5; however, other arms either did not test or achieve this dose due to manufacturing feasibility. A recommended phase 2 dose will be refined in future studies based on data from this trial. Stable disease or better was achieved in 50% (29/58) of patients, with two partial responses, one complete response and a second complete response after additional CAR-T cycles off protocol. For rGBM, median overall survival for all patients was 7.7 months and for arm 5 was 10.2 months. Central nervous system increases in inflammatory cytokines, including IFNγ, CXCL9 and CXCL10, were associated with CAR-T cell administration and bioactivity. Pretreatment intratumoral CD3 T cell levels were positively associated with survival. These findings demonstrate that locoregional IL-13Rα2-targeted CAR-T therapy is safe with promising clinical activity in a subset of patients. ClinicalTrials.gov Identifier: NCT02208362 .


Conflict of interest statement

C.E.B. and S.J.F. report personal fees, patent royalties and research support from Mustang Bio during the conduct of the study, as well as patent royalties from Chimeric Therapeutics outside the submitted work. C.E.B., S.J.F. and B.B. also have a patent for CAR-T cell delivery pending and with royalties payable from Mustang Bio. N.E.B. receives compensation from DeepCell. The other authors declare no competing interests.

Figures

Fig. 1
Fig. 1. Study overview.
a, Schema of patient treatment (created with BioRender.com). b, Schema of dose escalation schedules (DS). *Participants on dual ICT/ICV arms (arms 4 and 5) received the indicated number of CAR+ cells at each site. c, Consort diagram of patient enrollment and treatment on each arm and dose schedule (DS1, DS2 or DS3). Tcm, central memory T cells; Tn/mem, naive, stem cell memory and central memory T cells; QC, quality control; ICT, intratumoral; ICV, intraventricular; eval, evaluable for response.
Fig. 2
Fig. 2. Clinical activity of locoregionally delivered IL-13Rα2-CAR-T cells.
a, Swimmer plot of evaluable patients and their clinical outcomes. WHO grade is at time of treatment. Tumor IDH mutations are indicated by yes (Y) or no (N); ND, not determined; DS, dose schedule. Black lines indicate CAR-T cell cycles administered to route dictated by arm (arm 1: ICT-Biopsy; arm 2: ICT-Resection; arm 3: ICV; arms 4 and 5: dual ICT/ICV). White lines indicate additional CAR-T cell cycles administered ICV. Yellow lines indicate additional CAR-T cell cycles administered ICT. Bold UPN numbers, evaluable rGBM patients (n = 42, evaluable for survival n = 41); #, diffuse midline glioma, H3 K27-altered. b, OS of evaluable rGBM patients from date of surgery. Thin lines denote 95% CIs; dashed line depicts median in months (Mo). Median survival with 95% CI in parentheses also indicated. c, Survival comparison of evaluable rGBM patients who were infused with either Tcm- or Tn/mem-derived cell products. Dashed lines depict medians in Mo. Median survival times with 95% CIs in parentheses also indicated; NA means infinity. P value for survival comparison was determined using the log-rank test. Red dots indicate censored participants (that is, lost to follow-up but had not passed away).
Fig. 3
Fig. 3. Correlative assessment of CAR-T persistence and patient cytokine profiles.
a, Expression of CD4, CD27, CD62L and CCR7 on Tcm- and Tn/mem-derived CAR + T cell products (n = 58 cell products) as determined by flow cytometry, with means (± standard error of the mean) indicated by black bars. ****P < 0.0001; ***P ≤ 0.0005 using a two-sided unpaired t-test. b, Box-and-whisker plot of maximum WPRE copy number per microgram of PBMC DNA by arm (n = 2, 17, 10, 8 and 20, respectively, for arms 1–5; reference Extended Data Fig. 4e). The median and interquartile range with whiskers extending to the minimum and maximum values are depicted. *P = 0.075, **P ≤ 0.003 and ***P ≤ 0.0003 when using a two-sided t-test. Legend indicates maximum infusion dose per dose schedule (×106). c, Low-dimensional representations of cytokine measurements colored by compartment (SER, CSF or TCF), day of any given cycle (up to six cycles, with CXD0 being day 0 of cycles 2–6), cycle number, delivery route or dose (legend indicates maximum infusion dose × 106). d, Heatmap of cytokine levels across cycles (C1–6), preinfusion (D0) and postinfusion (D1) in either the CSF (left), TCF (middle) or serum (right), with the median log10 fold change from baseline (C1D0) shown. e, Box-and-whisker plot of the change in IFNγ pathway score (log10(IFNγ) + log10(CXCL9) + log10(CXCL10)) from baseline (C1D0) to the corresponding CXD1 within the CSF for survival evaluable patients treated on either arm 3, 4 or 5, for the first three cycles (at C1, n = 6, 5 or 14, respectively; at C2, n = 6, 6 or 15, respectively; at C3, n = 8, 5 or 16, respectively). The median and interquartile range with whiskers extending to the minimum and maximum values are depicted. Dose schedule (DS) is indicated by dot size; **P ≤ 0.0006 compared to each of the other arms using ANOVA. f, CSF IFNγ pathway score at C1D1 (log10(IFNγ) + log10(CXCL9) + log10(CXCL10)) in patients with rGBM (n = 15) evaluated relative to response. Left: box-and-whisker plot of CSF IFNγ pathway scores for PD versus SD or better following CAR-T treatment. The median and interquartile range with whiskers extending to the minimum and maximum values are depicted. Right: CSF IFNγ pathway scores plotted against time to progression in days, with the regression line for all arms depicted. Dose schedule (DS) indicated by dot size and P values determined by two-sided t-test.
Fig. 4
Fig. 4. Pretreatment tumor T cell infiltrates and responses to CAR-T therapy.
a, Distribution of tumors with high, intermediate or negative/low CD3 infiltrates in pretreatment tumors from patients evaluable for survival (n = 57). b,c, Survival comparison of all evaluable rHGG (b) or rGBM (c) patients with either negative/low (1, 2) or intermediate/high (3, 4) tumor CD3 IHC scores. Dashed lines depict medians in months (Mo). Median survival times with 95% CIs in parentheses are also indicated; NA means infinity. P values comparing survival distribution of each group using the two-sided peto–peto test are depicted. d,e, MRI images from CD3 high UPN265 (d) and CD3 intermediate UPN301 (e). Ticks in timelines indicate 6-month intervals; SOC, standard of care involving surgery, radiation and temozolomide; PCV, procarabaxine, CCNU and vincristine; Bev., bevacizumab; CCNU, lomustine; SAP, survival after progression. f, Linear regression model of log survival time for survival evaluable rGBM patients (n = 41) showing estimates of the survival effect for CD3 intermediate/high (3, 4), Tn/mem product (arm 5) or both. Parameters were compared to a CD3 low/negative (1, 2) and Tcm (arms 1–4) patient reference group. Point estimates of the effect of each variable, or both, are depicted as a multiplicative factor (center dot, with 95% CIs as horizonal lines) that is applied to survival time; 95% CI horizontal lines do not cross vertical dashed line, demonstrating P < 0.05 for each effect; reference Methods for statistical analysis details.
Extended Data Fig. 1
Extended Data Fig. 1. Effect of ICV delivered CAR-T cells for UPN145 and patient overall survival and quality-of-life evaluations.
a, MR images of UPN145 under Arm 3 before (PRE, left panels) and after (POST, right panels) three ICV infusions of CAR-T cells at DS1 show that while the subpial lesions (yellow arrows) resolved, the parenchymal tumor (yellow circle) progressed. b, Overall survival of all evaluable patients from date of surgery. Thin lines denote 95% CIs; dashed lines depict medians in months (Mo). Median survival times with 95% CIs in parentheses are indicated. c, d, Survival comparisons of rGBM patients by dose schedule utilized for the DLT period. Legend of (c) and x-axis of (d) indicate maximum infusion cycle dose x 106. Box and whisker plots of (d) depict the median and interquartile range with whiskers extending to the minimum and maximum values. P-values were determined using the two-sided Log-rank test (c) or an ANOVA test (d) across the different dose levels (n = 6, 4, 5, 17, and 9, left to right). e, Survival comparison of all evaluable patients that were infused with either Tcm- or Tn/mem-derived cell products. Red dots indicate censored participants (that is, lost to follow-up but hadn’t passed away). P-values for survival comparisons were determined using the Log-rank test. f, EROTC QLQ-C30 summary score slopes (change in QOL scores per day) from pre-surgery to ~ day 38 (encompassing the three infusions and DLT period) for all evaluable participants (top) or evaluable participants with rGBM (bottom) are shown as box and whisker plots. The median and interquartile range with whiskers extending to the last point within 1.5 times the interquartile range are depicted for Arms 1-4 vs. Arm 5. The means are indicated as blue filled circles. Note the pre-cycle 1 score was used as baseline for four participants who did not have pre-surgery scores, and for 3 participants, 1 question for the timepoint was imputed with cycle 1 results. P-values were calculated using the two-sided t-test.
Extended Data Fig. 2
Extended Data Fig. 2. Characterization of Tcm- and Tn/mem-derived CAR-T cell products.
a, Representative flow cytometry of CD62L/CD45RA before and after selection of either Tcm (left) or Tn/mem (right). b, Average distribution of T cell subpopulations in starting PBMC, or Tcm- or Tn/mem-selected cells based on CD62L/CD45RA analysis shown in (a). Tn/scm, CD62L + CD45RA + ; Tcm, CD62L + CD45RA-; Tem, CD62L- CD45RA-; Temra, CD62L- CD45RA + . c, Expression of CAR (using CD19t marker), CD57, LAG-3, PD-1 and co-expression of LAG-3 and PD-1 on Tcm- and Tn/mem-derived final CAR + T cell products as determined by flow cytometry, with means ( ± S.E.) indicated by black bars. ****, P < 0.0001; ***, P ≤ 0.0003 using a two-sided unpaired t-test. Due to limited cell product availability, only 46 products (n = 32 Tcm, 14 Tn/mem) were assayed for CD57, LAG-3 and PD-1. d, UMAP projection and clustering of 80,374 cells across 40 Tcm-derived and 22 Tn/mem-derived CAR-T products, colored by 12 T cell clusters (left), or by product type (right). Clusters 1, 3, and 7 are outlined. e, Log-normalized, scaled expression of CD8 (left), and enrichment of gene signatures for memory-like and dysfunctional T cell subsets. f, Mean percentages of cells in each of the 12 clusters identified by scRNA sequencing (C0-C11, reference d) in Tcm-derived and Tn/mem-derived CAR-T cell product samples. g, Percentage proportions of Tcm- vs. Tn/mem-derived CAR-T cell products in each of the 12 clusters (C0-C11). Two-sided Wilcox-test p-values when comparing Tcm- and Tn/mem-derived products in each cluster are indicated. h, Schematic of in vitro tumor rechallenge assay (left). Tcm- or Tn/mem-derived CAR-T product expansion (mean±S.E.; middle) and tumor count (right). ***, P ≤ 0.0031 using either a two-sided unpaired t-test (left) or a two-sided t-test for the log area under the curve (right). Note, due to limited cell product availability, only 49 products (n = 34 Tcm, 15 Tn/mem) were used in the expansion assay, and 45 products (n = 32 Tcm, 13 Tn/mem) were used in the killing assay.
Extended Data Fig. 3
Extended Data Fig. 3. Evaluation of Tcm- and Tn/mem-derived CAR-T cell products for Treg cells.
a, UMAP projection and log-normalized, scaled expression of CTLA4 (with 12 clusters indicated as in Fig. 2b), IL2RA, FOXP3 and IKZF2 genes. b, Average expression, and the percentages of cells expressing CTLA4, IL2RA, FOXP3 or IKZF2 genes in each of the 12 clusters identified by scRNA sequencing (C0-C11). c, Representative flow cytometry of CD25/FOXP3 on viable, CD3+/CD4+/CAR(CD19t)+ -gated cells of either Tcm- or Tn/mem-derived CAR-T cell products as compared to a Treg CAR-T cell line control. Isotype control staining is depicted at top to confirm quadrant placement for each analysis. d, Mean (±S.E.) percentages of CD25/FOXP3+ cells (left) or mean fluorescence intensities (MFI) of FOXP3 expression (right) on viable, CD3+/CD4+/CAR(CD19t)+ -gated cells of n = 5 representative Tcm- or Tn/mem-derived CAR-T cell products as compared to a Treg CAR-T cell line control.
Extended Data Fig. 4
Extended Data Fig. 4. Detection of CAR-T cells in the CNS and blood.
a, Representative flow cytometric analyses (left) and quantitation of viable CD3+ and CAR + T cells per µl (right), in CSF and TCF samples over the first three cycles (C1-C3) in Arm 3 (top), Arm 4 (middle) and Arm 5 (bottom). b, Graph summarizing numbers of CAR + T cells as determined by flow cytometry in the CSF for Arms 3-5 over the first three treatment cycles (C1-C3). D0, day 0 of that cycle prior to CAR-T cell infusion; D1, sample taken one or two days after CAR-T cell administration; DS, dose schedule. c, Box and whisker plot of AUC for number of CAR-T cells per µL in the CSF from cycles 1, 2 and 3 by arm (reference a, b; n = 9 for Arm 3, n = 7 for Arm 4, n = 19 for Arm 5). The median and interquartile range with whiskers extending to the minimum and maximum values are depicted. All comparisons between arms using t-test were nonsignificant. d, Percentages of the indicated surface marker expression of each CAR-T cell product were plotted relative to levels of detected CAR-T cells in the CSF (AUC measurements over cycles 1-3, reference b,c). Tcm- and Tn/mem-derived CAR-T cell products are depicted as peach and blue dots, respectively. Regression lines for all products are also depicted in each plot. e, WPRE copy numbers per µg of PBMC DNA are depicted over time. Cycles of CAR-T cell administration are indicated by dashed lines; note that for C4 + , day 28 to day 60, not everyone received 4 or more cycles of CAR-T cells, reference Fig. 2a. f, Percentages of the indicated surface marker expression of each CAR-T cell product were plotted relative to levels of detected CAR-T cells in the blood (maximum copy numbers of WPRE per µg of DNA observed over the first six cycles, reference e and Fig. 3b). Tcm- and Tn/mem-derived CAR-T cell products are depicted as peach and blue dots, respectively. Regression lines for all products, with significant p-values for each regression (via t-test), are also depicted in each plot.
Extended Data Fig. 5
Extended Data Fig. 5. Cytokine profiles after IL-13Rα2-CAR-T cell therapy.
a, CXCL10 levels depicted as density plots prior to CAR-T cell infusion (C1D0) and one, two- or seven-days post-infusion (D1, D2, D7) of cycles 1-6 in either the CSF (left), TCF (middle) or Serum (right). b, Plots of TCF (y-axis) versus CSF (x-axis) levels (log10) of IFNγ pathway cytokines (IFNγ, CXCL9 and CXCL10) and tumor-related cytokines (EGF, HGF, VEGF). Legend shows baseline (C1D0; black), subsequent pre-infusion (CXD0; grey), day 1 post-infusion (CXD1, red) and day 2 post infusion (CXD2, pink). Only measurements when a patient had concurrent CSF and TCF observations (reference Supplementary Fig. 5) are shown. c, Box and whisker plots of the fold changes from patients’ baseline to the corresponding CxD1 in each of the indicated individual IFNγ pathway cytokines within the CSF for patients treated on either arm 3, 4 or 5, for each of the first three cycles (at C1, n = 6, 5, or 14, respectively; at C2, n = 6, 6, or 15, respectively; at C3, n = 8, 5, or 16, respectively). The median and interquartile range with whiskers extending to the minimum and maximum values are depicted. By ANOVA: ***, p ≤ 0.00002; **, p ≤ 0.0003; and *, p ≤ 0.03 compared to each of the other arms in that graph; and ^^, p ≤ 0.0002; and ^, p ≤ 0.02 compared to each of the other cycles in that graph. d, Box and whisker plots of CSF IFNγ pathway score at C1D1 (log10(IFNγ) + log10(CXCL9) + log10(CXCL10)) in all evaluable, appropriately sampled patients who exhibited either PD (n = 15), SD (n = 9), PR (n = 1) or CR (n = 1) upon CAR-T cell treatment. The median and interquartile range with whiskers extending to the minimum and maximum values are depicted. P-value determined by two-sided t-test. e, CSF IFNγ pathway score in all evaluable patients was plotted against time to progression in days, and the regression line for all arms, with p-value (via two-sided t-test), is depicted. Arm 3 and 4 vs. Arm 5 patients are depicted as peach vs. blue dots, respectively, with dose schedule (DS) indicated by dot size (d, e).

References

    1. Weller M, et al. EANO guidelines on the diagnosis and treatment of diffuse gliomas of adulthood. Nat. Rev. Clin. Oncol. 2021;18:170–186. doi: 10.1038/s41571-020-00447-z. - DOI - PMC - PubMed
    1. Wen PY, et al. Glioblastoma in adults: a Society for Neuro-Oncology (SNO) and European Society of Neuro-Oncology (EANO) consensus review on current management and future directions. Neuro Oncol. 2020;22:1073–1113. doi: 10.1093/neuonc/noaa106. - DOI - PMC - PubMed
    1. Gilbert MR, et al. Dose-dense temozolomide for newly diagnosed glioblastoma: a randomized phase III clinical trial. J. Clin. Oncol. 2013;31:4085–4091. doi: 10.1200/JCO.2013.49.6968. - DOI - PMC - PubMed
    1. Brown CE, et al. Bioactivity and safety of IL13Rα2-redirected chimeric antigen receptor CD8+ T cells in patients with recurrent glioblastoma. Clin. Cancer Res. 2015;21:4062–4072. doi: 10.1158/1078-0432.CCR-15-0428. - DOI - PMC - PubMed
    1. Brown CE, et al. Off-the-shelf, steroid-resistant, IL13Rα2-specific CAR T cells for treatment of glioblastoma. Neuro Oncol. 2022;24:1318–1330. doi: 10.1093/neuonc/noac024. - DOI - PMC - PubMed

Publication types

Substances

Associated data