. 2024 Mar 7;7(1):286.
doi: 10.1038/s42003-024-05990-4.

Repeat DNA methylation is modulated by adherens junction signaling

Affiliations

Repeat DNA methylation is modulated by adherens junction signaling

Lisa-Marie Brenner et al. Commun Biol. .

Abstract

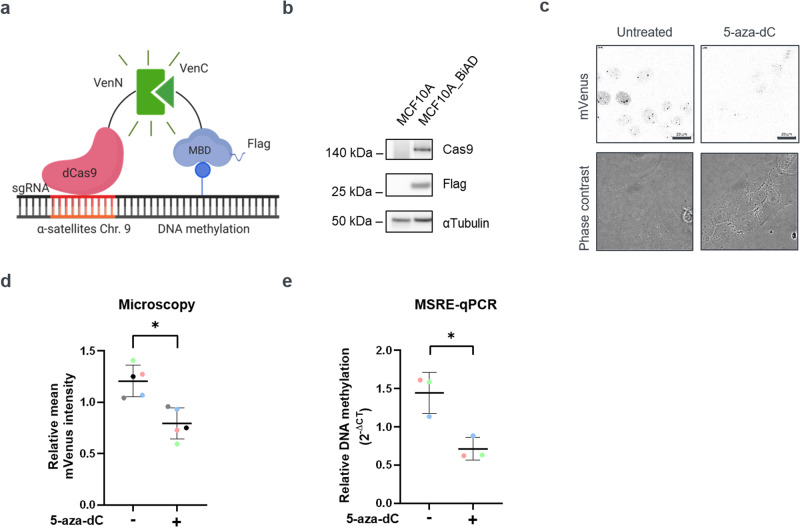
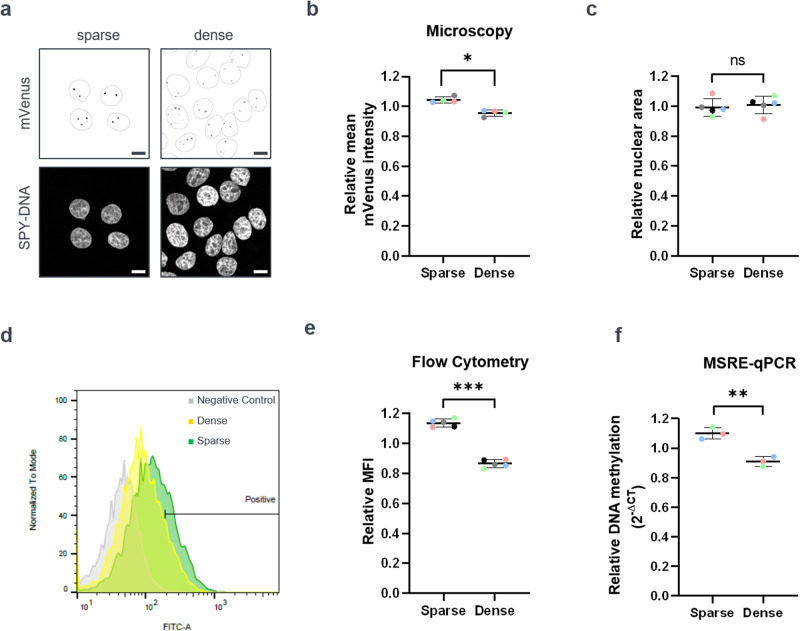
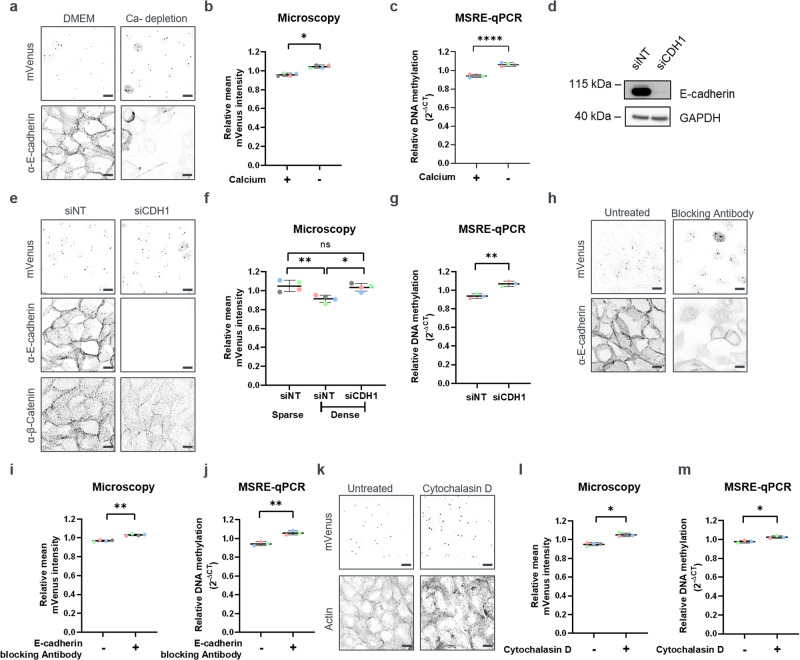
Through its involvement in gene transcription and heterochromatin formation, DNA methylation regulates how cells interact with their environment. Nevertheless, the extracellular signaling cues that modulate the distribution of this central chromatin modification are largely unclear. DNA methylation is highly abundant at repetitive elements, but its investigation in live cells has been complicated by methodological challenges. Utilizing a CRISPR/dCas9 biosensor that reads DNA methylation of human α-satellite repeats in live cells, we here uncover a signaling pathway linking the chromatin and transcriptional state of repetitive elements to epithelial adherens junction integrity. Specifically, we find that in confluent breast epithelial cell monolayers, α-satellite repeat methylation is reduced by comparison to low density cultures. This is coupled with increased transcriptional activity at repeats. Through comprehensive perturbation experiments, we identify the junctional protein E-cadherin, which links to the actin cytoskeleton, as a central molecular player for signal relay into the nucleus. Furthermore, we find that this pathway is impaired in cancer cells that lack E-cadherin and are not contact-inhibited. This suggests that the molecular connection between cell density and repetitive element methylation could play a role in the maintenance of epithelial tissue homeostasis.


Conflict of interest statement

The authors declare no competing interests.

Figures

Fig. 1
Fig. 1. Establishment of a stable MCF10A reporter cell line for DNA methylation readout at α-satellites.
a Scheme of the BiAD sensor used in this study. Together with the sgRNA, the anchor domain dCas9 (shown in red) recognizes the α-satellite sequences on chromosome 9. The detector domain, the MBD-domain (shown in blue) recognizes the 5mCpG modified sites. Both modules are fused to non-fluorescent fragments of mVenus (VenN and VenC). The occurrence of DNA methylation at the α-satellites leads to binding of the domains in close spatial proximity and reconstitution of a functional mVenus fluorophore. The figure was generated using Biorender. b MCF10A cells with stable expression of the BiAD modules (hereafter named MCF10A-BiAD) were generated by lentiviral transduction and the expression of the BiAD modules was validated by Western blot on cell lysates isolated from a clonal population. Antibodies recognizing Cas9 and the Flag-tagged MBD-domain were used. α-Tubulin served as a loading control. Lysates from the parental cells were used as antibody specificity control. Antibody probings were performed on the same membrane, which was cut in horizontal strips accordingly to the expected molecular weight of the target proteins. See also Fig. S8a for the uncropped Western Blot membranes. c 5-aza-dC treatment documents the 5mC specificity of the MCF10A-BiAD reporter cells. Shown are representative fluorescence microscopy images and corresponding phase contrast images of the reporter cells. Left panel: control MCF10A-BiAD cells display 2–3 fluorescent spots per nucleus. Right panel: MCF10A-BiAD cells treated for 24 h with 0.25 µM 5-aza-dC display reduced fluorescence intensity at the spots. Both images were acquired and are displayed using the same image settings. Scale bar is 20 µm. d Quantification of the relative mean mVenus fluorescence intensity of the immunofluorescence experiments representatively shown in (c). n = 5, N = 80–120. Statistical testing was performed via two-tailed paired t test, *p < 0.05. e Relative methylation-sensitive restriction digestion coupled with qPCR (MSRE-qPCR) was used to determine the methylation level of α-satellite repeats. Genomic DNA was isolated from MCF10A cells after 24 h treatment with 0.25 µM 5-aza-dC. Mock treated cells were used as control. n = 3. Statistical testing was performed using a two-tailed unpaired t test *p < 0.05. d, e In the dot blots, each dot is the mean value obtained for one biological repeat, the line indicates the mean of all biological repeats, and error bars represent their standard deviation. Paired measurements are indicated with the color coding.
Fig. 2
Fig. 2. DNA methylation levels of α-satellites are modulated by cell density.
a MCF10A-BiAD cells were seeded under sparse (5 × 103 cells/cm2) or dense (105 cells/cm2) conditions and imaged 24 h later. The nuclei were counterstained with SPY650-DNA, which was used to define a nuclear mask (superimposed on the mVenus signal in the top panel). Images were acquired and are displayed using identical settings. Scale bar is 10 µm. b Quantification of the immunofluorescence experiments representatively shown in (a). N = 30–60, n = 4. Statistical testing was performed using a two-tailed paired t test. *p < 0.05. c Quantification of the average nuclear area of MCF10A-BiAD cells grown under sparse and dense conditions. 7 consecutive confocal sections were used for each field of view to generate orthogonal projections of the SPY650-DNA stained nuclei. The average nuclear area was extracted in CellProfiler. N = 50–130, n = 5. Statistical testing was performed using a two-tailed paired t test. ns, not significant. d Flow cytometry measurement of the mVenus signal in MCF10A-BiAD reporter cells cultured for 24 h under sparse (green) and dense (yellow) conditions. Parental MCF10A cells were used as a control to gate for the FITC positive population. 104 cells were used for gating for each sample. e Quantification of the relative median fluorescence intensity of the flow cytometry experiments representatively shown in (d). n = 5. Statistical testing was performed using a two-tailed paired t test. ***p < 0.001. f Relative methylation-sensitive restriction digestion coupled with qPCR (MSRE-qPCR) was used to measure the methylation levels at α-satellite repeats in genomic DNA extracted from MCF10A cells cultured under sparse or dense conditions. n = 3. Statistical testing was performed using a two-tailed unpaired t test. **p < 0.01. b, c, e, f In the dot blots, each dot is the mean value obtained for one biological repeat, the line indicates the mean of all biological repeats, and error bars represent their standard deviation. Paired measurements are indicated with the color coding.
Fig. 3
Fig. 3. E-cadherin engagement modulates DNA methylation at heterochromatic repeats.
a Representative fluorescence microscopy images of the MCF10A-BiAD reporter cells grown for 24 h in either complete (left, DMEM) or low calcium medium (right, Ca2+ depletion). E-cadherin staining was used to validate the disruption of cell-cell contacts upon Ca2+ depletion. Images were acquired and are displayed using identical settings. Scale bar is 10 µm. b Quantification of the calcium depletion experiments representatively shown in (a) by fluorescence intensity measurements. N = 60–100, n = 4. Statistical testing was performed using a two-tailed paired t test. *p < 0.05. c Quantification of the calcium depletion experiments representatively shown in (a) by MSRE-qPCR. n = 4. Statistical testing was performed using a two-tailed unpaired t test. ****p < 0.0001. dg MCF10A-BiAD cells were analyzed 72 h post transfection with either control (siNT) or an E-cadherin targeting siRNA (siCDH1). d Western blot analysis verifies E-cadherin knock-down. GAPDH was used as a loading control. Antibody probings were performed on the same membrane, which was cut in horizontal strips accordingly to the expected molecular weight of the target proteins. See also Fig. S8b for the uncropped Western Blot membranes. e Representative fluorescence microscopy images of dense MCF10A-BiAD cells treated with the indicated siRNAs. E-cadherin staining was used to validate the siRNA knock-down. β-catenin staining was employed for cell shape recognition. Images were acquired and are displayed using identical settings. Scale bar is 10 µm. f Quantification of E-cadherin knock-down experiments representatively shown in (e) by fluorescence intensity measurements. Sparse cells transfected with siNT siRNA are included as reference. N = 20–60, n = 4. Statistical testing was performed using a one-way ANOVA. ns, not significant, *p < 0.05, **p < 0.01. g Quantification of E-cadherin knock-down experiments representatively shown in (e) by MSRE-qPCR. n = 3. Statistical testing was performed using a two-tailed unpaired t test. ns, not significant, **p < 0.01. hj Densely seeded MCF10A-BiAD cells were treated with an E-cadherin blocking antibody and analyzed 24 h later. h E-cadherin staining was used to validate the efficient disruption of adherens junctions by the E-cadherin blocking antibody. Shown are representative fluorescence microscopy images that were acquired and are displayed using identical settings. Scale bar is 10 µm. i Quantification of the mVenus sensor signal in the E-cadherin blocking experiments representatively shown in (h) by fluorescence intensity measurements. N = 30–90, n = 4. Statistical testing was performed using a two-tailed paired t test. **p < 0.01. j Quantification of E-cadherin blocking experiments representatively shown in (h) by MSRE-qPCR. Genomic DNA was isolated 24 h after the addition of the blocking antibody. n = 3. Statistical testing was performed using a two-tailed unpaired t test. **p < 0.01. km MCF10-BiAD cells were treated with Cytochalasin D (CytD, 0.3 µM, 24 h) to inhibit actin polymerization. k Shown are representative fluorescence microscopy images of phalloidin stained cells. Images were acquired and are displayed using identical settings. Scale bar is 10 µm. l Quantification of the experiment representatively shown in (k) by fluorescence intensity measurements (l). N = 60–100, n = 4. Statistical analysis was done with a two-tailed paired t test. *p < 0.05. m Quantification of the experiment representatively shown in (k) by MSRE-qPCR. n = 3. Statistical testing was performed using a two-tailed unpaired t test. *p < 0.05. b, c, f, g, I, j, l, m In the dot blots, each dot is the mean value obtained for one biological repeat, the line indicates the mean of all biological repeats, and error bars represent their standard deviation. Paired measurements are indicated with the color coding.
Fig. 4
Fig. 4. Cell density-dependent 5mC changes alter local chromatin mobility and α-satellite transcript expression.
ac Mean square displacement (MSD) of mVenus spots was measured in sparse and dense MCF10A-BiAD cultures. a Shown are representative trajectories integrated over a lag time of 3 s. N = 20. b Representative violin plot showing the distribution of mVenus spot movement (lag time of 1 s) in data collected from one biological repeat for sparse (blue) and dense (orange) seeded cells. N = 50–140, statistical testing was determined with a two-tailed unpaired t test, ****p < 0.0001. c Quantification of the MSD experiments representatively shown in (b). n = 3, N = 50–140. Statistical analysis was done with a two-tailed paired t test, *p < 0.05. d RT-qPCR analysis of α-satellite transcripts showing increased transcription in 5-aza-dC 24 h after drug treatment. n = 3. Statistical analysis was done with a two-tailed unpaired t test, **p < 0.01. e RT-qPCR analysis of α-satellite transcripts was performed on RNA isolated from MCF10A cells grown for 24 h in either sparse or confluent conditions. n = 3. Statistical analysis was done with a two-tailed unpaired t test, **p < 0.01. f RT-qPCR was used to analyze transcription from α-satellite DNA in MCF10A cells that had been treated for 24 h with the E-cadherin blocking antibody. n = 3. Statistical analysis was done with a two-tailed unpaired t test, **p < 0.01. g Western blot analysis of cell lysates isolated from MCF10A, SK-BR-3 and SUM159 cells and probed for E-cadherin. GAPDH was used as loading control. h MSRE-qPCR analysis of the α-satellite locus on genomic DNA isolated from SK-BR-3 and SUM159 cells, which were cultured for 24 h under either sparse or dense conditions. n = 3. Statistical analysis was done with a two-tailed unpaired t test, ns not significant. i qPCR analysis of the α-satellite transcripts on RNA isolated from SK-BR-3 and SUM159 cells, which were cultured for 24 h under either sparse or dense conditions. n = 3. Statistical analysis was done with a two-tailed unpaired t test, ns: not significant. j Scheme of newly discovered pathway linking the methylation status and transcription state of satellite DNA to cell density, mediated by E-cadherin. The figure was generated using Biorender. c, d, e, f, h, i In the dot blots, each dot is the mean value obtained for one biological repeat, the line indicates the mean of all biological repeats, and error bars represent their standard deviation. Paired measurements are indicated with the color coding.

References

    1. Jones PA. Functions of DNA methylation: islands, start sites, gene bodies and beyond. Nat. Rev. Genet. 2012;13:484–492. doi: 10.1038/nrg3230. - DOI - PubMed
    1. Pappalardo XG, Barra V. Losing DNA methylation at repetitive elements and breaking bad. Epigenet. Chromatin. 2021;14:25. doi: 10.1186/s13072-021-00400-z. - DOI - PMC - PubMed
    1. Parry A, Rulands S, Reik W. Active turnover of DNA methylation during cell fate decisions. Nat. Rev. Genet. 2021;22:59–66. doi: 10.1038/s41576-020-00287-8. - DOI - PubMed
    1. Chen Z, Zhang Y. Role of Mammalian DNA Methyltransferases in development. Annu. Rev. Biochem. 2020;89:135–158. doi: 10.1146/annurev-biochem-103019-102815. - DOI - PubMed
    1. Greenberg MVC, Bourc’his D. The diverse roles of DNA methylation in mammalian development and disease. Nat. Rev. Mol. Cell Biol. 2019;20:590–607. doi: 10.1038/s41580-019-0159-6. - DOI - PubMed