

Socioeconomic differences in working life expectancy: a scoping review
- PMID: 38454363
- PMCID: PMC10921693
- DOI: 10.1186/s12889-024-18229-y
Socioeconomic differences in working life expectancy: a scoping review
Abstract
Background: In the last decade, interest in working life expectancy (WLE) and socioeconomic differences in WLE has grown considerably. However, a comprehensive overview of the socioeconomic differences in WLE is lacking. The aim of this review is to systematically map the research literature to improve the insight on differences in WLE and healthy WLE (HWLE) by education, occupational class and income while using different ways of measuring and estimating WLE and to define future research needs.
Methods: A systematic search was carried out in Web of Science, PubMed and EMBASE and complemented by relevant publications derived through screening of reference lists of the identified publications and expert knowledge. Reports on differences in WLE or HWLE by education, occupational class or income, published until November 2022, were included. Information on socioeconomic differences in WLE and HWLE was synthesized in absolute and relative terms.
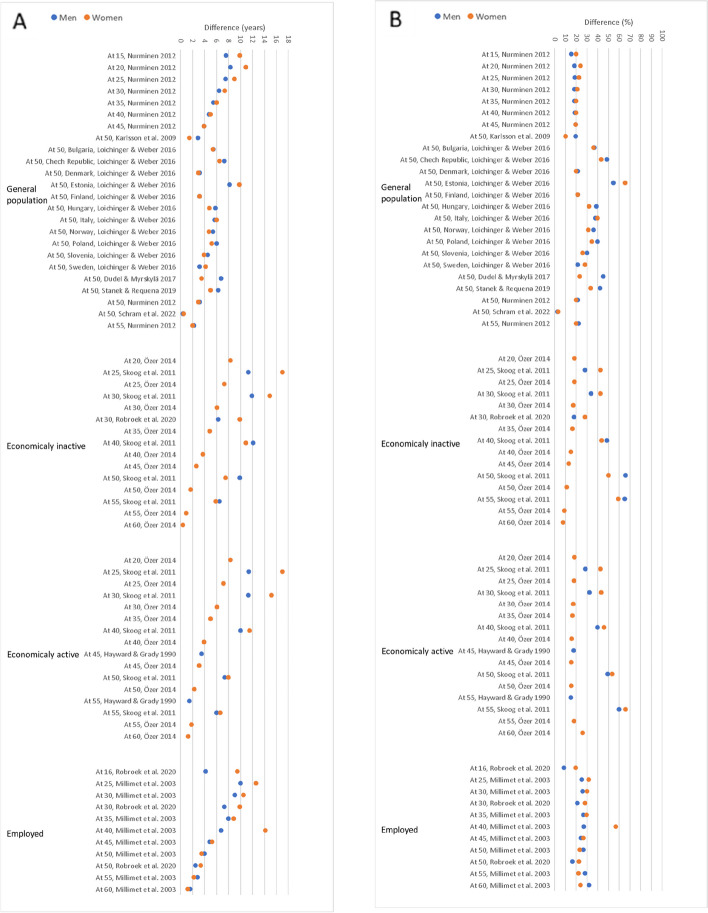
Results: A total of 26 reports from 21 studies on educational and occupational class differences in WLE or HWLE were included. No reports on income differences were found. On average, WLE in persons with low education is 30% (men) and 27% (women) shorter than in those with high education. The corresponding numbers for occupational class difference were 21% (men) and 27% (women). Low-educated persons were expected to lose more working years due to unemployment and disability retirement than high-educated persons.
Conclusions: The identified socioeconomic inequalities are highly relevant for policy makers and pose serious challenges for equitable pension policies. Many policy interventions aimed at increasing the length of working life follow a one-size-fits-all approach which does not take these inequalities into account. More research is needed on socioeconomic differences in HWLE and potential influences of income on working life duration.
Keywords: Education; Healthy working life expectancy; Income; Occupational class; Working years lost.
© 2024. The Author(s).
Conflict of interest statement
The authors declare no competing interests.
Figures


References
-
- Eurostat. Steady increase in the expected duration of working life in the EU. Eurostat 2022b; Statistics Explained, June 2022. Available at: https://ec.europa.eu/eurostat/statistics-explained/index.php?title=Durat.... (Accessed 10 July 2023).
Publication types
MeSH terms
Grants and funding
LinkOut - more resources
Full Text Sources
Medical
