. 2024 Mar 8;43(1):72.
doi: 10.1186/s13046-024-02985-1.

S100A9+CD14+ monocytes contribute to anti-PD-1 immunotherapy resistance in advanced hepatocellular carcinoma by attenuating T cell-mediated antitumor function

Affiliations

S100A9+CD14+ monocytes contribute to anti-PD-1 immunotherapy resistance in advanced hepatocellular carcinoma by attenuating T cell-mediated antitumor function

Xiaoxuan Tu et al. J Exp Clin Cancer Res. .

Abstract

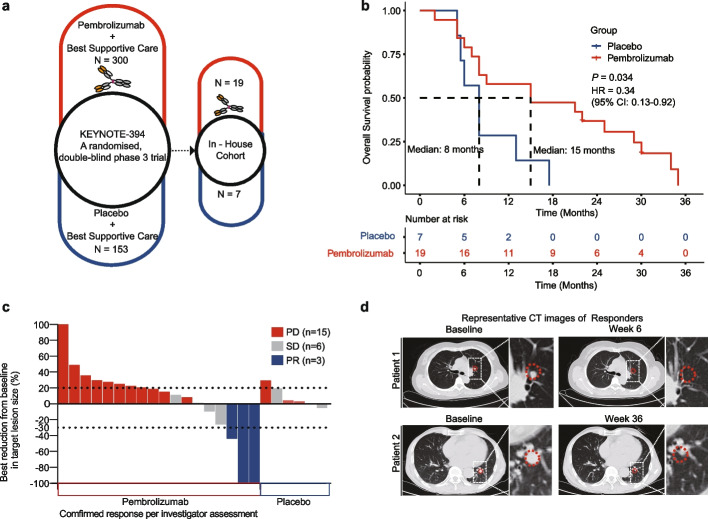
Background: The paucity of reliable biomarkers for predicting immunotherapy efficacy in patients with advanced hepatocellular carcinoma (HCC) has emerged as a burgeoning concern with the expanding use of immunotherapy. This study endeavors to delve into the potential peripheral biomarkers capable of prognosticating efficacy in HCC patients who are poised to receive anti-PD-1 monotherapy within the phase III clinical trial, KEYNOTE394. Additionally, we sought to elucidate the underlying molecular mechanisms for resistance to immune checkpoint blockade (ICB) and propose innovative combination immunotherapy strategies for future clinical application.

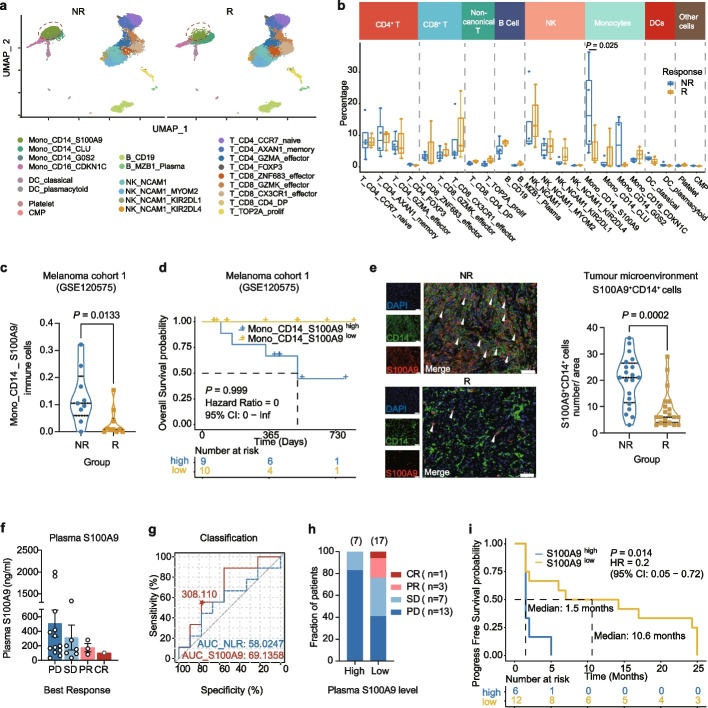
Methods: Patient blood samples were collected for single-cell RNA sequencing to evaluate the immune cell signature before receiving ICB therapy. Subsequently, in vitro assays and in vivo murine model experiments were conducted to validate the mechanism that S100A9+CD14+ monocytes play a role in ICB resistance.

Results: Our study demonstrates a notable enrichment of S100A9+CD14+ monocytes in the peripheral blood of patients exhibiting suboptimal responses to anti-PD-1 therapy. Moreover, we identified the Mono_S100A9 signature as a predictive biomarker, indicative of reduced efficacy in immunotherapy and decreased survival benefits across various tumor types. Mechanistically, S100A9 activates PD-L1 transcription by directly binding to the CD274 (PD-L1) gene promoter, thereby suppressing T-cell proliferation and cytotoxicity via the PD-1/PD-L1 axis, consequently diminishing the therapeutic effectiveness of subsequent anti-PD-1 treatments. Furthermore, our in vivo studies revealed that inhibiting S100A9 can synergistically enhance the efficacy of anti-PD-1 drugs in the eradication of hepatocellular carcinoma.

Conclusions: Our study underscores the significance of S100A9+CD14+ monocytes in predicting inadequate response to ICB treatment and provides insights into the monocyte cell-intrinsic mechanisms of resistance to ICB therapy. We also propose a combined therapeutic approach to enhance ICB efficacy by targeting S100A9.

Keywords: Anti-PD-1 monotherapy; Biomarker; Hepatocellular carcinoma; S100A9+CD14+ monocyte; Single-cell RNA sequencing.


Conflict of interest statement

The authors declare no conflict of interests.

Figures

Fig. 1
Fig. 1
Favorable clinical efficacy of pembrolizumab in patients with advanced HCC. a Graphics of the clinical trial design. Left: KEYNOTE394; patients were assigned to receive pembrolizumab (top, N = 300) or placebo (bottom, N = 153). Right: In-house cohort as part of KEYNOTE394. b Kaplan–Meier survival curves showing overall survival stratified by pembrolizumab (red) and placebo (blue) groups. P value was calculated using the log-rank test. c Best response determined using RECISTv1.1. PD, disease progression; PR, partial response; SD, stable disease. Two patients whose lesions could not be reliably measured due to punctate lesions were excluded. d Representative radiographic images of pembrolizumab responders. Red dashed circle: locations of the lung metastatic lesions
Fig. 2
Fig. 2
Monocyte-related gene signature enriched in the PBMC of non-responders. a Schematic diagram of the study design and workflow. b UMAP visualization of 30,667 single-cell transcriptomes of immune cells identifying 23 populations and colored by cell type assignment. c Stacked histograms indicating the proportion of immune subsets in each patient. d Volcano plot depicting DEGs between NR and R. Four top genes enriched in the NR group are boxed with red dashed lines, and their expression is shown as UMAP feature plots (f). e GO pathway enrichment analysis of DEGs from PBMCs between NR and R. g UMAP visualization of monocytes. Left: Monocytes stratified by NR group (blue) and R group (yellow). Right: Monocytes stratified into four populations. h Proportions of monocyte subsets in each group. The numbers indicate the percentage of S100A9+CD14+ monocytes
Fig. 3
Fig. 3
Circulating S100A9+CD14+ monocyte predicts unfavorable responses to anti-PD-1 immunotherapy. a UMAP visualization of immune cells between NR and R. S100A9+CD14+ monocytes are boxed with red dashed lines. b Percentage of each immune subset between the NR group (blue) and R group (yellow), represented as box-whisker plots. Significance was evaluated using 2-way ANOVA. c Violin plots representing the percentage of S100A9+CD14+ monocytes in each patient. d Survival curves showing overall survival stratified by the percentage of S100A9+CD14+ monocyte. e Left: Representative image of dual immunofluorescence demonstrating S100A9 (red) and CD14 (green) positive cells and S100A9+CD14+ monocytes (white triangles) in HCC tumors of a responder and a non-responder. Right: Number of S100A9+CD14+ monocytes quantified in five randomly selected fields per patient (n = 4 in NR; n = 4 in R). Scale bar, 50 μm. f Levels of plasma S100A9 in patients among different ICB best efficacy. g ROC curves and the area under the curve (AUC) of the plasma S100A9 level (red) or NLR (dashed blue) for discrimination between responders and non-responders. The cut-off value for S100A9 level was 308.110 ng/ml. h Best efficacy of patients stratified by plasma S100A9 levels. i Survival curves showing progress-free survival stratified by the plasma S100A9 level. P value in (c and e) were calculated using unpaired Student’s t-test. P values in (d and i) were calculated using the log-rank test
Fig. 4
Fig. 4
Higher Mono_S100A9 signature score predicts worse ICB response and T cell dysfunction in cancer patients. a Genes in Mono_S100A9 signature. b Mono_S100A9 signature scores in patients with melanoma between NR and R. c Association of Mono_S100A9-signature score with overall survival within LIHC dataset obtained from TCGA. LIHC: Liver hepatocellular carcinoma. d Volcano plot showing DEGs of T cells between NR and R. e-g GSEA plots of the indicated signature genes from T cells between NR and R. h UMAP visualization of tumor infiltrating leukocytes (TILs) in HCC cohort SRP318499 or in HCC cohort CNP0000650 (j). i Heatmap plot showing the expression level of T-cell cytotoxicity genes in tumor-infiltrating T cells from HCC cohort SRP318499 and CNP0000650 (k). Patients were divided into two groups (Mono_CD14_S100A9 high (blue) and low (yellow)) based on their infiltration level of S100A9+CD14+ monocytes
Fig. 5
Fig. 5
Endogenous S100A9 enhances PD-L1 expression in monocytes to inhibit T-cell cytotoxicity. a KEGG pathway enrichment analysis of DEGs between S100A9+CD14+ monocytes and other circulating cells. b Percentage of S100A9+ cells (left) and PD-L1+ cells (right) in PBMC from healthy donors (HD, n = 5) and patients with hepatocellular carcinoma (HCC, n = 7), colorectal cancer (CRC, n = 5), and biliary tract cancer (BTC, n = 7). c-e PD-L1 levels in S100A9high or S100A9low cells in CD14+monocytes from patients with HCC, CRC, and BTC. f-h Correlation analysis between PD-L1 and S100A9 levels in CD14+monocytes from patients with HCC, CRC, and BTC. i S100A9 and CD274 (j) mRNA levels of S100A9-knockdown THP-1 cells transfected with si-S100A9#1, si-S100A9#2, and si-S100A9#3. k Representative flow cytometric plot (left) and quantification (right) of S100A9 levels in S100A9-knockdown THP-1 cells transfected with sh-S100A9#1 and sh-S100A9#2. l Representative flow cytometric plot (left) and quantification (right) of PD-L1 levels in S100A9-knockdown THP-1 cells transfected with sh-S100A9#1 and sh-S100A9#2. m the percentage of highly proliferated CFSElow of T cells co-cultured with S100A9-knockdown THP-1 cells at 96 h (n = 3). n TBX21, PRF1, IL2, and GZMB mRNA levels of T cells after co-cultured with S100A9-knockdown THP-1 cells for 24 h. P value in (b) was evaluated using the Mann–whitney U-test. P values in c-e were determined by two-tailed paired sample t-test. P values in i-m were determined by one-way ANOVA. P value in (n) was evaluated using 2-way ANOVA. Correlations were analyzed using the Spearman rank correlation test. *P < 0.05, **P < 0·01, ***P < 0.001 and ****P < 0.0001
Fig. 6
Fig. 6
Exogenous S100A9 enhances PD-L1 expression in monocytes to inhibit T-cell proliferation and cytotoxicity. a Representative flow cytometric plot (left) and quantification (right) of PD-L1 levels in primary human CD14+ monocytes (n = 3) treated with PBS or rS100A9 for 8 h. b Similar to (a), PD-L1 levels in THP-1 cells treated with PBS (n = 3), rS100A9 (n = 3), or pre-incubated tasquinimod plus rS100A9 (n = 3) for 24 h.c Schematic representation of the co-culture system. d Representative CFSE dilution profiles of T cells (left) and the percentage of highly proliferated CFSElow T cells at 96 h (right, n = 3). The peak of the CFSE-labelled unstimulated cells (gray, filled) is also shown. e The percentage of highly proliferated CFSElow T cells at 96 h in four groups: pre-incubated with IgG, pre-incubated with IgG and co-cultured with S100A9-treated THP-1, pre-incubated with αPD-1 antibody, pre-incubated with αPD-1 antibody and co-cultured with S100A9-treated THP-1. (n = 3). f The RUNX3 and TBX21 mRNA levels in T cells co-cultured with THP-1 cells treated with PBS or rS100A9 for 24 h. g Schematic showing S100A9 binding sites on CD274 promoter (left). Luciferase activities relative to the control were shown on the right (n = 3). MFI, mean of fluorescence intensity. CFSE: carboxyfluorescein succinimidyl ester. Unsti: unstimulated. Data are represented as mean ± S.E.M. P value in (a) was determined by two-tailed paired sample t-test.P value in (d) was determined using two-tailed unpaired Student’s t-tests. P value in (b) was determined by one-way ANOVA. P values in (e-g) were evaluated using 2-way ANOVA. *P < 0.05, **P < 0·01, ***P < 0.001 and ****P < 0.0001
Fig. 7
Fig. 7
Inhibition of S100A9 combined with anti-PD-1 therapy enhances anti-tumor response in vivo. a Schematic representation of the murine experimental workflow. b Weight curves and (c) tumor volume over time (n = 6 mice per group). d Number of CD3+ T cells, CD4+ T cells (e), CD8+ T cells (f), and GranzymB+CD8+ T cells (g) per gram of hepa1-6 tumor. h Schematic representation of the combination therapy workflow. i Weight curves and tumor volume (j) over time (n = 5–6 mice per group). k Tumor weight and pictures (l) of hepa1-6 tumors from four groups of mice (n = 5–6 mice per group). Scale bar, 1 cm. m Tumor growth curves of individual mice. i.g.: intragastric administration. q.d., once daily. i.p.: intraperitoneal injection. Data are represented as mean ± S.E.M. P values in (c and j) were determined by 2-way ANOVA.P values in (d and e) were determined using Mann–whitney U-test. P values in (f and g) were determined using two-tailed unpaired Student’s t-tests. P value in k was determined by one-way ANOVA. *P < 0.05, **P < 0·01, ***P < 0.001 and ****P < 0.0001
Fig. 8
Fig. 8
Working model for the effect of S100A9+CD14+ monocytes contribute to anti-PD-1 immunotherapy resistance. Abundant blood S100A9+CD14+ monocytes and high concentrate plasma S100A9 linked to poor HCC response to anti-PD-1. Mono_S100A9 signature inversely associated with survival of cancer patients. S100A9 enhanced PD-L1 expression on monocytes to inhibit T-cell proliferation and cytotoxicity. Blockage of S100A9 synergizes with anti-PD-1 drug to enhance HCC eradication

References

    1. El-Khoueiry AB, Sangro B, Yau T, Crocenzi TS, Kudo M, Hsu C, et al. Nivolumab in patients with advanced hepatocellular carcinoma (CheckMate 040): an open-label, non-comparative, phase 1/2 dose escalation and expansion trial. Lancet (London, England) 2017;389(10088):2492–2502. doi: 10.1016/S0140-6736(17)31046-2. - DOI - PMC - PubMed
    1. Zhu AX, Finn RS, Edeline J, Cattan S, Ogasawara S, Palmer D, et al. Pembrolizumab in patients with advanced hepatocellular carcinoma previously treated with sorafenib (KEYNOTE-224): a non-randomised, open-label phase 2 trial. Lancet Oncol. 2018;19(7):940–952. doi: 10.1016/S1470-2045(18)30351-6. - DOI - PubMed
    1. Qin S, Ren Z, Meng Z, Chen Z, Chai X, Xiong J, et al. Camrelizumab in patients with previously treated advanced hepatocellular carcinoma: a multicentre, open-label, parallel-group, randomised, phase 2 trial. Lancet Oncol. 2020;21(4):571–580. doi: 10.1016/S1470-2045(20)30011-5. - DOI - PubMed
    1. Finn RS, Qin S, Ikeda M, Galle PR, Ducreux M, Kim TY, et al. Atezolizumab plus Bevacizumab in Unresectable Hepatocellular Carcinoma. N Engl J Med. 2020;382(20):1894–1905. doi: 10.1056/NEJMoa1915745. - DOI - PubMed
    1. Xu J, Shen J, Gu S, Zhang Y, Wu L, Wu J, et al. Camrelizumab in Combination with Apatinib in Patients with Advanced Hepatocellular Carcinoma (RESCUE): A Nonrandomized, Open-label. Phase II Trial Clin Cancer Res. 2021;27(4):1003–1011. - PubMed