. 2024 Mar 7;29(1):157.
doi: 10.1186/s40001-023-01391-1.

Comparative analysis of the vaginal bacteriome and virome in healthy women living in high-altitude and sea-level areas

Affiliations

Comparative analysis of the vaginal bacteriome and virome in healthy women living in high-altitude and sea-level areas

Chaoran Li et al. Eur J Med Res. .

Abstract

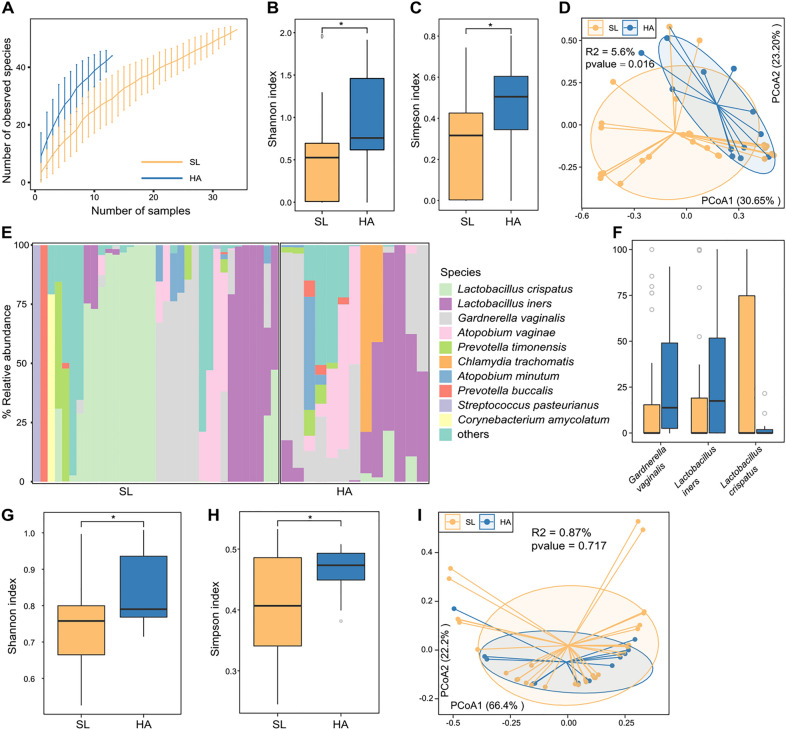
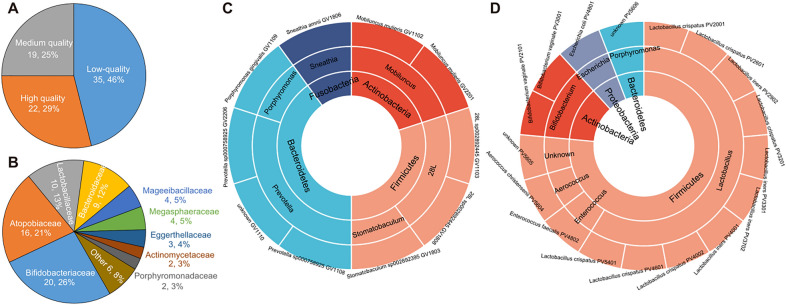
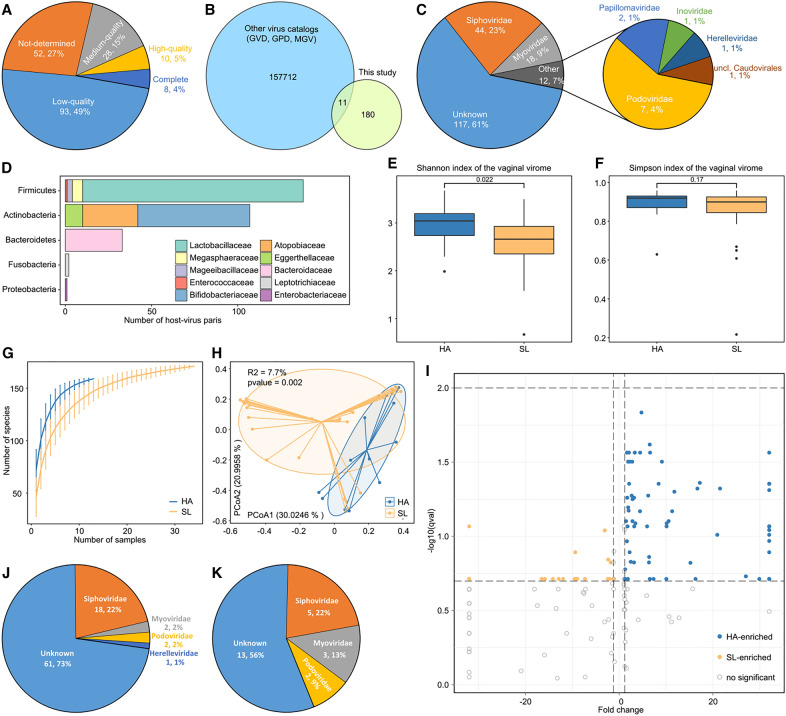
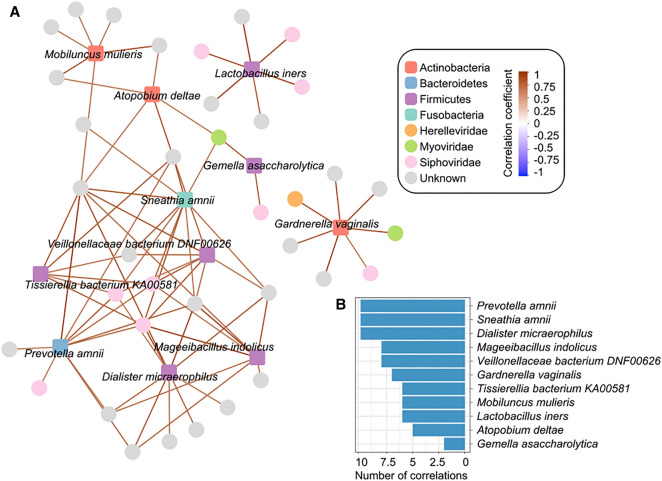
The vaginal microbiota plays an important role in the health of the female reproductive tract and is closely associated with various pregnancy outcomes and sexually transmitted diseases. Plenty of internal and external factors have strong influence on the changes in a woman's vaginal microbiome. However, the effect of a high-altitude on female vaginal microbiota has not been described. In this study, we characterized the vaginal bacteriome and virome of 13 and 34 healthy women living in high-altitude and sea-level areas, using whole-metagenome shotgun sequencing of their vaginal mucus samples. The results revealed that the vaginal bacteriomes of high-altitude individuals are featured by a significant increase of species diversity, depletion of Lactobacillus crispatus, and more abundant of some anaerobic bacteria, such as Chlamydia trachomatis, Mageeibacillus indolicus, Dialister micraerophilus, and Sneathia amnii). In addition, the vagina samples of sea-level subjects harbor more Lactobacillus strains, whereas the anaerobic bacteroidetes strains mostly appeared in high-altitude subjects. Identified and assembled 191 virus operational taxonomic units (vOTUs), there were significant differences in the abundance of 107 vOTUs between the two groups. Together, the results of this study raised the understanding of bacteriome and virome in the vagina of women at different elevations, and demonstrated that the vaginal microbiome is related to the high-altitude geographic adaptation.

Keywords: Bacteriome; High-altitude area; Vaginal microbiome; Virome; Whole-metagenome shotgun sequencing.


Conflict of interest statement

This manuscript has not been published elsewhere in whole or in part, and has been read and approved by all authors. All authors declare no competing interests.

Figures

Fig. 1
Fig. 1
Difference in vaginal bacteriome between HA and SL subjects. A Rarefaction curve analysis of the number of observed species on HA and SL group. The number of species in two groups is calculated based on a randomly selected specific number of samples with 30 replacements, and the whisker line shows the median and quartile. B, C Boxplot shows the Shannon diversity index (b) and the Simpson index (c) of vaginal bacteriome between HA and SL groups. The significance level in the Wilcoxon rank-sum test is denoted as: *p < 0.05. D PCoA analysis of Bray–Curtis distance based on the vaginal bacteriome. Locations of samples in the first two principal coordinates are shown, and the sample points in the same group are linked by lines, and ellipses cover each group of samples near the center of gravity. E Composition of vaginal bacteriome at the species level. F Boxplot shows the relative abundances of three representative differential vaginal species in the HA and SL individuals. G, H Boxplot shows the Simpson index (g) and Shannon diversity index (h) of vaginal functional composition that differs between the two groups. The significance level in the Wilcoxon rank-sum test is denoted as: *p < 0.05. I PCoA analysis of Bray–Curtis distance based on the vaginal functional composition
Fig. 2
Fig. 2
Comparison of metagenome-assembled genomes between HA and SL subjects. A Pie plot shows the proportions of high-, medium- and low-quality MAGs constructed by this study. B Pie plot showed the proportions of bacterial family-level assignment of the MAGs. C, D Taxonomic distribution of the HA-specific (c) and SL-specific (d) MAGs. For each sunburst chart, the stains names of MAGs are shown at the outermost circle, and the genus- and phylum-level taxonomic information are shown at the inner ring
Fig. 3
Fig. 3
Characteristics of the vaginal virome. A Pie plot shows the proportion of vOTUs of different qualities in the non-redundant virus catalog. B Venn plot shows the overlap of the virus catalog and the other three virus genome databases. C Pie of pie chart shows the family-level taxonomic annotation of the vOTUs. D Bacterial host assignment of the vOTUs. E, F Boxplot shows the Shannon diversity index (f) and the Simpson index (g) of vagina virome among two groups. The significance level was assessed using Wilcoxon rank-sum test. G Rarefaction curve analysis of the number of observed vOTUs on two groups. H PCoA analysis of Bray–Curtis distance based on the composition of vaginal virome. Shows the locations of samples in the first two principal coordinates, the sample points in the same group are linked by lines, and ellipses cover each group of samples near the center of gravity. I Volcano plot shows the fold change (X-axis) and q values (-log10 transformed; Y-axis) for all vOTUs. The vOTUs that enriched in HA and SL subjects (p < 0.05) are shown in blue and yellow dots, respectively. J, K Pie plots show the taxonomic distribution of HA-enriched vOTUs (j) and SL-enriched vOTUs (k)
Fig. 4
Fig. 4
Correlation analysis between the bacterial species and viruses. A Correlation network between 12 bacterial species and 62 vOTUs. Square nodes depict the bacterial species (color fill according to their phylum-level taxonomic assignment), and circle nodes depict the vOTUs (color fill according to their family-level taxonomic assignment). Connecting lines represent the SparCC correlations with graduated colors: brownish red, correlation coefficient > 0.6; blue, correlation coefficient < −0.6. B Bar-plot shows the number of correlations of 12 bacterial species

Similar articles

Cited by

References

    1. Almeida A, Nayfach S, Boland M, Strozzi F, Beracochea M, Shi ZJ, et al. A unified catalog of 204,938 reference genomes from the human gut microbiome. Nat Biotechnol. 2021;39:105–114. doi: 10.1038/s41587-020-0603-3. - DOI - PMC - PubMed
    1. Almeida A, Mitchell AL, Boland M, Forster SC, Gloor GB, Tarkowska A, et al. A new genomic blueprint of the human gut microbiota. Nature. 2019;568:499–504. doi: 10.1038/s41586-019-0965-1. - DOI - PMC - PubMed
    1. Jie Z, Chen C, Hao L, Li F, Song L, Zhang X, et al. Life history recorded in the vagino-cervical microbiome along with multi-omics. Genomics, Proteomics Bioinformatics. 2021 doi: 10.1016/j.gpb.2021.01.005. - DOI - PMC - PubMed
    1. Onderdonk AB, Delaney ML, Fichorova RN. The human microbiome during bacterial vaginosis. Clin Microbiol Rev. 2016;29:223–238. doi: 10.1128/CMR.00075-15. - DOI - PMC - PubMed
    1. Torcia MG. Interplay among vaginal microbiome, immune response and sexually transmitted viral infections. Int J Mol Sci. 2019;20:266. doi: 10.3390/ijms20020266. - DOI - PMC - PubMed