. 2024 Mar 7;22(1):248.
doi: 10.1186/s12967-024-04993-3.

Inhibition of OGFOD1 by FG4592 confers neuroprotection by activating unfolded protein response and autophagy after ischemic stroke

Affiliations

Inhibition of OGFOD1 by FG4592 confers neuroprotection by activating unfolded protein response and autophagy after ischemic stroke

Jian Xie et al. J Transl Med. .

Abstract

Background: Acute ischemic stroke is a common neurological disease with a significant financial burden but lacks effective drugs. Hypoxia-inducible factor (HIF) and prolyl hydroxylases (PHDs) participate in the pathophysiological process of ischemia. However, whether FG4592, the first clinically approved PHDs inhibitor, can alleviate ischemic brain injury remains unclear.

Methods: The infarct volumes and behaviour tests were first analyzed in mice after ischemic stroke with systemic administration of FG4592. The knockdown of HIF-1α and pretreatments of HIF-1/2α inhibitors were then used to verify whether the neuroprotection of FG4592 is HIF-dependent. The targets predicting and molecular docking methods were applied to find other targets of FG4592. Molecular, cell biological and gene knockdown methods were finally conducted to explore the potential neuroprotective mechanisms of FG4592.

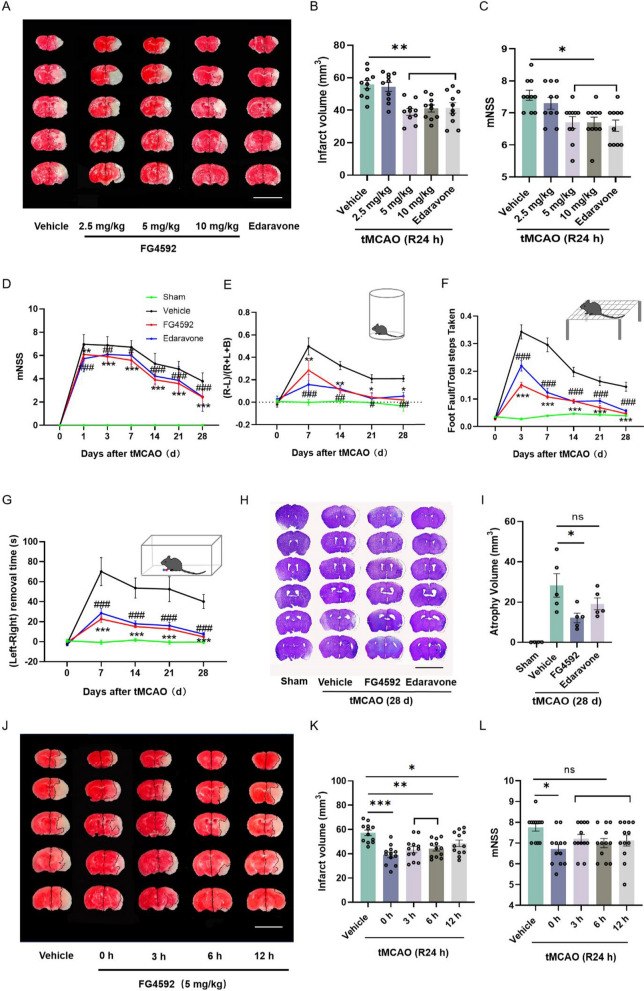
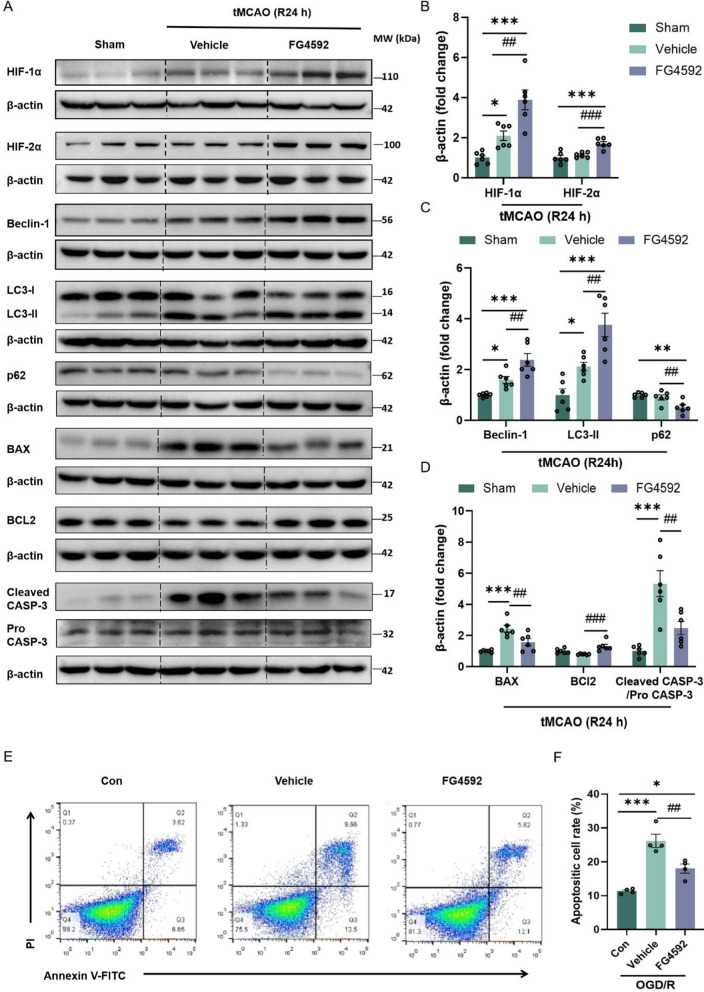
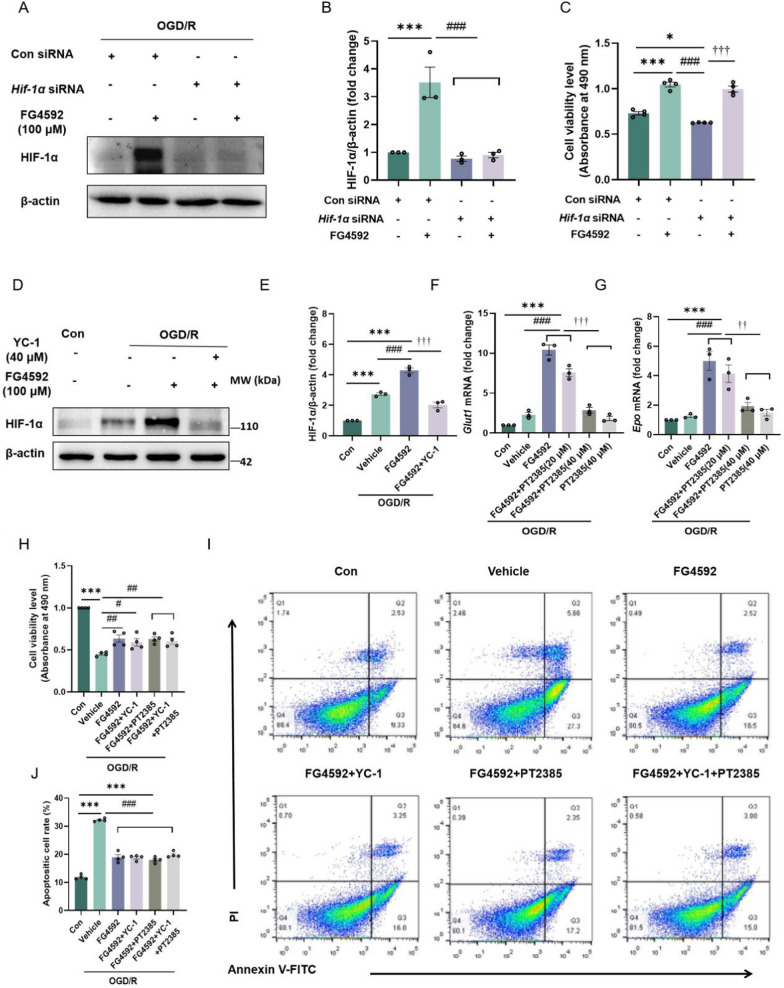
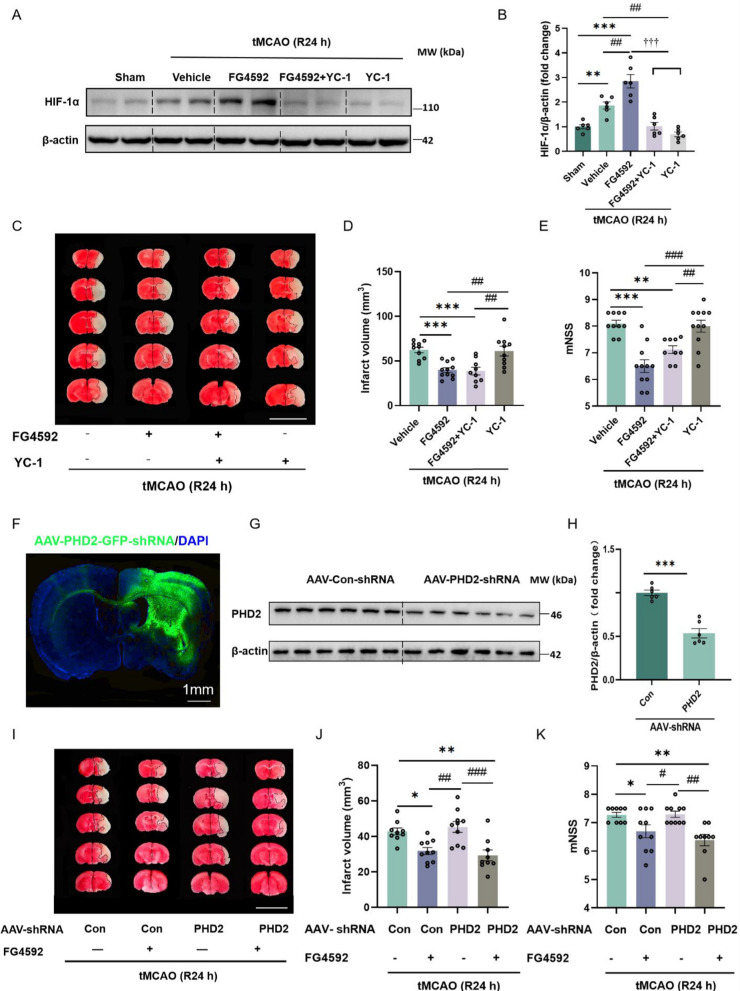
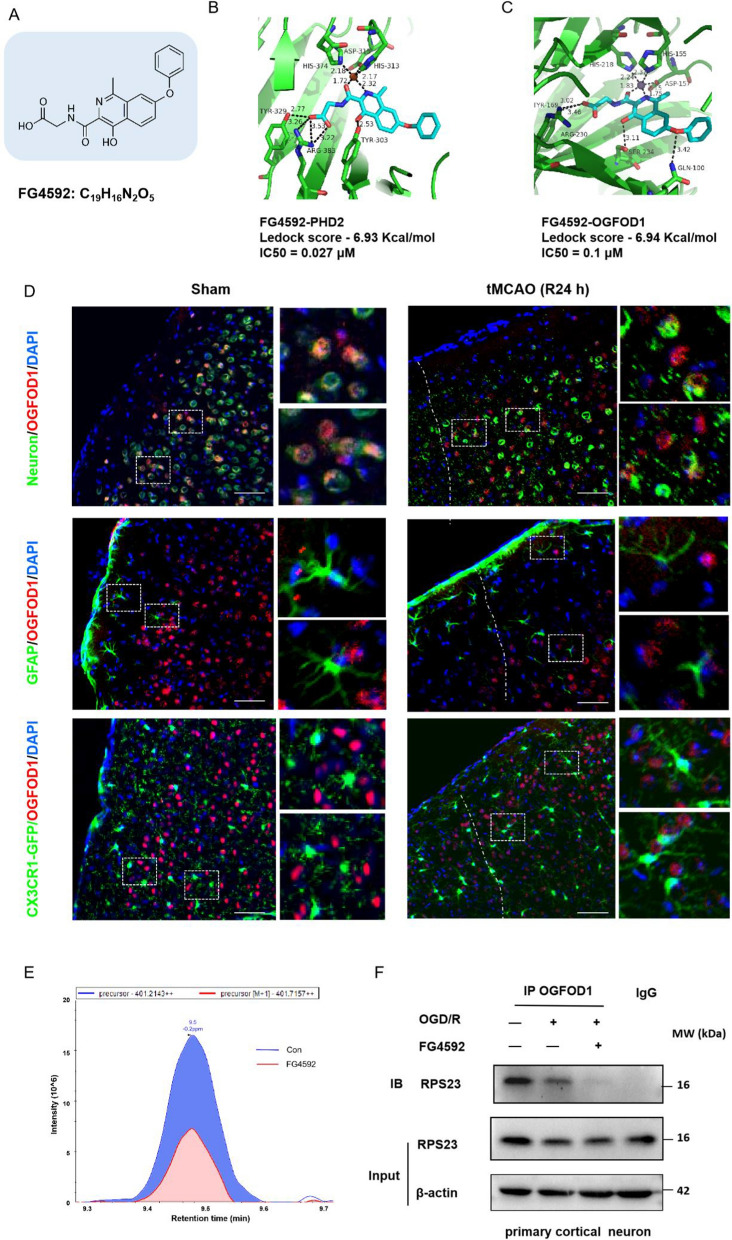
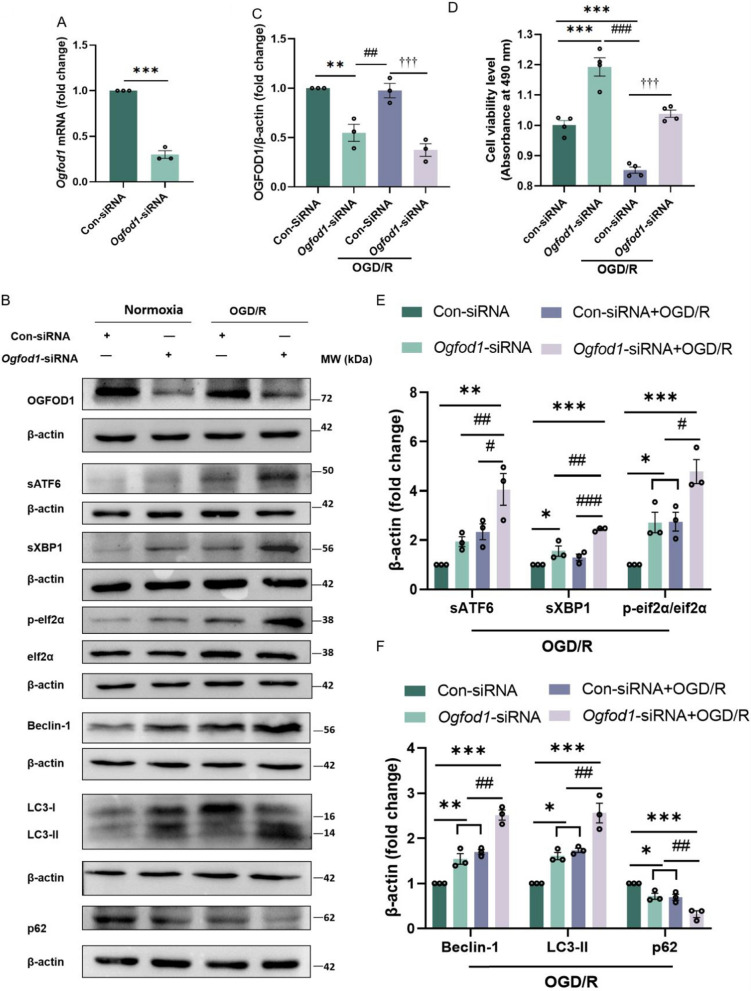
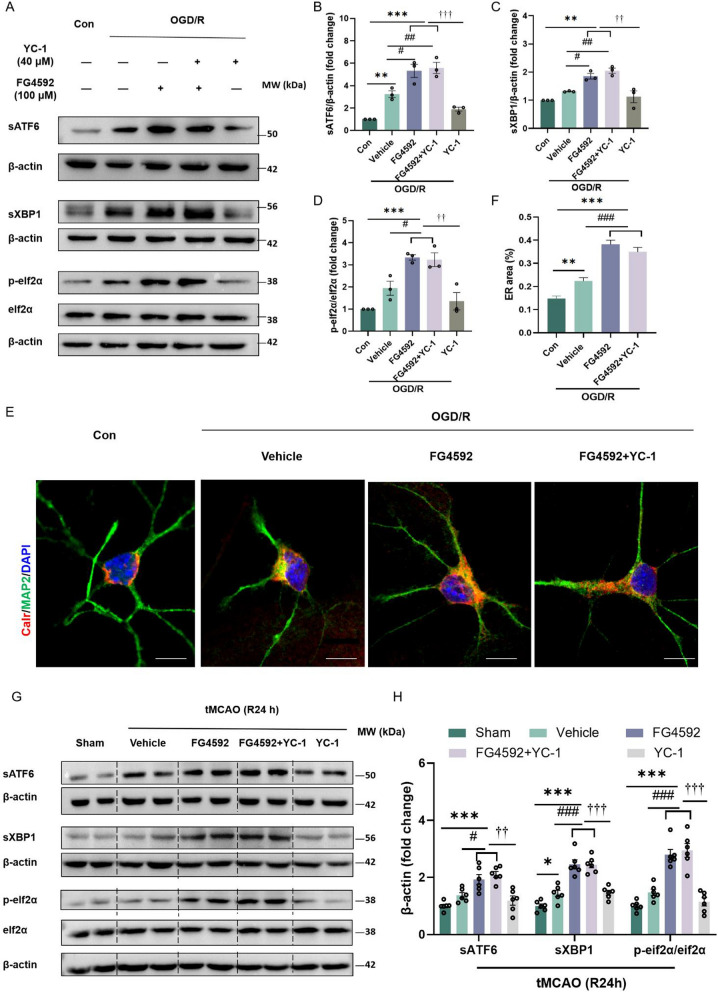
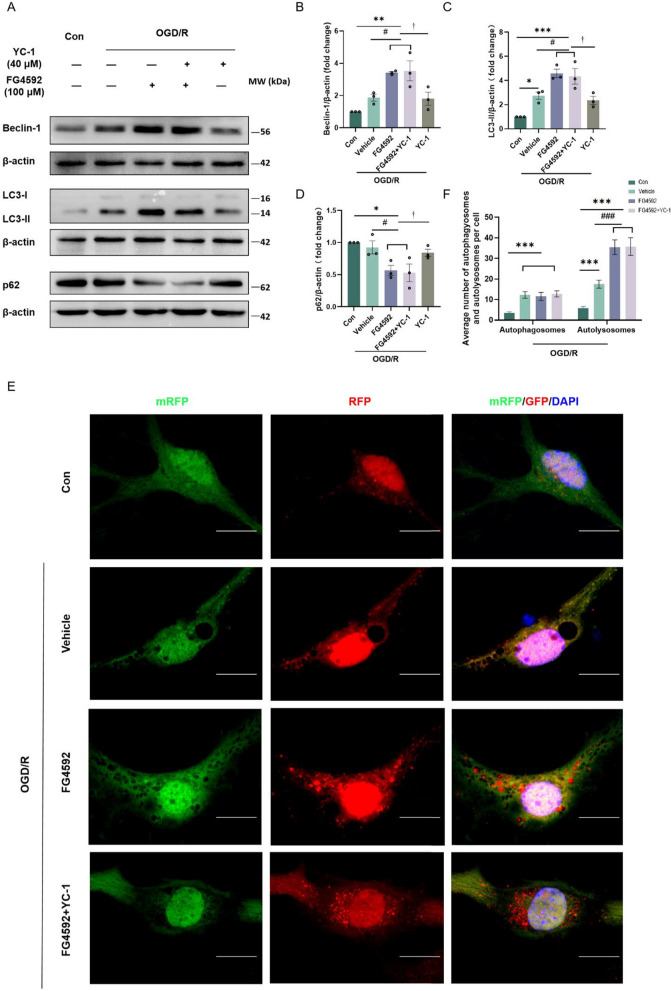
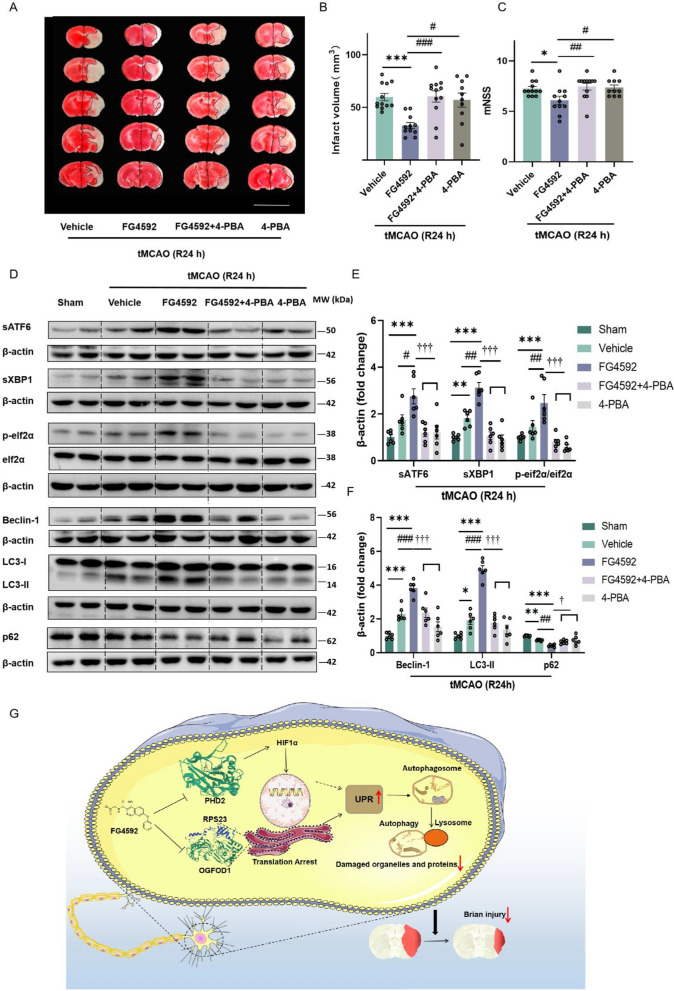
Results: We found that the systemic administration of FG4592 decreased infarct volume and improved neurological defects of mice after transient or permanent ischemia. Meanwhile, FG4592 also activated autophagy and inhibited apoptosis in peri-infarct tissue of mice brains. However, in vitro and in vivo results suggested that the neuroprotection of FG4592 was not classical HIF-dependent. 2-oxoglutarate and iron-dependent oxygenase domain-containing protein 1 (OGFOD1) was found to be a novel target of FG4592 and regulated the Pro-62 hydroxylation in the small ribosomal protein s23 (Rps23) with the help of target predicting and molecular docking methods. Subsequently, the knockdown of OGFOD1 protected the cell against ischemia/reperfusion injury and activated unfolded protein response (UPR) and autophagy. Moreover, FG4592 was also found to activate UPR and autophagic flux in HIF-1α independent manner. Blocking UPR attenuated the neuroprotection, pro-autophagy effect and anti-apoptosis ability of FG4592.

Conclusion: This study demonstrated that FG4592 could be a candidate drug for treating ischemic stroke. The neuroprotection of FG4592 might be mediated by inhibiting alternative target OGFOD1, which activated the UPR and autophagy and inhibited apoptosis after ischemic injury. The inhibition of OGFOD1 is a novel therapy for ischemic stroke.

Keywords: Autophagy; FG4592; Ischemic stroke; OGFOD1; Unfolded protein response.


Conflict of interest statement

The authors declare that there are no competing interests.

Figures

Fig. 1
Fig. 1
FG4592 alleviates injury and improves the recovery of sensorimotor defects after transient ischemia. A Representative TTC staining image of brain sections from mice after 24 h of tMCAO. Layer thickness = 1 mm, scar bar = 1 cm. B Infarct volume 24 h after tMCAO in the vehicle (n = 10), FG4592 (2.5 mg/kg, n = 10), FG4592 (5 mg/kg, n = 10), FG4592 (10 mg/kg, n = 10) and Edaravone (3 mg/kg, twice after reperfusion, n = 10) groups. Data are presented as mean ± SEM. Vehicle vs other groups: **p < 0.01 (one-way ANOVA followed by Dunnett’s post-hoc test). C mNSS score of mice after 24h of tMCAO. Data are presented as mean ± SEM. Vehicle vs other groups: *p < 0.05 (non-parametric Kruskal-Wallis test followed by Dunn’s post-hoc). D-G The sensorimotor functions of mice were analyzed by mNSS score, cylinder test, foot fault task and adhesive removal test up to 28 days after tMCAO. Data are presented as mean ± SEM. FG4592 (n = 11) vs vehicle (n = 12): ***p < 0.001, **p < 0.01, *p < 0.05. Edaravone (n = 11) vs vehicle: ###p < 0.001, ##p < 0.01, #p < 0.05 (two-way repeated-measures ANOVA followed by Holm-Sidak post-hoc multiple-comparison tests). H The representative crystal violet staining images correspond to coronal brain sections from mice after 28 days of tMCAO. Five mice were randomly selected from each group after the behaviour tests. Scar bar = 1cm. I Measurement of the atrophy volume of the infarct hemisphere. Vehicle vs FG4592: *p < 0.05, ns: no significance (one-way ANOVA followed by Dunnett’s post-hoc test, n = 5). J The representative TTC staining images of mice administrated with FG4592 at different time points after tMCAO. Layer thickness = 1 mm, scar bar = 1 cm. K and L The infarct volumes (one-way ANOVA followed by Dunnett’s post-hoc test) and mNSS scores (non-parametric Kruskal-Wallis test followed by Dunn’s post-hoc) of the vehicle (n = 12), 0-hour (n = 12), 3 hours (n = 12), 6 hours (n = 12) and 12 hours (n = 12) groups. Data are presented as mean ± SEM. vehicle vs other groups: ***p < 0.001, **p < 0.01, *p < 0.05, ns: no significance
Fig. 2
Fig. 2
FG4592 activates autophagy and inhibits the apoptotic pathway after I/R injury. A Western blot images of HIF-1ɑ, HIF-2ɑ, Beclin-1, LC3-II, p62/SQSTM1, BAX, BCl2, cleaved-caspase-3 and caspase-3 in the peri-infarct brain tissues of Sham, vehicle and FG4592 groups after 24 hours of tMCAO. B-D Immunoblot analyses of proteins are shown in panel A. Data are presented as mean ± SEM. Sham vs vehicle or FG4592: ***p < 0.001, **p < 0.01, *p < 0.05. vehicle vs FG4592: ###p < 0.001, ##p < 0.01 (one-way ANOVA followed by Dunnett’s post-hoc test, n = 6 in each group). E and F Apoptotic cell analyses of HT-22 cells were detected using an Annexin V-FITC apoptosis flow cytometry. Cells underwent OGD for 3 hours and were treated with FG4592 or vehicle for 6 hours after reperfusion. The fractions of apoptotic cells were semi-quantified by Flowjo software. Data are presented as the mean ± SEM and from four independent experiments. Sham vs vehicle or FG4592: ***p < 0.001, *p < 0.05. vehicle vs FG4592: ##p < 0.01 (one-way ANOVA followed by Dunnett’s post-hoc test)
Fig. 3
Fig. 3
FG4592 exerts a neuroprotective effect in a HIF-α independent manner in vitro after I/R injury. A and B Representative immunoblot and analysis of HIF-1ɑ in HT-22 cells transfected with con siRNA or Hif-1α siRNA for 48 hours and further treated with FG4592 after OGD. Data are presented as the mean ± SEM, Con siRNA vs Con siRNA+FG4592: ***p < 0.001, Con siRNA+FG4592 vs Hif-1α siRNA or Hif-1α siRNA+FG4592: ###p < 0.001 (one-way ANOVA followed by Dunnett’s post-hoc test, n = 3). C The cell viability of HT-22 cells was measured by the absorbance of formazan products following OGD/R. Results are presented as mean ± SEM from four independent experiments, Con siRNA vs Con siRNA+FG4592 or Hif-1α siRNA: ***p < 0.001, *p < 0.05. Con siRNA+FG4592 vs Hif-1α siRNA: ###p < 0.001. Hif-1α siRNA vs Hif-1α siRNA+FG4592: †††p < 0.001 (one-way ANOVA followed by Dunnett’s post-hoc test). D and E Immunoblot and analysis of HIF-1ɑ in HT-22 cells. The cells of YC-1 groups were pretreated with YC-1 before 1 hour of OGD/R. All experimental groups underwent OGD for 3 hours and were treated with vehicle or FG4592 for 6 hours after reperfusion. F and G The relative expressions of Glut1 and Epo mRNA in HT-22 cells after OGD/R. The cells of PT-2385 pretreated groups were first dealt with PT-2385 for 1 hour before OGD/R. All experimental groups underwent OGD/R for 3 hours and were treated with vehicle or FG4592 for 6 hours after OGD/R. Data are presented as the mean ± SEM and from three independent experiments. Con vs other groups: ***p < 0.001, **p < 0.01, vehicle vs other groups: ###p < 0.001, FG4592 or FG4592+PT2385 (20 μM) vs FG4592+PT2385 (40 μM) or PT2385 (40 μM): †††P < 0.001 (one-way ANOVA followed by Dunnett’s post-hoc test, n = 3). H The cell viability of HT-22 cells was measured by the absorbance of formazan products following OGD/R. The cells of YC-1 and/or PT-2385 pretreated groups were first dealt with YC-1 and/or PT-2385 for 1 hour before OGD/R. All experimental groups underwent OGD/R for 3 hours and were treated with vehicle or FG4592 for 6 hours after OGD/R. Results are presented as mean ± SEM from four independent experiments, Con vs vehicle: ***p < 0.001. vehicle vs other groups: ##p < 0.01, #p < 0.05. I and J Apoptotic cell rates of HT-22 cells after OGD/R were examined by Annexin V-FITC/PI-labeled flow cytometry. Data are expressed as mean ±SEM of four independent experiments. Con vs other groups: ***p < 0.001. vehicle vs other groups: ###p < 0.001 (one-way ANOVA followed by Dunnett’s post-hoc test)
Fig. 4
Fig. 4
FG4592 maintains a neuroprotective effect in a HIF-α independent manner in vivo after I/R injury. A and B Representative western blots and statistical analyses of band intensity of HIF-1ɑ protein in peri-infarct brain tissue of mice after 24 h of tMCAO. The mice of YC-1 pretreated groups were injected with YC-1 (10 mg/kg, ip) for 1 hour before tMCAO. All experimental groups were subjected to tMCAO and treated with FG4592 or vehicle after 5 min of reperfusion. Data are presented as mean ± SEM. Sham vs vehicle or FG4592: ***p < 0.001, **p < 0.01. vehicle vs FG4592 or FG4592+YC-1 or YC-1: ##p < 0.01. FG4592 vs FG4592+YC-1 or YC-1: †††p < 0.001 (one-way ANOVA followed by Dunnett’s post-hoc test, n=6). C Representative images of brain TTC staining from mice in each group. Layer thickness = 1 mm, scar bar = 1 cm. D and E The infarct volumes (one-way ANOVA followed by Dunnett’s post-hoc test) and mNSS scores (non-parametric Kruskal-Wallis test followed by Dunn’s post-hoc) of the vehicle (n = 10), FG4592 (n = 11), FG4592+YC-1 (n = 9) and YC-1 groups (n = 10) after 24 h of tMCAO. Data are presented as mean ± SEM. vehicle vs FG4592 or FG4592+YC-1: ***p < 0.001, **p < 0.01. YC-1 vs FG4592 or FG4592+YC-1: ###p < 0.001, ##p < 0.01. F Fluorescent staining of mouse brains injected with AAV-PHD2-shRNA in situ for 28 d (Left: 4×, Scale bar, 1 mm). G and H Representative western blot and protein level of PHD2 in mouse brains. All mice were cortical in situ injected with AAV-PHD2-GFP-shRNA or AAV-Con-GFP-shRNA virus for 28 days (n = 6 in each group). Data are presented as mean ± SEM. AAV-Con-shRNA vs AAV-PHD2-shRNA: ***p < 0.001 (student’s t-test. n = 6). I Representative images of TTC-stained brain slices of mice after 24 hours of tMCAO. All mice were cortical in situ injected with AAV-Con-shRNA or AAV-PHD2-shRNA for 28 days and underwent tMCAO. Layer thickness = 1 mm, scar bar = 1 cm. J and K The quantitative infarct volume and mNSS of AAV-Con-shRNA (n = 9), AAV-Con-shRNA+FG4592 (n = 10), AAV-PHD2-shRNA (n = 10) and AAV-PHD2-shRNA + FG4592 (n = 9) groups after 24 hours of tMCAO. Data are presented as mean ± SEM, AAV-Con-shRNA vs AAV-Con-shRNA+FG4592 or AAV-PHD2-shRNA+FG4592: **p < 0.01, *p < 0.05. AAV-PHD2-shRNA vs AAV-Con-shRNA + FG4592 or AAV-PHD2-shRNA+ FG4592: ###p < 0.001, ##p < 0.01, #p < 0.05 (one-way ANOVA followed by Dunnett’s post-hoc test for infarct volume, non-parametric Kruskal-Wallis test followed by Dunn’s post-hoc for mNSS)
Fig. 5
Fig. 5
FG4592 inhibits the enzymatic activity of OGFOD1 and blocks its combination and hydroxylation of RPS23. A Molecular structure of FG4592. B and C Docking analyses of FG4592 covalent binding modes to PHD2 and OGFOD1. D The fluorescent staining images of OGFOD1 and different neural cell markers in healthy brains of mice or peri-infarct brains of mice after 24 hours of tMCAO. The NeuN and GFAP were markers of neurons and astrocytes, respectively. The brain slices of CX3CR1-GFP mice were used to exhibit the microglia. Scale bar, 100 μm, 40 ×. E The hydroxylation area of Pro-62 within RPS23 immunoprecipitated. Cells were dealt with vehicle or 100 μM FG4592 for 24 hours, and its split product was immunoprecipitated by anti-RPS23. F Representative western blots of RPS23 in the anti-OGFOD1 immunoprecipitates and input groups. Primary neuron cells underwent OGD for 3 hours and were treated with vehicle or FG4592 for 6 hours after reperfusion. The cell extracts were immunoprecipitated with OGFOD1 antibody or control IgG and immunoblotted for RPS23
Fig. 6
Fig. 6
OGFOD1 knockdown activates UPR and protects cells against I/R injury. A The mRNA level of Ogfod1 in HT-22 cells transfected with Con-siRNA and Ogfod1-siRNA for 36 hours previously. Con-siRNA vs Ogfod1-siRNA: ***p < 0.001 (student’s t-test. n = 3). B Representative western blots of OGFOD1, sATF6, sXBP1, p-eIF2ɑ, Beclin-1, LC3-II and p62/SQSTM1 in HT-22 cells. Cells were transfected with Con-siRNA or Ogfod1-siRNA for 48 hours and underwent OGD (3 hours)/R (6 hours). C The quantitative results of OGFOD1 in HT-22 cells transfected with con-siRNA or Ogfod1-siRNA for 48 hours and subjected to OGD/R. Data are presented as the mean ± SEM, Con-siRNA vs Ogfod1-siRNA: **p < 0.01, Ogfod1-siRNA vs Ogfod1-siRNA + OGD/R: ##p < 0.01, Ogfod1-siRNA+OGD/R vs Con-siRNA+OGD/R: †††p < 0.001 (one-way ANOVA followed by Dunnett’s post-hoc test, n = 3). D The cell viability of HT-22 cells was measured by the absorbance of formazan products following OGD/R. Cells were transfected with Con-siRNA or Ogfod1-siRNA for 48 hours and underwent OGD (3 hours)/R (6 hours). Results are presented as mean ± SEM from four independent experiments, Con-siRNA vs Ogfod1-siRNA or Ogfod1-siRNA+OGD/R: ***p < 0.001, Ogfod1-siRNA vs Ogfod1-siRNA+OGD/R: ###p < 0.001, Ogfod1-siRNA+OGD/R vs Con-siRNA+OGD/R: †††p < 0.001 (one-way ANOVA followed by Dunnett’s post-hoc test). E and F The quantitative results of sATF6, sXBP1, p-eIF2ɑ, Beclin-1, LC3-II and p62/SQSTM1 in HT-22 cells transfected with Con-siRNA or Ogfod1-siRNA for 48 hours and subjected to OGD/R. Data are presented as the mean ± SEM, Con-siRNA vs other groups: ***p < 0.001, **p < 0.01, *p < 0.05. Ogfod1-siRNA+OGD/R vs Ogfod1-siRNA or Con-siRNA+OGD/R: ###p < 0.001, ##p < 0.01, #p < 0.05 (one-way ANOVA followed by Dunnett’s post-hoc test, n = 3)
Fig. 7
Fig. 7
FG4592 also activates the UPR in a HIF-1α independent way in vitro and in vivo. A-D Immunoblots and quantitative analyses of sATF6, sXBP1 and p-eIF2ɑ in primary cortical neurons. Cells of YC-1 groups were pretreated with YC-1 for 1 hour previously. All experimental groups were treated with OGD for 3 hours and then treated with vehicle or FG4592 after reperfusion. Data are presented as the mean ± SEM, Con vs other groups: ***p < 0.001, **p < 0.01, vehicle vs FG4592: ##p < 0.01, #p < 0.05, FG4592 or FG4592+YC-1 vs YC-1: †††p < 0.001, ††p < 0.001 (one-way ANOVA followed by Dunnett’s post-hoc test, n = 3). E Representative confocal immunofluorescence images labelled with the ER marker calreticulin and the MAP2 in the primary cortical neurons. Scale bar = 10 μm. F The quantitative analysis of the ER area of different groups. Data are presented as mean ± SEM and were randomly from three independent coverslips. Con vs other groups: ***p<0.001, **p<0.01. Vehicle vs FG4592 or FG4592+YC-1: ###p < 0.001 (one-way ANOVA followed by Dunnett’s post-hoc test, n = 40 neurons in each group). G The representative western blots of sATF6, sXBP1 and p-eif2α in peri-infarct tissue of mice after 24 hours of tMCAO. Mice pretreated with YC-1 were injected with YC-1 intraperitoneally 1 hour before tMCAO. The experimental groups were treated with vehicle or FG4592 after tMCAO. H The statistical analysis of sATF6, sXBP1 and p-eif2α in the G panel. Data are presented as mean ± SEM. Sham vs other groups: ***p < 0.001, *p < 0.05. vehicle vs FG4592 or FG4592+YC-1 group: ###p < 0.001, #p < 0.05. YC-1 vs FG4592 or FG4592+YC-1 group: †††p < 0.001, ††p < 0.01 (one-way ANOVA followed by Dunnett’s post-hoc test, n = 6 in each group)
Fig. 8
Fig. 8
FG4592 activates autophagy flux in a HIF-1α independent way in primary cortical neurons. A Western blots analysis of autophagic proteins in the primary cortical neurons, including Beclin-1, LC3-II and p62/SQSTM1. Cells of YC-1 groups were first pretreated with YC-1 for 1 hour. All experimental groups were dealt with OGD for 3 hours and then treated with vehicle or FG4592 after reperfusion. B-D The bar graphs of western blot data in panel A. β-actin was used as a loading control. Data are presented as mean ± SEM, Con vs other groups: ***p < 0.001, **p < 0.01, *p < 0.05. vehicle vs FG4592 or FG4592+YC-1: #p < 0.05. YC-1 vs FG4592 or FG4592+YC-1: †p < 0.05 (one-way ANOVA followed by Dunnett’s post-hoc test, n = 3). E Representative confocal microscopy images correspond to the autophagic flux analysis for primary cortical neurons. Primary cortical neurons were transfected with mRFP-GFP-MAP1LC3B adenovirus for 4 days. Cells of the YC-1 group were pretreated with YC-1 for 1 hour. All experimental groups were dealt with OGD and then treated with vehicle or FG4592 after reperfusion. Scale bar = 10 μm, 100×. F The number of yellow (autophagosomes) and red (autolysosomes) puncta were counted. Data represented as mean ± SEM from three independent coverslips. Con vs other groups: ***p < 0.001, vehicle vs FG4592 or FG4592+YC-1: ###p < 0.001 (one-way ANOVA followed by Dunnett’s post-hoc test, n = 40 neurons in each group)
Fig. 9
Fig. 9
The neuroprotective function of FG4592 is attenuated by UPR inhibiting. A Representative TTC images corresponding to coronal brain sections from mice treated with vehicle (n = 12), FG4592 (5 mg/kg, n = 11), FG4592 + 4-PBA (inhibitor of ER stress, 42 mg/kg, n = 12) and 4-PBA (42 mg/kg, n = 10) on one day after tMCAO. 4-PBA was injected 1 hour before surgery. All experimental groups underwent 1 hour of tMCAO and 24 hours of reperfusion. Layer thickness = 1 mm, scar bar = 1 cm. B and C The infarct volumes (one-way ANOVA followed by Dunnett’s post-hoc test) and mNSS score (non-parametric Kruskal-Wallis test followed by Dunn’s post-hoc) were assessed 24 hours after reperfusion. Data are presented as mean ± SEM, vehicle vs FG4592: ***p < 0.001, *p < 0.01. FG4592 vs FG4592+4-PBA or 4-PBA: ###p < 0.001, ##p < 0.01, #p < 0.01. D-F Representative immunoblots and bar graphs of sATF6, sXBP1, p-eif2α, Beclin-1, LC3-II and p62 in peri-infarct tissue of mouse brains after 24 hours of tMCAO. The data are expressed as mean ± SEM. Sham vs vehicle or FG4592: ***p < 0.001, **p < 0.01, *p < 0.05. vehicle vs FG4592: ###p < 0.001, ##p < 0.01, #p < 0.05, FG4592 vs FG4592+4-PBA or 4-PBA: †††p < 0.001, †p < 0.05 (one-way ANOVA followed by the Dunnett’s post-hoc test. n = 6). G The schematic diagram for the activation role of FG4592 in UPR. The activation of UPR by FG4592 may involve two pathways. Namely, FG4592 can activate the UPR via inhabiting its novel target OGFOD1 or possibly inhibiting the classical target PHD2. The activation of UPR subsequently promotes autophagy and alleviates I/R injury

Similar articles

Cited by

References

    1. Collaborators GBDS. Global, regional, and national burden of stroke and its risk factors, 1990–2019: a systematic analysis for the Global Burden of Disease Study 2019. Lancet Neurol. 2021;20(10):795–820. doi: 10.1016/S1474-4422(21)00252-0. - DOI - PMC - PubMed
    1. Wang YJ, Li ZX, Gu HQ, Zhai Y, Zhou Q, Jiang Y, et al. China Stroke Statistics: an update on the 2019 report from the National Center for Healthcare Quality Management in Neurological Diseases, China National Clinical Research Center for Neurological Diseases, the Chinese Stroke Association, National Center for Chronic and Non-communicable Disease Control and Prevention, Chinese Center for Disease Control and Prevention and Institute for Global Neuroscience and Stroke Collaborations. Stroke Vasc Neurol. 2022;7(5):415–450. doi: 10.1136/svn-2021-001374. - DOI - PMC - PubMed
    1. Mendelson SJ, Prabhakaran S. Diagnosis and management of transient ischemic attack and acute ischemic stroke: a review. JAMA. 2021;325(11):1088–1098. doi: 10.1001/jama.2020.26867. - DOI - PubMed
    1. O'Collins VE, Macleod MR, Donnan GA, Horky LL, van der Worp BH, Howells DW. 1,026 experimental treatments in acute stroke. Ann Neurol. 2006;59(3):467–477. doi: 10.1002/ana.20741. - DOI - PubMed
    1. Ralph GS, Parham S, Lee SR, Beard GL, Craigon MH, Ward N, et al. Identification of potential stroke targets by lentiviral vector mediated overexpression of HIF-1 alpha and HIF-2 alpha in a primary neuronal model of hypoxia. J Cereb Blood Flow Metab. 2004;24(2):245–258. doi: 10.1097/01.WCB.0000110532.48786.46. - DOI - PubMed

Publication types

Substances