. 2024 Mar 7;21(1):12.
doi: 10.1186/s12989-024-00568-8.

Macrophage-derived exosomal HMGB3 regulates silica-induced pulmonary inflammation by promoting M1 macrophage polarization and recruitment

Affiliations

Macrophage-derived exosomal HMGB3 regulates silica-induced pulmonary inflammation by promoting M1 macrophage polarization and recruitment

Xiaofeng Qin et al. Part Fibre Toxicol. .

Abstract

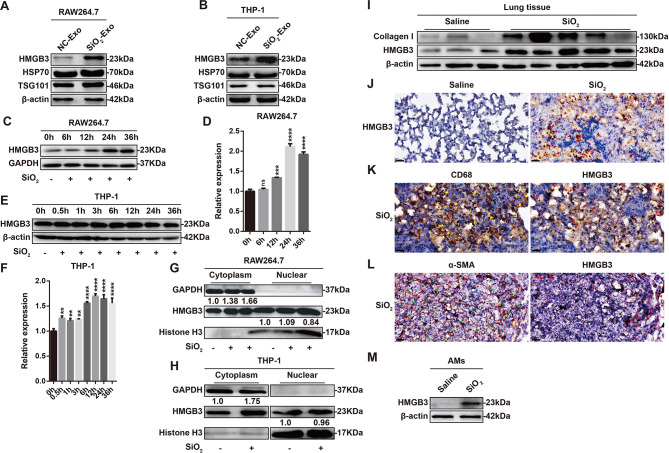
Background: Chronic inflammation and fibrosis are characteristics of silicosis, and the inflammatory mediators involved in silicosis have not been fully elucidated. Recently, macrophage-derived exosomes have been reported to be inflammatory modulators, but their role in silicosis has not been explored. The purpose of the present study was to investigate the role of macrophage-derived exosomal high mobility group box 3 (HMGB3) in silica-induced pulmonary inflammation.

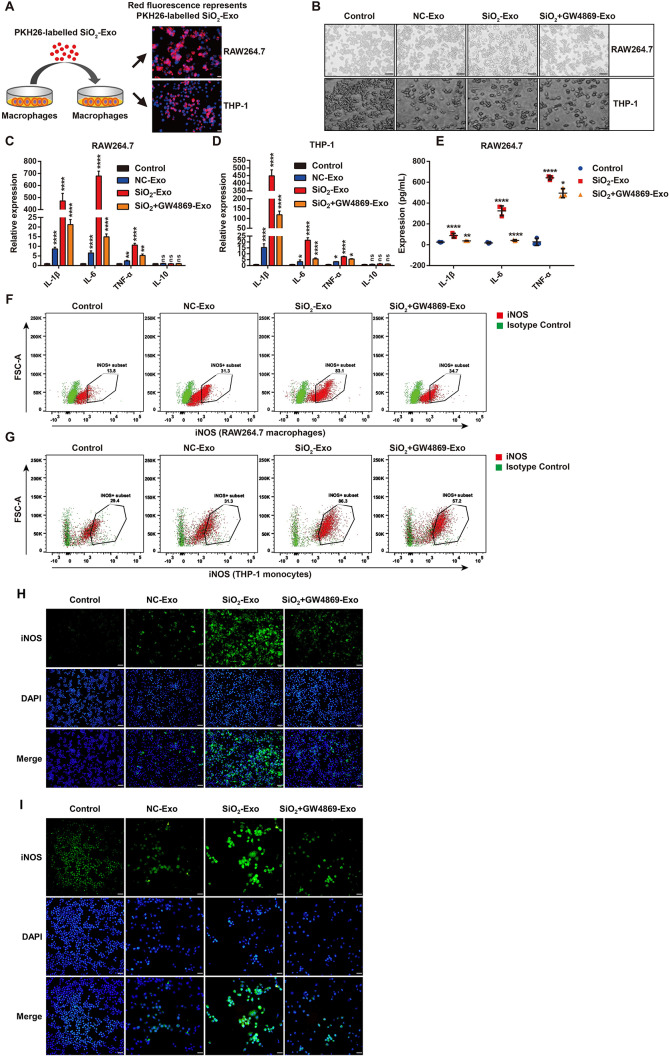
Methods: The induction of the inflammatory response and the recruitment of monocytes/macrophages were evaluated by immunofluorescence, flow cytometry and transwell assays. The expression of inflammatory cytokines was examined by RT-PCR and ELISA, and the signalling pathways involved were examined by western blot analysis.

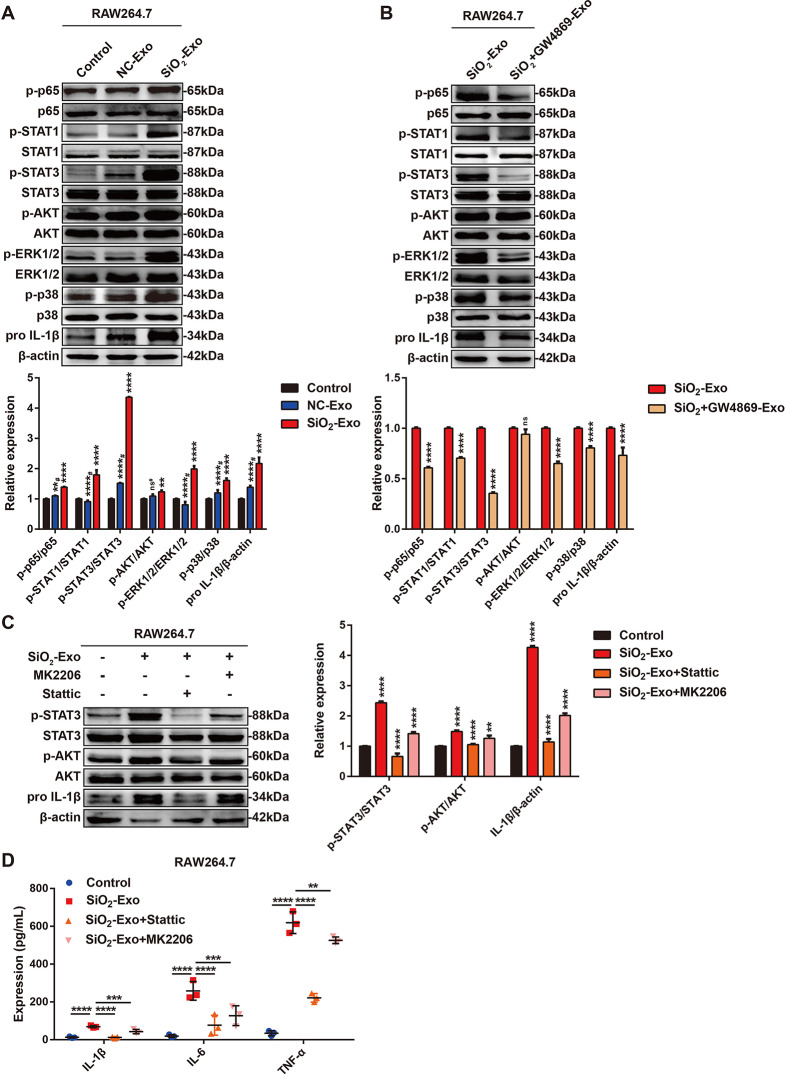
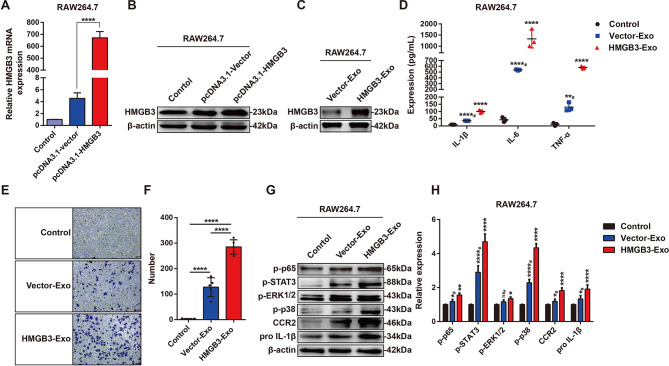
Results: HMGB3 expression was increased in exosomes derived from silica-exposed macrophages. Exosomal HMGB3 significantly upregulated the expression of inflammatory cytokines, activated the STAT3/MAPK (ERK1/2 and p38)/NF-κB pathways in monocytes/macrophages, and promoted the migration of these cells by CCR2.

Conclusions: Exosomal HMGB3 is a proinflammatory modulator of silica-induced inflammation that promotes the inflammatory response and recruitment of monocytes/macrophages by regulating the activation of the STAT3/MAPK/NF-κB/CCR2 pathways.

Keywords: HMGB3; Inflammation; Macrophage polarization; Silicosis.


Conflict of interest statement

The authors declare no competing interests.

Figures

Fig. 1
Fig. 1
The number of exosomes secreted by alveolar macrophages is significantly increased in the BALF of mice with silicosis. (A). Representative image of CD68 expression in the lung tissue of mice treated with saline or silica dust and examined by immunohistochemical staining (scale bar = 50 μm). (B-D). After 28 days of exposure to silica dust, BALF was collected, the morphology of the cells in BALF was observed by Giemsa staining (scale bar = 20 μm), and CD68 expression in these cells was examined by western blot analysis (B). The number of AMs in the BALF (C) and the expression of IL-1β, IL-6 and TNF-α in AMs were examined by RT–PCR (D). n = 5 mice per group. Saline = saline-treated mice; silica = silica dust-treated mice. (E-H). Exosomes were isolated from the BALF of mice treated with saline or silica dust, the expression of exosome-related markers (HSP70, TSG101 and CD63) was examined by western blot analysis (E), exosome morphology was observed by TEM (scale bar = 100 nm) (F), the size distribution of the exosomes was analysed by NTA (G), and the total exosomal protein concentration was examined by a micro-BCA assay (H). n = 15 mice per group. (I). Representative image showing the expression of CD68, CD31, PDPN, SP-B, caveolin-1 and HSP70 in exosomes derived from BALF and measured by western blot analysis. n = 15 mice per group. The data are representative of three individual experiments and expressed as the mean ± SEM. The data were analysed by two-tailed Student’s t test or two-way ANOVA. *P < 0.05, **P < 0.01, ***P < 0.001, ****P < 0.0001, ns = not significant. Abbreviations SiO2 = silica dust; BALF = bronchoalveolar lavage fluid; AMs = alveolar macrophages; TEM = transmission electron microscope; NTA = nanoparticle tracking analysis
Fig. 2
Fig. 2
The secretion of exosomes by macrophages is increased by silica exposure. (A-B). The morphology of exosomes derived from the supernatant of RAW264.7 macrophages and THP-1 macrophages treated with silica dust was observed by TEM. The yellow arrowheads indicate exosomes. The scale bar represents 100 nm. (C). Representative western blot image showing the expression of HSP70, TSG101 and CD63 in exosomes derived from RAW264.7 macrophages and THP-1 macrophages with or without SiO2 exposure; equal volumes of exosomes (in a total volume of 30 µl) were subjected to SDS–PAGE. (D). NTA showing the size distribution of exosomes derived from RAW264.7 macrophages and THP-1 macrophages treated with SiO2. (E). Micro-BCA assay analysis of the total protein content of exosomes derived from RAW264.7 macrophages and THP-1 macrophages treated with or without SiO2 for 36 h. n = 3 per group. The data are representative of three individual experiments and were analysed by two-way ANOVA. *P < 0.05, **P < 0.01. Abbreviations SiO2 = silica dust; NC-Exo = exosomes derived from cells without SiO2 exposure; SiO2-Exo = exosomes derived from SiO2-exposed macrophages; TEM = transmission electron microscopy; NTA = nanoparticle tracking analysis; BCA = bicinchoninic acid
Fig. 3
Fig. 3
Exosomes derived from SiO2-exposed macrophages promote inflammatory activation in monocytes/macrophages (A) The purified exosomes were labelled with PKH26 dye and then added to RAW264.7 macrophages and THP-1 macrophages. The uptake of PKH26-labelled exosomes was observed by fluorescence microscopy. The scale bar represents 20 μm. (B) Representative image of the morphological changes in RAW264.7 macrophages and THP-1 monocytes treated with PBS, NC-Exo, SiO2-Exo or SiO2 + GW4869-Exo. The scale bar represents 50 μm. (C-D). RT–PCR analysis of the expression of IL-1β, IL-6, TNF-α and IL-10 in RAW264.7 macrophages and THP-1 monocytes treated with PBS, NC-Exo, SiO2-Exo or SiO2 + GW4869-Exo. (E). ELISA analysis of the levels of proinflammatory factors in the supernatant of RAW264.7 macrophages treated with PBS, SiO2-Exo or SiO2 + GW4869-Exo. n = 3 each group. (F-G). Flow cytometric analysis of the proportions of iNOS+ cells among RAW264.7 macrophages and THP-1 monocytes after PBS, NC-Exo, SiO2-Exo or SiO2 + GW4869-Exo treatment. (H-I). Immunofluorescence analysis of iNOS expression in RAW264.7 macrophages (H) and THP-1 monocytes (I) after PBS, NC-Exo, SiO2-Exo or SiO2 + GW4869-Exo treatment. The scale bar represents 50 μm. The data are representative of three individual experiments and expressed as the mean ± SEM. The data were analysed by two-way ANOVA. *P < 0.05, **P < 0.01, ***P < 0.001, ****P < 0.0001, ns = not significant. Abbreviations SiO2 = silica dust; NC-Exo = exosomes derived from cells without SiO2 exposure; SiO2-Exo = exosomes derived from SiO2-exposed macrophages; SiO2 + GW4869-Exo = exosomes derived from SiO2-exposed macrophages treated with GW4869 (10 µM)
Fig. 4
Fig. 4
Exosomes derived from SiO2-exposed macrophages promote monocyte/macrophage migration through CCR2. (A). Transwell assay of the migration of RAW264.7 macrophages or THP-1 monocytes treated with PBS, NC-Exo, SiO2-Exo or SiO2 + GW4869-Exo. The scale bar represents 50 μm. (B-E). The expression of CCR2 in RAW264.7 macrophages or THP-1 monocytes treated with PBS, NC-Exo, SiO2-Exo or SiO2 + GW4869-Exo was analysed by RT–PCR (B-C) and western blotting (D-E). (F-G). Transwell assay of the migration of RAW264.7 macrophages or THP-1 monocytes treated with SiO2-Exo in the presence of a CCR2 antagonist (10 nM, 20 nM, 40 nM, or 100 nM). The scale bar represents 50 μm. The data are representative of three individual experiments and expressed as the mean ± SEM. The data were analysed by Student’s t test or two-way ANOVA. *P < 0.05, **P < 0.01, ***P < 0.001, ****P < 0.0001. Abbreviations SiO2 = silica dust; NC-Exo = exosomes derived from cells without SiO2 exposure; SiO2-Exo = exosomes derived from SiO2-exposed macrophages; SiO2 + GW4869-Exo = exosomes derived from SiO2-exposed macrophages treated with GW4869 (10 µM); antago = antagonist
Fig. 5
Fig. 5
SiO2-Exo promotes the inflammatory response by regulating the activation of the STAT3/MAPK (ERK1/2 and p38)/NF-κB signalling pathways. (A) Western blot analysis of the expression of pro-IL-1β and the phosphorylation of p65 (NF-κB), STAT1/3, AKT, ERK1/2 and p38 in RAW264.7 macrophages treated with PBS, NC-Exo or SiO2-Exo. # indicates that the data were compared between the NC-Exo group and the SiO2-Exo group. (B) Western blot analysis of the expression of pro-IL-1β and the phosphorylation levels of p65 (NF-κB), STAT1/3, AKT, ERK1/2 and p38 in RAW264.7 macrophages treated with SiO2-Exo or SiO2 + GW4869-Exo. (C) Western blot analysis of the expression of pro-IL-1β and the phosphorylation of STAT3 and AKT in SiO2-Exo-induced RAW264.7 macrophages treated with Stattic (5 µM) or MK2206 (10 nM). (D) ELISA analysis of the release of IL-1β, IL-6 and TNF-α in the SN of SiO2-Exo-induced RAW264.7 macrophages treated with Stattic (5 µM) or MK2206 (10 nM). n = 3 each group. The data are representative of three individual experiments and expressed as the mean ± SEM. The data were analysed by Student’s t test or two-way ANOVA. *P < 0.05, **P < 0.01, ***P < 0.001, ****P < 0.0001, ns = not significant. Abbreviations SiO2 = silica dust; SN = cell culture supernatant; NC-Exo = exosomes derived from cells without SiO2 exposure; SiO2-Exo = exosomes derived from SiO2-exposed macrophages; SiO2 + GW4869-Exo = exosomes derived from SiO2-exposed macrophages treated with GW4869 (10 µM)
Fig. 6
Fig. 6
HMGB3 protein expression is increased in SiO2-Exo and SiO2-exposed macrophages. (A-B). Western blot analysis of the expression of HMGB3, HSP70, TSG101 and β-actin in exosomes derived from RAW264.7 macrophages or THP-1 macrophages with or without SiO2 exposure. (C-F). Western blot analysis of HMGB3 expression in RAW264.7 macrophages or THP-1 macrophages exposed to SiO2 for different times. (G-H). Western blot analysis of HMGB3 protein expression in the cytoplasm and nucleus of RAW264.7 macrophages or THP-1 macrophages exposed to SiO2. (I). Western blot analysis of the expression of collagen type I and HMGB3 in the lung tissue of normal mice and mice with silicosis. n = 3 mice in the normal group (saline) and n = 5 mice in the silicosis group (SiO2). (J). Representative image showing immunohistochemical staining of HMGB3 (red arrowheads) in the lung tissue of normal mice and mice with silicosis. The scale bar represents 20 μm. (K). Representative image showing immunohistochemical staining of CD68 (a macrophage-related marker, yellow arrowheads) and HMGB3 (red arrowheads) in the lung tissue of mice with silicosis. The scale bar represents 20 μm. (L). Representative image showing immunohistochemical staining of α-SMA (a myofibroblast-related marker, green arrowheads) and HMGB3 (red arrowheads) in the lung tissue of mice with silicosis. The scale bar represents 20 μm. (M). Representative western blot showing HMGB3 expression in the alveolar macrophages (AMs) of normal mice and mice with silicosis. n = 15 mice per group. The data are representative of three individual experiments and expressed as the mean ± SEM. The data were analysed by Student’s t test. *P < 0.05, **P < 0.01, ***P < 0.001, ****P < 0.0001, ns = not significant. Abbreviations SiO2 = silica dust; AMs = alveolar macrophages; NC-Exo = exosomes derived from cells without SiO2 exposure; SiO2-Exo = exosomes derived from SiO2-exposed macrophages
Fig. 7
Fig. 7
Knocking down HMGB3 attenuates the inflammatory activation and migration induced by SiO2-Exo in macrophages. (A-B). RT–PCR and western blot analysis of HMGB3-silenced RAW264.7 macrophages. (C). Western blot analysis of HMGB3 expression in exosomes derived from macrophages transfected with siNC or siHMGB3. (D). ELISA analysis of the expression of IL-1β, IL-6 and TNF-α in the SN of RAW264.7 macrophages treated with PBS, SiO2 + siNC-Exo, or SiO2 + siHMGB3-Exo. n = 3 each group. (E). Transwell assay of the migration of RAW264.7 macrophages treated with PBS, SiO2 + siNC-Exo, or SiO2 + siHMGB3-Exo. The scale bar represents 50 μm. (F). Western blot analysis of the expression of p-p65, p-STAT3, p-ERK1/2, p-p38, CCR2 and pro-IL-1β in RAW264.7 macrophages treated with PBS, SiO2 + siNC-Exo, or SiO2 + siHMGB3-Exo. (G). Flow chart showing the process of exosome administration in mice. (H). The distribution of PKH26-labelled exosomes in mice was observed by an in vivo Xtreme II system, and PKH26-labelled exosomes in peripheral blood were observed by fluorescence microscopy. The scale bar represents 20 μm. (I). HE staining of lung tissue from mice treated with PBS, SiO2 + siNC-Exo, or SiO2 + siHMGB3-Exo. n = 5 mice per group. (J). Flow cytometry gating strategy for CD11b+/F4/80+ subsets. Flow cytometric analysis of the proportions of iNOS+ or CD206+ macrophages in the lung tissue of mice treated with PBS, SiO2 + siNC-Exo, or SiO2 + siHMGB3-Exo. n = 5 mice per group. The data are representative of three individual experiments and expressed as the mean ± SEM. The data were analysed by Student’s t test or two-way ANOVA. *P < 0.05, **P < 0.01, ***P < 0.001, ****P < 0.0001. Abbreviations SiO2 = silica dust; SN = cell culture supernatant; SiO2 + siNC-Exo = exosomes derived from SiO2-exposed macrophages transfected with siNC; SiO2 + siHMGB3-Exo = exosomes derived from SiO2-exposed macrophages transfected with siHMGB3
Fig. 8
Fig. 8
Overexpression of exosomal HMGB3 enhances the release of proinflammatory cytokines and the migration of macrophages. (A-B). RT–PCR and western blot analysis of the transfection efficiency of the pcDNA3.1-HMGB3 plasmid in RAW264.7 cells. (C). Western blot analysis of HMGB3 expression in exosomes derived from macrophages transfected with pcDNA3.1-vector or pcDNA3.1-HMGB3. (D). ELISA analysis of the levels of IL-1β, IL-6 and TNF-α in the SN of RAW264.7 macrophages treated with PBS, Vector-Exo, or HMGB3-Exo. n = 3 each group. (E-F). Transwell assay of the migration of RAW264.7 macrophages treated with PBS, Vector-Exo, or HMGB3-Exo. The scale bar represents 50 μm. (G-H). Western blot analysis of the expression of p-p65, p-STAT3, p-ERK1/2, p-p38, CCR2 and pro IL-1β in RAW264.7 macrophages treated with PBS, Vector-Exo, or HMGB3-Exo. # indicates that the data were compared between the Vector-Exo group and the HMGB3-Exo group. The data are representative of three individual experiments and expressed as the mean ± SEM. The data were analysed by Student’s t test. *P < 0.05, **P < 0.01, ***P < 0.001, ****P < 0.0001, ns = not significant. Abbreviations SN = cell culture supernatant; Vector-Exo = exosomes derived from macrophages transfected with the vector plasmid; HMGB3-Exo = exosomes derived from macrophages transfected with the HMGB3 plasmid

Similar articles

Cited by

References

    1. Krefft S, Wolff J, Rose C, Silicosis An update and guide for clinicians. Clin Chest Med. 2020;41(4):709–22. doi: 10.1016/j.ccm.2020.08.012. - DOI - PubMed
    1. China NHCotPsRo. The Statistical Bulletin of China’s Health Service Development in 2021 2022 [Available from: http://www.gov.cn/xinwen/2022-07/12/content_5700670.htm.
    1. Li T, Yang X, Xu H, Liu H. Early identification, Accurate diagnosis, and treatment of silicosis. Can Respir J. 2022;2022:3769134. - PMC - PubMed
    1. Steven Hildemann lCH. and Fritz Krombach’. Heterogeneity of Alveolar Macrophages in Experimental Silicosis. Environmental Health Perspectives; 1992. - PMC - PubMed
    1. Xiang GA, Zhang YD, Su CC, Ma YQ, Li YM, Zhou X, et al. Dynamic changes of mononuclear phagocytes in circulating, pulmonary alveolar and interstitial compartments in a mouse model of experimental silicosis. Inhal Toxicol. 2016;28(9):393–402. doi: 10.1080/08958378.2016.1188186. - DOI - PubMed

Publication types