. 2024 Mar 7;21(1):25.
doi: 10.1186/s12987-024-00520-0.

Validating the accuracy of real-time phase-contrast MRI and quantifying the effects of free breathing on cerebrospinal fluid dynamics

Affiliations

Validating the accuracy of real-time phase-contrast MRI and quantifying the effects of free breathing on cerebrospinal fluid dynamics

Pan Liu et al. Fluids Barriers CNS. .

Abstract

Background: Understanding of the cerebrospinal fluid (CSF) circulation is essential for physiological studies and clinical diagnosis. Real-time phase contrast sequences (RT-PC) can quantify beat-to-beat CSF flow signals. However, the detailed effects of free-breathing on CSF parameters are not fully understood. This study aims to validate RT-PC's accuracy by comparing it with the conventional phase-contrast sequence (CINE-PC) and quantify the effect of free-breathing on CSF parameters at the intracranial and extracranial levels using a time-domain multiparametric analysis method.

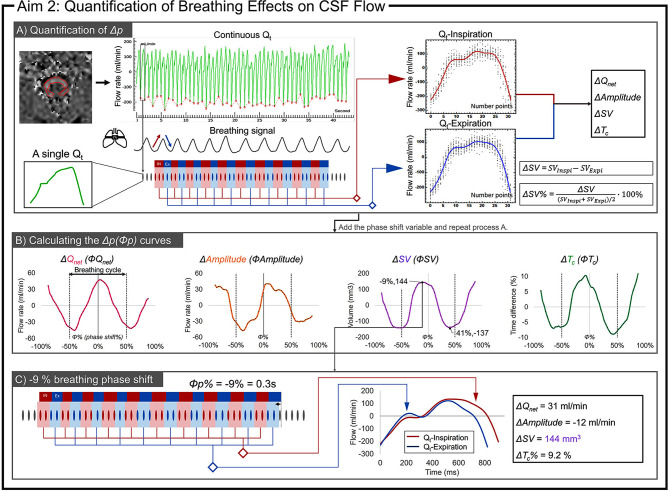
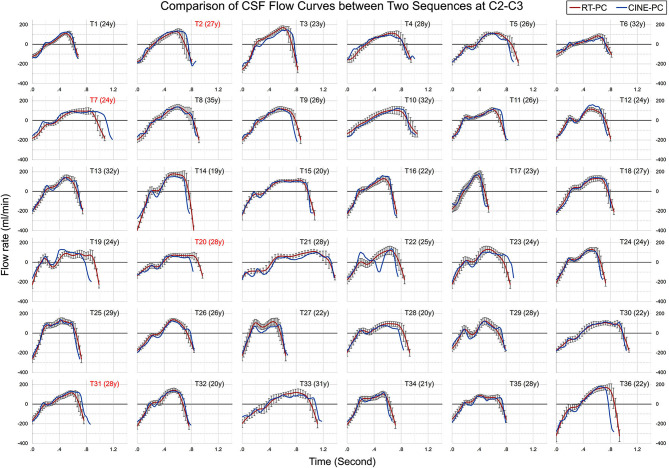
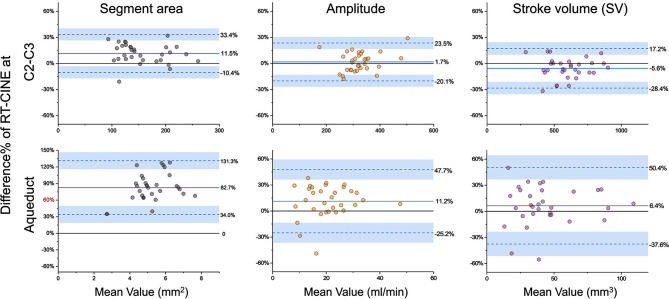
Methods: Thirty-six healthy participants underwent MRI in a 3T scanner for CSF oscillations quantification at the cervical spine (C2-C3) and Sylvian aqueduct, using CINE-PC and RT-PC. CINE-PC uses 32 velocity maps to represent dynamic CSF flow over an average cardiac cycle, while RT-PC continuously quantifies CSF flow over 45-seconds. Free-breathing signals were recorded from 25 participants. RT-PC signal was segmented into independent cardiac cycle flow curves (Qt) and reconstructed into an averaged Qt. To assess RT-PC's accuracy, parameters such as segmented area, flow amplitude, and stroke volume (SV) of the reconstructed Qt from RT-PC were compared with those derived from the averaged Qt generated by CINE-PC. The breathing signal was used to categorize the Qt into expiratory or inspiratory phases, enabling the reconstruction of two Qt for inspiration and expiration. The breathing effects on various CSF parameters can be quantified by comparing these two reconstructed Qt.

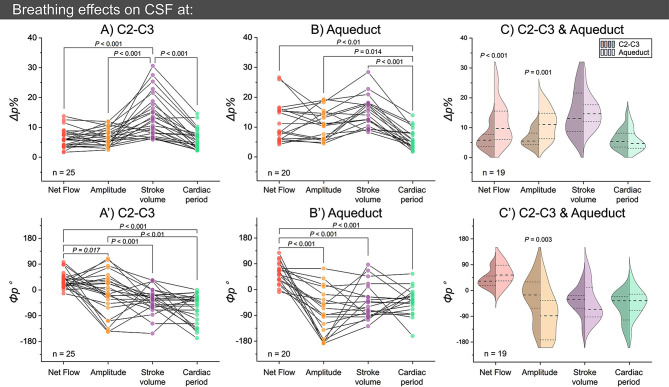
Results: RT-PC overestimated CSF area (82.7% at aqueduct, 11.5% at C2-C3) compared to CINE-PC. Stroke volumes for CINE-PC were 615 mm³ (aqueduct) and 43 mm³ (spinal), and 581 mm³ (aqueduct) and 46 mm³ (spinal) for RT-PC. During thoracic pressure increase, spinal CSF net flow, flow amplitude, SV, and cardiac period increased by 6.3%, 6.8%, 14%, and 6%, respectively. Breathing effects on net flow showed a significant phase difference compared to the other parameters. Aqueduct-CSF flows were more affected by breathing than spinal-CSF.

Conclusions: RT-PC accurately quantifies CSF oscillations in real-time and eliminates the need for cardiac synchronization, enabling the quantification of the cardiac and breathing components of CSF flow. This study quantifies the impact of free-breathing on CSF parameters, offering valuable physiological references for understanding the effects of breathing on CSF dynamics.

Keywords: Breathing effect; Cerebral circulation; Cerebrospinal fluid; Phase contrast MRI; Real-time phase contrast MRI.


Conflict of interest statement

The authors declare no competing interests.

Figures

Fig. 1
Fig. 1
Image acquisition (A) and image processing (B) for CINE-PC and RT-PC. (A) At the intracranial plane, CSF at the aqueduct is measured, while CSF at C2-C3 is measured at the extracranial plane. Amplitude images and phase-contrast images for both CINE-PC (left) and RT-PC (right) are presented. The FOV of RT-PC images was aligned with that of CINE-PC images for ease of comparison. (B) CSF post-processing and the first aim procedure at C2-C3 as an example. After the post-processing procedure (B1), flow rate signals (Qt) were obtained from CINE-PC and RT-PC (B2 and B3). The minimum values in each cardiac cycle (red points in B3) were used to segment the continuous Qt into multiple Qt. Then, all Qt were used to obtain the reconstructed Qt (B4). Finally, the differences in each parameter between the averaged Qt of CINE-PC and the reconstructed Qt of RT-PC were compared (B5). SV denotes average stroke volume
Fig. 2
Fig. 2
Flow chart for quantifying the breathing effects (Δp and Φp) on CSF. Definition of the inspiratory phase (IN, red) and the expiratory phase (EX, blue), using the breathing signal. (A) Reconstruction of Qt-Inspiration (red curve) and QtExpiration (blue curve) from the respective inspiratory Qt (red) and expiratory Qt (blue) points extracted from the continuous Qt. Then, Δp is calculated for each evaluated parameter with Φp = 0. (B) The breathing window is shifted from − 3s to + 3s in steps of 0.1 s. The previous steps are repeated to obtain the Δp(Φp) curves. (C) Represents the Δp values for four parameters at Φp = -9% (0.3 s). At this point, the ΔSV reaches the maximum value
Fig. 3
Fig. 3
CSF average cardiac cycle flow curves (averaged Qt) of CINE-PC (in blue) and reconstructed Qt of RT-PC (in red) at C2-C3 for 36 participants. Each plot is labelled with the participant’s serial number and age. Red-labeled plots indicate a cardiac period difference of more than 10% between the two sequences. For comparison, all plots have consistent axis ranges: y from − 400 to 250 ml/min and x from 0 to 1.4 s
Fig. 4
Fig. 4
CSF average cardiac cycle flow curves (averaged Qt) of CINE-PC (in blue) and reconstructed Qt of RT-PC (in red) at the aqueduct for 36 participants. Each plot is labeled with the participant’s serial number and age. Red-labeled plots indicate a cardiac period difference of more than 10% between the two sequences. For comparison, all plots have consistent axis ranges: y from − 30 to 33 ml/min and x from 0 to 1.4 s
Fig. 5
Fig. 5
Bland-Altman plots illustrating the percentage differences between RT-PC and CINE-PC measurements for three CSF parameters (Segment area, Amplitude and stroke volume) at C2-C3 (top) and the aqueduct (bottom). The solid line represents the mean percentage difference, while the dashed lines indicate the limits of agreement (Mean ± 1.96 standard deviations)
Fig. 6
Fig. 6
The intensity (Δp%, top) and corresponding phase shift (Φp°, bottom) of breathing effects on CSF parameters at C2-C3 (A and A’) and the aqueduct (B and B’). Paired t-tests or paired Wilcoxon tests were used to assess the significant differences between parameters (A, A’, B and B’) and levels (C and C’)
Fig. 7
Fig. 7
The curves of the CSF parameters under the influence of breathing are simulated by referring to the values of the breathing effects in Table 2. The inspiratory interval (0°–180°) is shown in red on the X-axis, indicating the process of increasing chest strap pressure, while the expiratory interval (180°–360°) is shown in blue. The middle line on the Y-axis represents the mean value of each parameter, taking into account that the mean of the net flow is 0 ml/min. The dashed interval represents the positive part of the net flow (Qnet), indicating that the CSF is flowing towards the cranium. 33° in A) represents the ΦQnet°

Similar articles

Cited by

References

    1. Wen Q, Tong Y, Zhou X, Dzemidzic M, Ho CY, Wu Y-C. Assessing pulsatile waveforms of paravascular cerebrospinal fluid dynamics within the glymphatic pathways using dynamic diffusion-weighted imaging (dDWI) NeuroImage. 2022;260:119464. doi: 10.1016/j.neuroimage.2022.119464. - DOI - PMC - PubMed
    1. Iliff JJ, Wang M, Liao Y, Plogg BA, Peng W, Gundersen GA, et al. A paravascular pathway facilitates CSF Flow through the Brain Parenchyma and the Clearance of Interstitial Solutes, including amyloid β. Sci Transl Med. 2012;4:147ra111–1. doi: 10.1126/scitranslmed.3003748. - DOI - PMC - PubMed
    1. Spector R, Robert Snodgrass S, Johanson CE. A balanced view of the cerebrospinal fluid composition and functions: focus on adult humans. Exp Neurol. 2015;273:57–68. doi: 10.1016/j.expneurol.2015.07.027. - DOI - PubMed
    1. Ringstad G, Eide PK. Cerebrospinal fluid tracer efflux to parasagittal dura in humans. Nat Commun. 2020;11:354. doi: 10.1038/s41467-019-14195-x. - DOI - PMC - PubMed
    1. Zhou L, Butler TA, Wang XH, Xi K, Tanzi EB, Glodzik L et al. Multimodal assessment of brain fluid clearance is associated with amyloid-beta deposition in humans. J Neuroradiol. 2023. - PMC - PubMed