

Midlife cumulative deficit frailty predicts Alzheimer's disease-related plasma biomarkers in older adults
- PMID: 38454901
- PMCID: PMC10921085
- DOI: 10.1093/ageing/afae028
Midlife cumulative deficit frailty predicts Alzheimer's disease-related plasma biomarkers in older adults
Abstract
Background: The study explores whether frailty at midlife predicts mortality and levels of biomarkers associated with Alzheimer's disease and related dementias (ADRD) and neurodegeneration by early old age. We also examine the heritability of frailty across this age period.
Methods: Participants were 1,286 community-dwelling men from the Vietnam Era Twin Study of Aging at average ages 56, 62 and 68, all without ADRD at baseline. The cumulative deficit frailty index (FI) comprised 37 items assessing multiple physiological systems. Plasma biomarkers at age 68 included beta-amyloid (Aβ40, Aβ42), total tau (t-tau) and neurofilament light chain (NfL).
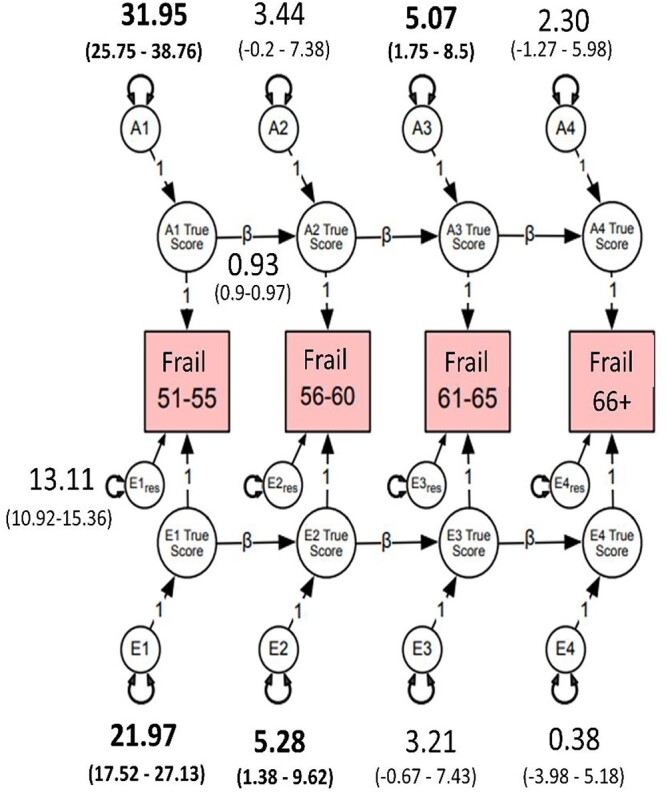
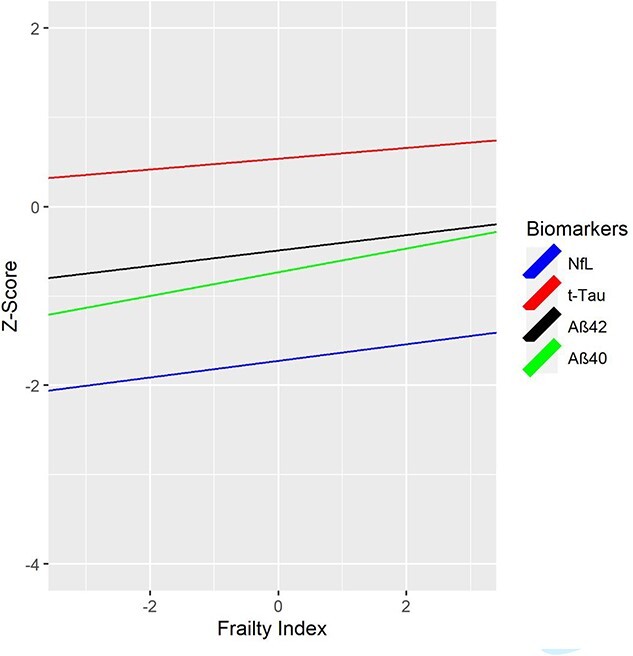
Results: Being frail doubled the risk of all-cause mortality by age 68 (OR = 2.44). Age 56 FI significantly predicted age 68 NfL (P = 0.014), Aβ40 (P = 0.001) and Aβ42 (P = 0.023), but not t-tau. Age 62 FI predicted all biomarkers at age 68: NfL (P = 0.023), Aβ40 (P = 0.002), Aβ42 (P = 0.001) and t-tau (P = 0.001). Age 68 FI scores were associated with age 68 levels of NfL (P = 0.027), Aβ40 (P < 0.001), Aβ42 (P = 0.001) and t-tau (P = 0.003). Genetic influences accounted for 45-48% of the variance in frailty and significantly contributed to its stability across 11 years.
Conclusions: Frailty during one's 50s doubled the risk of mortality by age 68. A mechanism linking frailty and ADRD may be through its associations with biomarkers related to neurodegeneration. Cumulative deficit frailty increases with age but remains moderately heritable across the age range studied. With environmental factors accounting for about half of its variance, early interventions aimed at reducing frailty may help to reduce risk for ADRD.
Keywords: cumulative deficit frailty; neurofilament light chain; older people; plasma beta amyloid; plasma biomarkers; plasma t-tau.
© The Author(s) 2024. Published by Oxford University Press on behalf of the British Geriatrics Society. All rights reserved. For permissions, please email: journals.permissions@oup.com.
Conflict of interest statement
None.
Figures
Similar articles
-
The heritability of blood-based biomarkers related to risk of Alzheimer's disease in a population-based sample of early old-age men.Alzheimers Dement. 2024 Jan;20(1):356-365. doi: 10.1002/alz.13407. Epub 2023 Aug 25. Alzheimers Dement. 2024. PMID: 37622539 Free PMC article.
-
Plasma tau, neurofilament light chain and amyloid-β levels and risk of dementia; a population-based cohort study.Brain. 2020 Apr 1;143(4):1220-1232. doi: 10.1093/brain/awaa054. Brain. 2020. PMID: 32206776 Free PMC article.
-
Astrocyte reactivity is associated with tau tangle load and cortical thinning in Alzheimer's disease.Mol Neurodegener. 2024 Jul 30;19(1):58. doi: 10.1186/s13024-024-00750-8. Mol Neurodegener. 2024. PMID: 39080744 Free PMC article.
-
Novel Biomarkers for Alzheimer's Disease: Plasma Neurofilament Light and Cerebrospinal Fluid.Int J Alzheimers Dis. 2024 May 15;2024:6668159. doi: 10.1155/2024/6668159. eCollection 2024. Int J Alzheimers Dis. 2024. PMID: 38779175 Free PMC article. Review.
-
Current advances in plasma and cerebrospinal fluid biomarkers in Alzheimer's disease.Curr Opin Neurol. 2021 Apr 1;34(2):266-274. doi: 10.1097/WCO.0000000000000904. Curr Opin Neurol. 2021. PMID: 33470669 Review.
Cited by
-
Physical and biopsychosocial frailty, cognitive phenotypes, and plasma biomarkers for Alzheimer's disease in Chinese older adults: A population-based study.Alzheimers Dement. 2025 May;21(5):e70303. doi: 10.1002/alz.70303. Alzheimers Dement. 2025. PMID: 40399764 Free PMC article.
References
-
- Allison R 2nd, Assadzandi S, Adelman M. Frailty: evaluation and management. Am Fam Physician 2021; 103: 219–26. - PubMed
-
- Hoogendijk EO, Afilalo J, Ensrud KE, Kowal P, onder G, Fried LP. Frailty: implications for clinical practice and public health. Lancet 2019; 394: 1365–75. - PubMed
-
- Fried LP, Tangen CM, Walston Jet al. . Frailty in older adults: evidence for a phenotype. J Gerontol A Biol Sci Med Sci 2001; 56: M146–57. - PubMed
-
- Kojima G. Frailty as a predictor of disabilities among community-dwelling older people: a systematic review and meta-analysis. Disabil Rehabil 2017; 39: 1897–908. - PubMed
-
- Kojima G, Liljas A, Iliffe S, Walters K. Prevalence of frailty in mild to moderate Alzheimer's disease: a systematic review and meta-analysis. Curr Alzheimer Res 2017; 14: 1256–63. - PubMed
