

Identification and validation of a gap junction protein related signature for predicting the prognosis of renal clear cell carcinoma
- PMID: 38454924
- PMCID: PMC10919056
- DOI: 10.3389/fonc.2024.1354049
Identification and validation of a gap junction protein related signature for predicting the prognosis of renal clear cell carcinoma
Abstract
Background: Gap junction proteins (GJPs) are a class of channel proteins that are closely related to cell communication and tumor development. The objective of this study was to screen out GJPs related prognostic signatures (GRPS) associated with clear cell renal cell carcinoma (ccRCC).
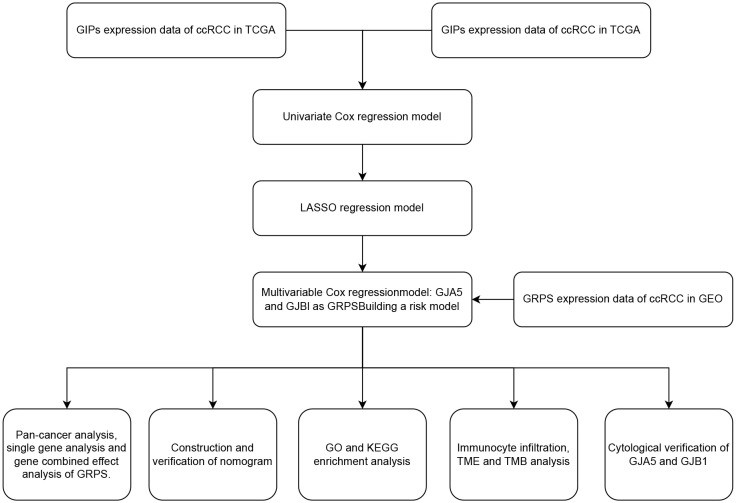
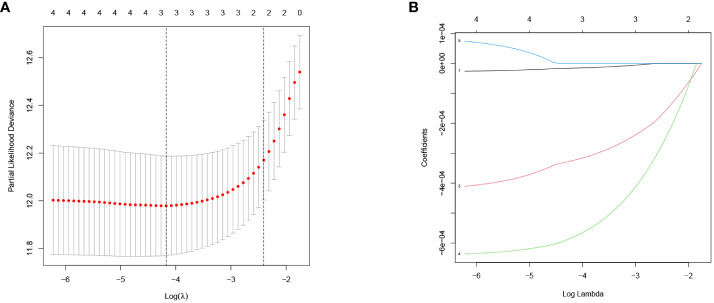
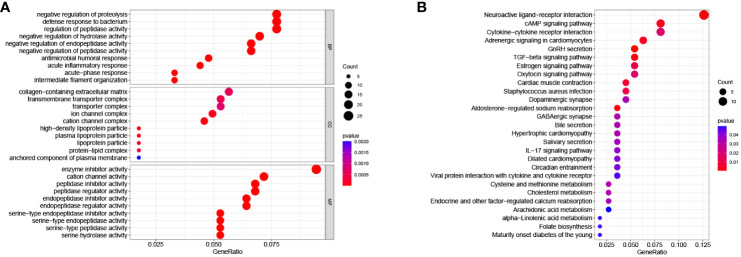
Materials and methods: GJPs microarray data for ccRCC patients were obtained from The Gene Expression Omnibus (GEO) database, along with RNA sequencing data for tumor and paired normal tissues from The Cancer Genome Atlas (TCGA) database. In the TCGA database, least absolute shrinkage and selection Operator (LASSO) and Cox regression models were used to identify GJPs with independent prognostic effects as GRPS in ccRCC patients. According to the GRPS expression and regression coefficient from the multivariate Cox regression model, the risk score (RS) of each ccRCC patient was calculated, to construct the RS prognostic model to predict survival. Overall survival (OS) and progression-free survival (PFS) analyses; gene pan-cancer analysis; single gene survival analysis; gene joint effect analysis; functional enrichment analysis; tumor microenvironment (TME) analysis; tumor mutational burden (TMB) analysis; and drug sensitivity analysis were used to explore the biological function, mechanism of action and clinical significance of GRPS in ccRCC. Further verification of the genetic signature was performed with data from the GEO database. Finally, the cytofunctional experiments were used to verify the biological significance of GRPS associated GJPs in ccRCC cell lines.
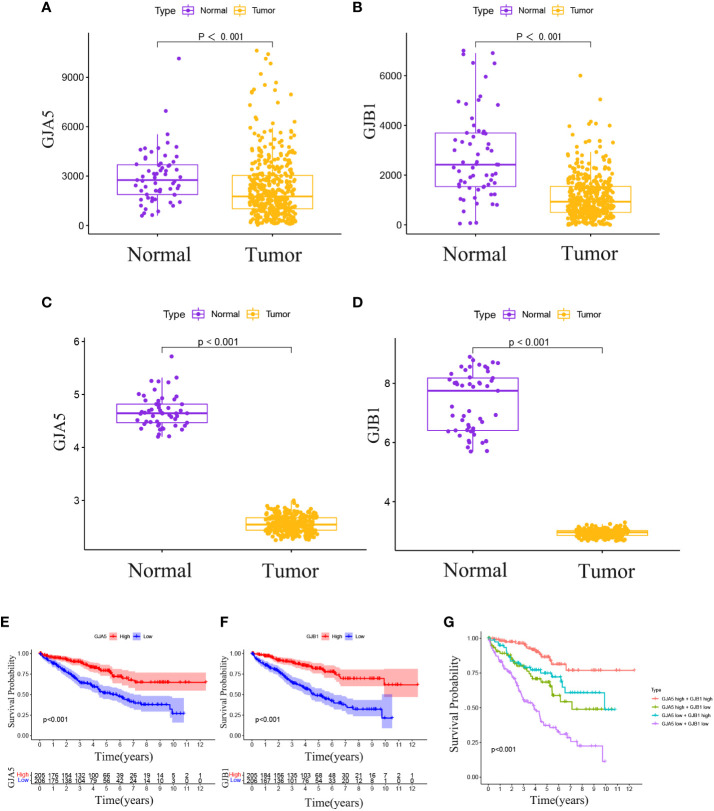
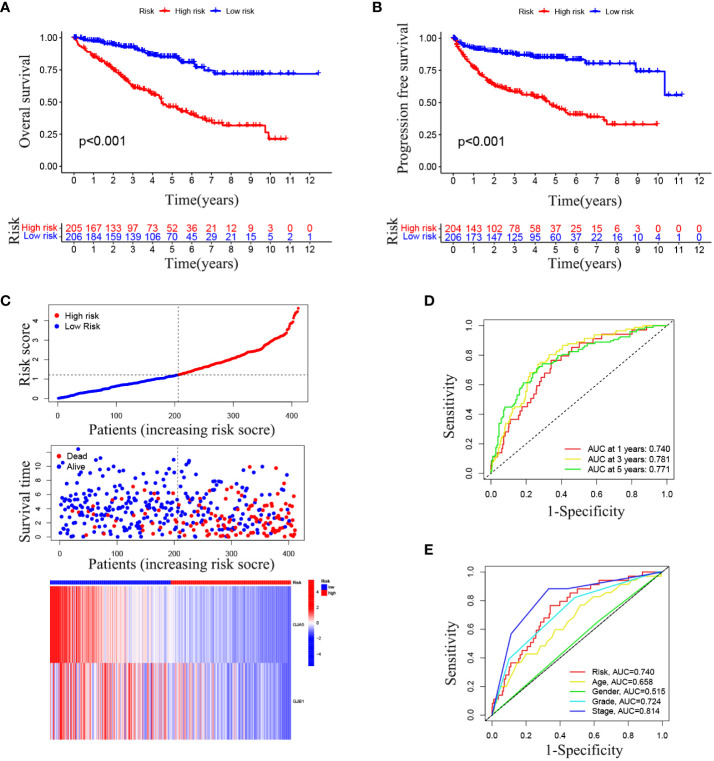
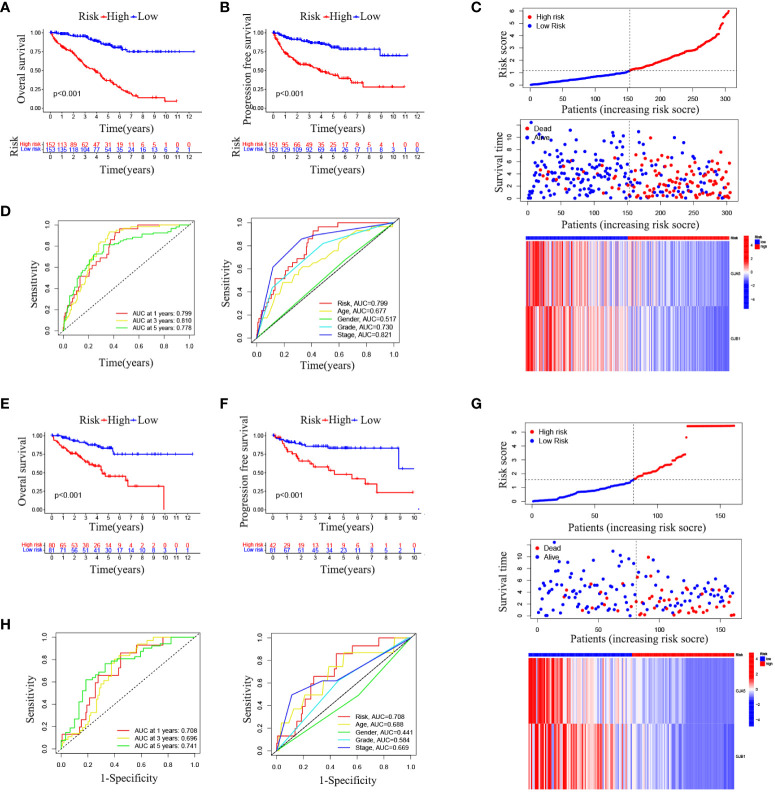
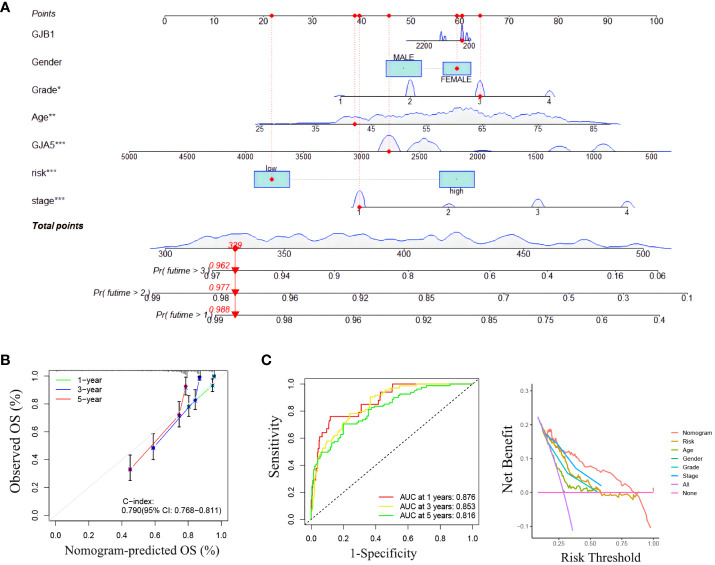
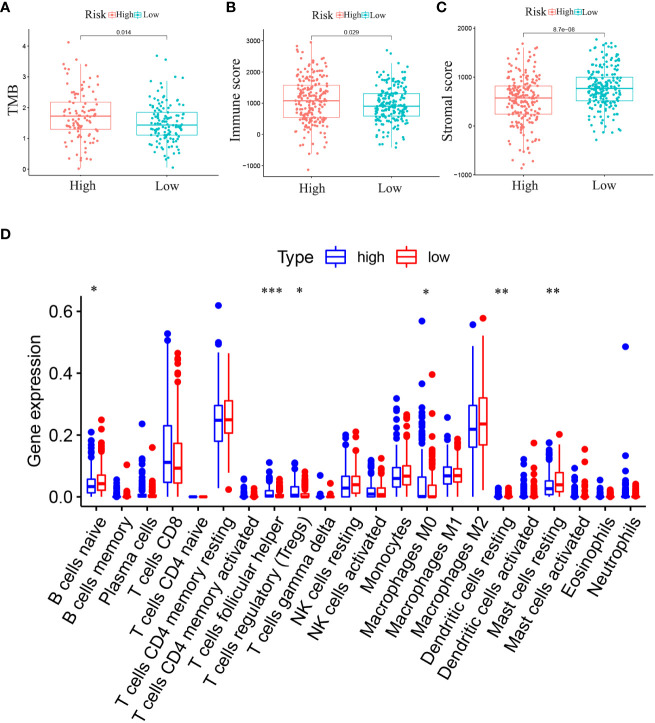
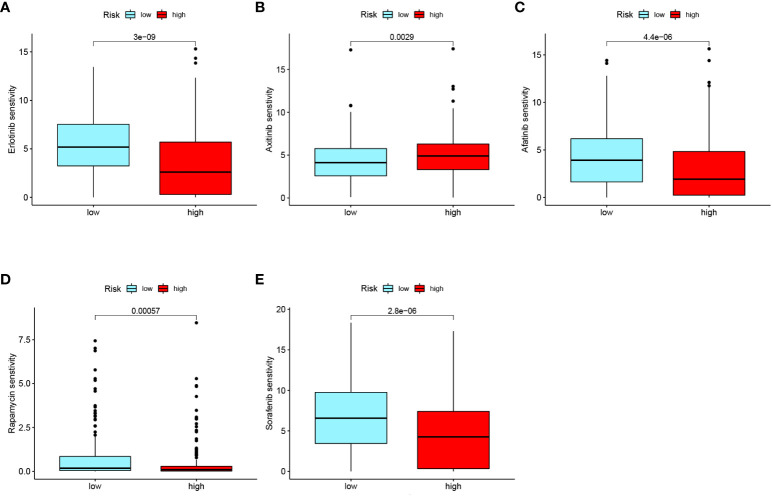
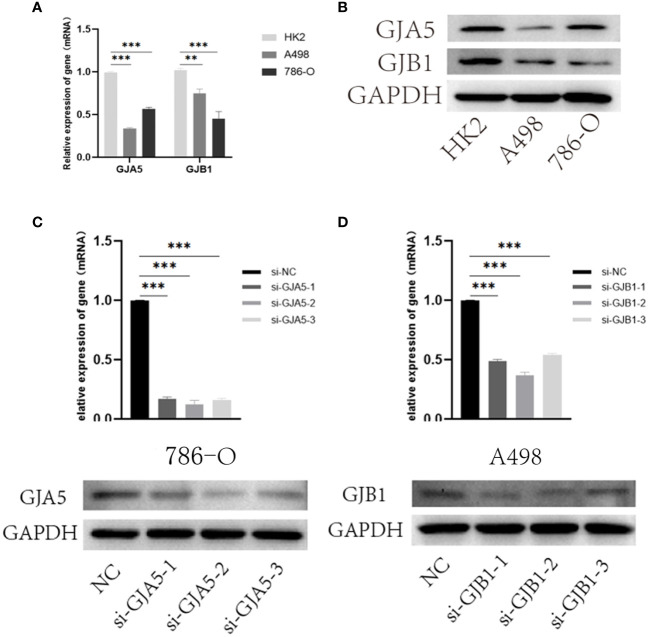
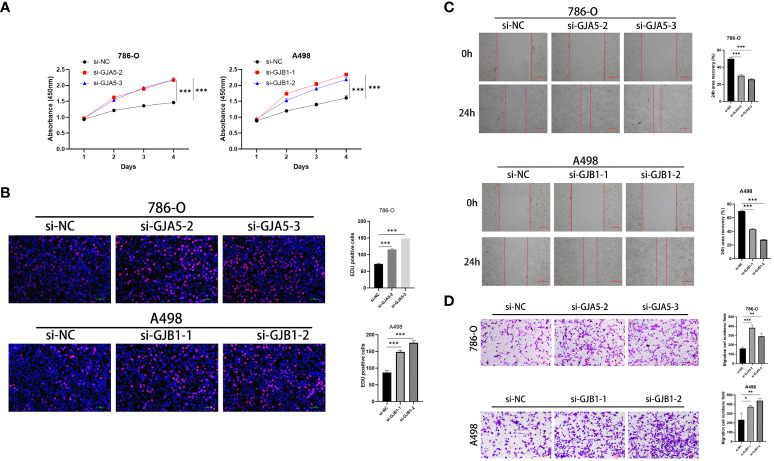
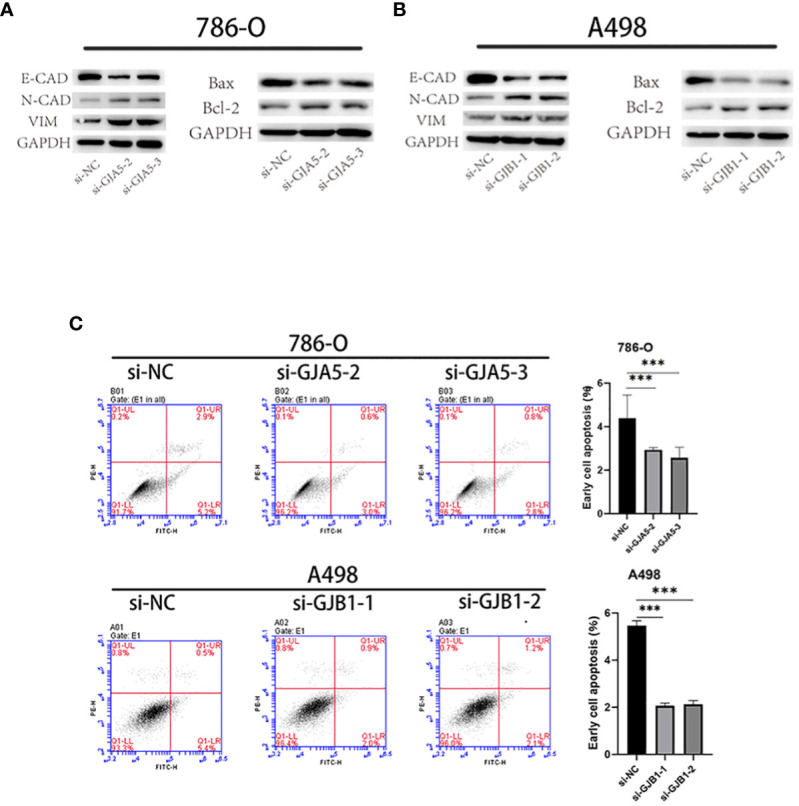
Results: GJA5 and GJB1, which are GRPS markers of ccRCC patients, were identified through LASSO and Cox regression models. Low expression of GJA5 and GJB1 is associated with poor patient prognosis. Patients with high-RS had significantly shorter OS and PFS than patients with low-RS (p< 0.001). The risk of death for individuals with high-RS was 1.695 times greater than that for those with low-RS (HR = 1.695, 95%CI= 1.439-1.996, p< 0.001). Receiver Operating Characteristic (ROC) curve showed the great predictive power of the RS prognostic model for the survival rate of patients. The area under curve (AUC) values for predicting 1-year, 3-year and 5-year survival rates were 0.740, 0.781 and 0.771, respectively. The clinical column chart was also reliable for predicting the survival rate of patients, with AUC values of 0.859, 0.846 and 0.796 for predicting 1-year, 3-year and 5-year survival, respectively. The GRPS was associated with immune cell infiltration, the TME, the TMB, and sensitivity to chemotherapy drugs. Further in vitro experiments showed that knockdown of GJA5 or GJB1 could promote the proliferation, migration and epithelial-mesenchymal transition (EMT) and inhibit apoptosis of ccRCC cells.
Conclusion: GJA5 and GJB1 could be potential biological markers for predicting survival in patients with ccRCC.
Keywords: biomarkers; cellular verification; clear cell renal cell carcinoma; gap junction protein; prognostic model.
Copyright © 2024 Huang, Guo, Zeng, Wang, Fan, Zhang, Yan, Gu and Liu.
Conflict of interest statement
The authors declare that the research was conducted in the absence of any commercial or financial relationships that could be construed as a potential conflict of interest.
Figures
Similar articles
-
Functional enrichment analysis of LYSET and identification of related hub gene signatures as novel biomarkers to predict prognosis and immune infiltration status of clear cell renal cell carcinoma.J Cancer Res Clin Oncol. 2023 Dec;149(18):16905-16929. doi: 10.1007/s00432-023-05280-2. Epub 2023 Sep 23. J Cancer Res Clin Oncol. 2023. PMID: 37740762 Free PMC article.
-
Identification of ferroptosis-related gene signatures as a novel prognostic model for clear cell renal cell carcinoma.Discov Oncol. 2025 Apr 3;16(1):456. doi: 10.1007/s12672-025-02202-1. Discov Oncol. 2025. PMID: 40178680 Free PMC article.
-
Expression of gasdermin D in clear cell renal cell carcinoma and its effect on its biological function.Front Oncol. 2023 Jul 6;13:1163714. doi: 10.3389/fonc.2023.1163714. eCollection 2023. Front Oncol. 2023. PMID: 37483501 Free PMC article.
-
A new CCCH-type zinc finger-related lncRNA signature predicts the prognosis of clear cell renal cell carcinoma patients.Front Genet. 2022 Sep 30;13:1034567. doi: 10.3389/fgene.2022.1034567. eCollection 2022. Front Genet. 2022. PMID: 36246657 Free PMC article.
-
Review of Prognostic Expression Markers for Clear Cell Renal Cell Carcinoma.Front Oncol. 2021 Apr 28;11:643065. doi: 10.3389/fonc.2021.643065. eCollection 2021. Front Oncol. 2021. PMID: 33996558 Free PMC article. Review.
References
LinkOut - more resources
Full Text Sources
Miscellaneous