

Identification of immune cell-related prognostic genes characterized by a distinct microenvironment in hepatocellular carcinoma
- PMID: 38455128
- PMCID: PMC10915937
- DOI: 10.5306/wjco.v15.i2.243
Identification of immune cell-related prognostic genes characterized by a distinct microenvironment in hepatocellular carcinoma
Abstract
Background: The development and progression of hepatocellular carcinoma (HCC) have been reported to be associated with immune-related genes and the tumor microenvironment. Nevertheless, there are not enough prognostic biomarkers and models available for clinical use. Based on seven prognostic genes, this study calculated overall survival in patients with HCC using a prognostic survival model and revealed the immune status of the tumor microenvironment (TME).
Aim: To develop a novel immune cell-related prognostic model of HCC and depict the basic profile of the immune response in HCC.
Methods: We obtained clinical information and gene expression data of HCC from The Cancer Genome Atlas (TCGA) and International Cancer Genome Consortium (ICGC) datasets. TCGA and ICGC datasets were used for screening prognostic genes along with developing and validating a seven-gene prognostic survival model by weighted gene coexpression network analysis and least absolute shrinkage and selection operator regression with Cox regression. The relative analysis of tumor mutation burden (TMB), TME cell infiltration, immune checkpoints, immune therapy, and functional pathways was also performed based on prognostic genes.
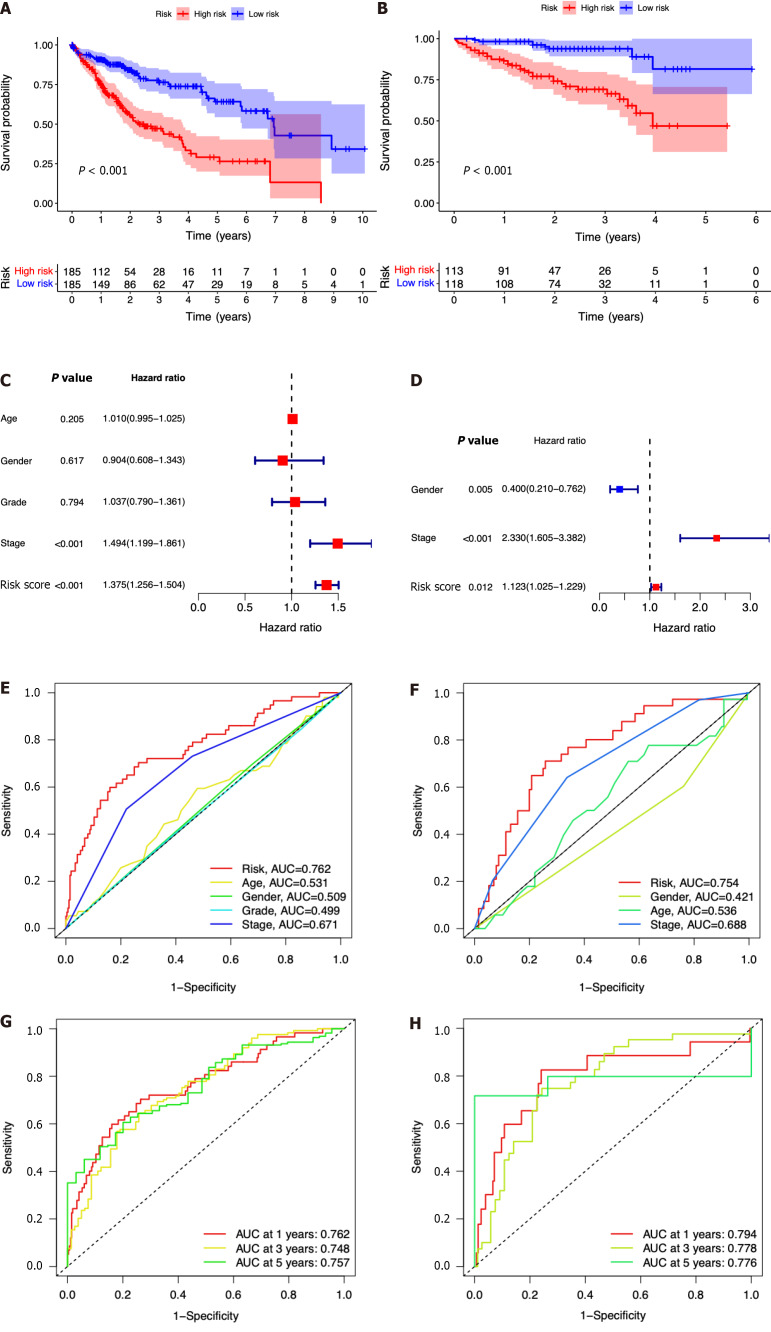
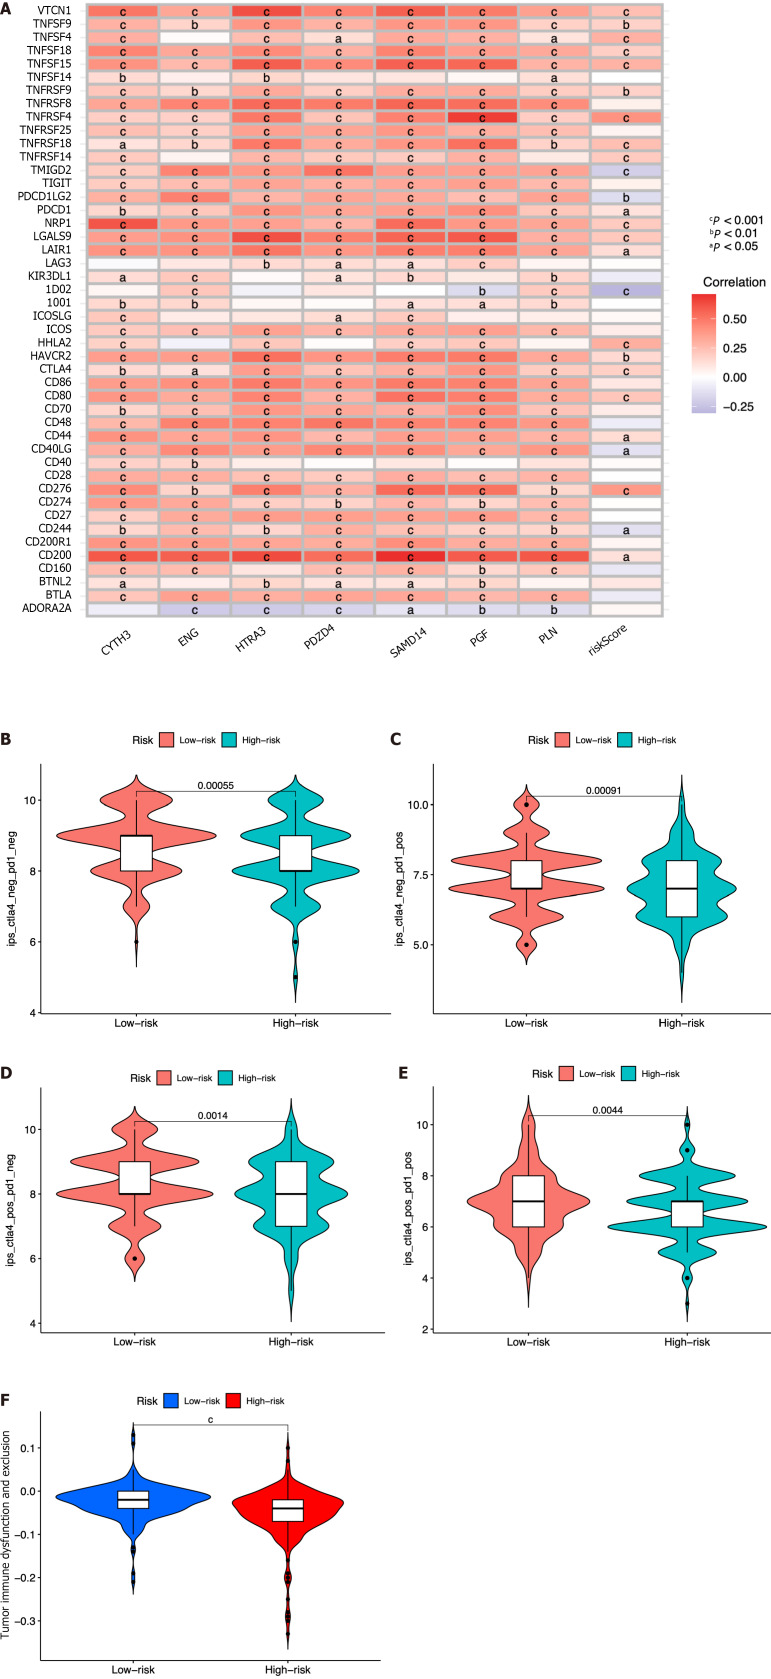
Results: Seven prognostic genes were identified for signature construction. Survival receiver operating characteristic curve analysis showed the good performance of survival prediction. TMB could be regarded as an independent factor in HCC survival prediction. There was a significant difference in stromal score, immune score, and estimate score between the high-risk and low-risk groups stratified based on the risk score derived from the seven-gene prognostic model. Several immune checkpoints, including VTCN1 and TNFSF9, were found to be associated with the seven prognostic genes and risk score. Different combinations of checkpoint blockade targeting inhibitory CTLA4 and PD1 receptors and potential chemotherapy drugs hold great promise for specific HCC therapies. Potential pathways, such as cell cycle regulation and metabolism of some amino acids, were also identified and analyzed.
Conclusion: The novel seven-gene (CYTH3, ENG, HTRA3, PDZD4, SAMD14, PGF, and PLN) prognostic model showed high predictive efficiency. The TMB analysis based on the seven genes could depict the basic profile of the immune response in HCC, which might be worthy of clinical application.
Keywords: Chemotherapy; Hepatocellular carcinoma; Microenvironment; Prognostic model; Weighted gene coexpression network analysis.
©The Author(s) 2024. Published by Baishideng Publishing Group Inc. All rights reserved.
Conflict of interest statement
Conflict-of-interest statement: All the authors declare that they have no known competing financial interests or personal relationships that could have appeared to influence the work reported in this paper.
Figures


Similar articles
-
Identification and Validation of a Novel Six-Gene Expression Signature for Predicting Hepatocellular Carcinoma Prognosis.Front Immunol. 2021 Dec 1;12:723271. doi: 10.3389/fimmu.2021.723271. eCollection 2021. Front Immunol. 2021. PMID: 34925311 Free PMC article.
-
Identification and Validation of a Novel Tumor Microenvironment-Related Prognostic Signature of Patients With Hepatocellular Carcinoma.Front Mol Biosci. 2022 Jun 30;9:917839. doi: 10.3389/fmolb.2022.917839. eCollection 2022. Front Mol Biosci. 2022. PMID: 35847972 Free PMC article.
-
Characterizing the key genes of COVID-19 that regulate tumor immune microenvironment and prognosis in hepatocellular carcinoma.Funct Integr Genomics. 2023 Aug 4;23(3):262. doi: 10.1007/s10142-023-01184-z. Funct Integr Genomics. 2023. PMID: 37540264
-
Cuproptosis-Related Signature Predicts the Prognosis, Tumor Microenvironment, and Drug Sensitivity of Hepatocellular Carcinoma.J Immunol Res. 2022 Nov 16;2022:3393027. doi: 10.1155/2022/3393027. eCollection 2022. J Immunol Res. 2022. PMID: 36438201 Free PMC article.
-
An Overview of the Genomic Characterization of Hepatocellular Carcinoma.J Hepatocell Carcinoma. 2021 Sep 7;8:1077-1088. doi: 10.2147/JHC.S270533. eCollection 2021. J Hepatocell Carcinoma. 2021. PMID: 34522690 Free PMC article. Review.
Cited by
-
Novel immune-related prognostic models for patients with hepatocellular carcinoma after curative resection.Hepatol Int. 2025 May 15. doi: 10.1007/s12072-025-10839-x. Online ahead of print. Hepatol Int. 2025. PMID: 40374839
References
-
- Bray F, Ferlay J, Soerjomataram I, Siegel RL, Torre LA, Jemal A. Global cancer statistics 2018: GLOBOCAN estimates of incidence and mortality worldwide for 36 cancers in 185 countries. CA Cancer J Clin. 2018;68:394–424. - PubMed
-
- Allemani C, Weir HK, Carreira H, Harewood R, Spika D, Wang XS, Bannon F, Ahn JV, Johnson CJ, Bonaventure A, Marcos-Gragera R, Stiller C, Azevedo e Silva G, Chen WQ, Ogunbiyi OJ, Rachet B, Soeberg MJ, You H, Matsuda T, Bielska-Lasota M, Storm H, Tucker TC, Coleman MP CONCORD Working Group. Global surveillance of cancer survival 1995-2009: analysis of individual data for 25,676,887 patients from 279 population-based registries in 67 countries (CONCORD-2) Lancet. 2015;385:977–1010. - PMC - PubMed
-
- Ge P, Wang W, Li L, Zhang G, Gao Z, Tang Z, Dang X, Wu Y. Profiles of immune cell infiltration and immune-related genes in the tumor microenvironment of colorectal cancer. Biomed Pharmacother. 2019;118:109228. - PubMed
LinkOut - more resources
Full Text Sources
Research Materials
