. 2022 Oct 5:2:961593.
doi: 10.3389/fepid.2022.961593. eCollection 2022.

The many definitions of multiplicity of infection

Affiliations

The many definitions of multiplicity of infection

Kristan Alexander Schneider et al. Front Epidemiol. .

Abstract

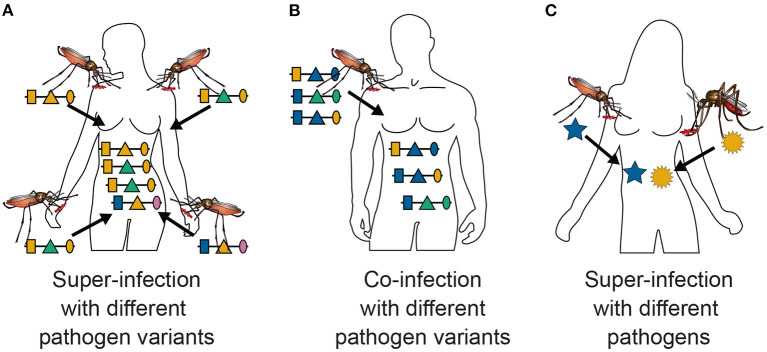
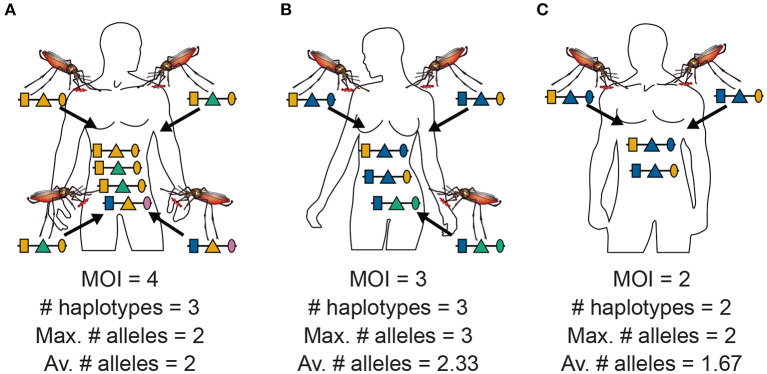
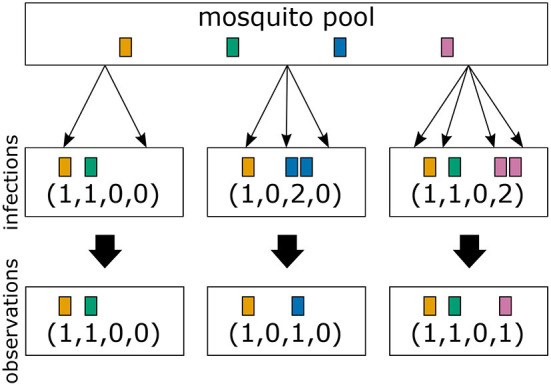
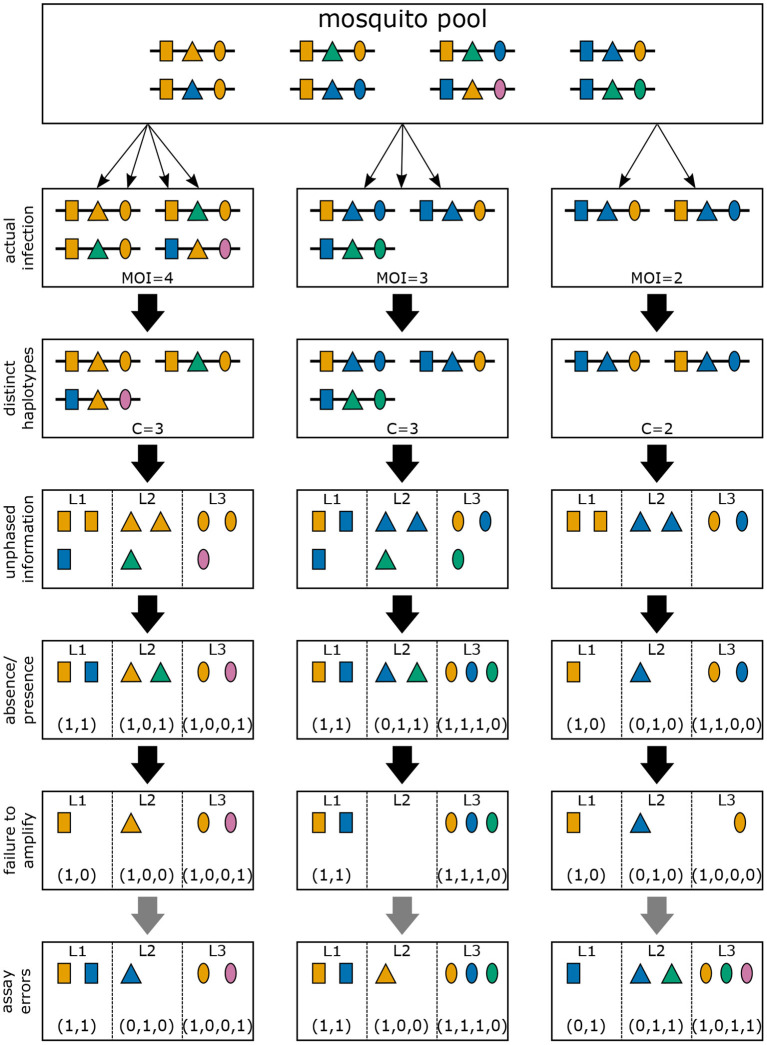
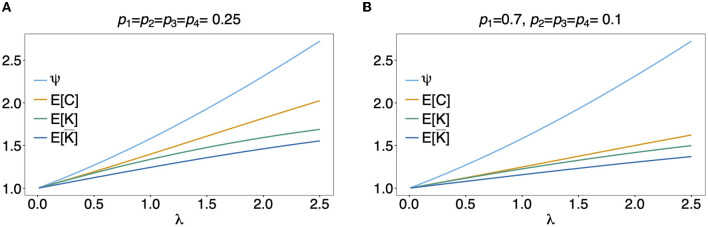
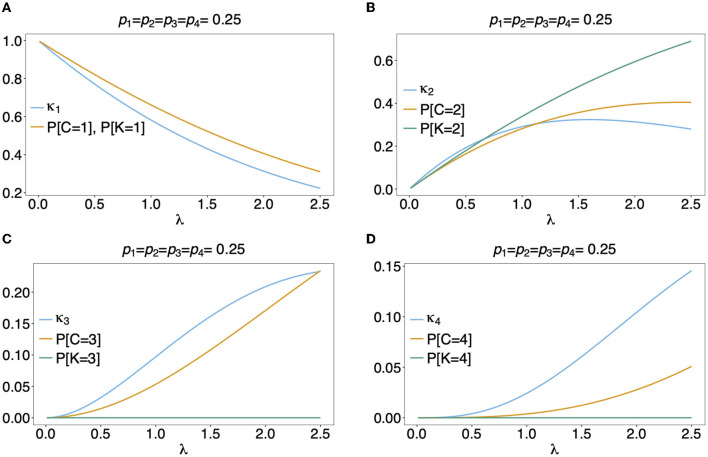
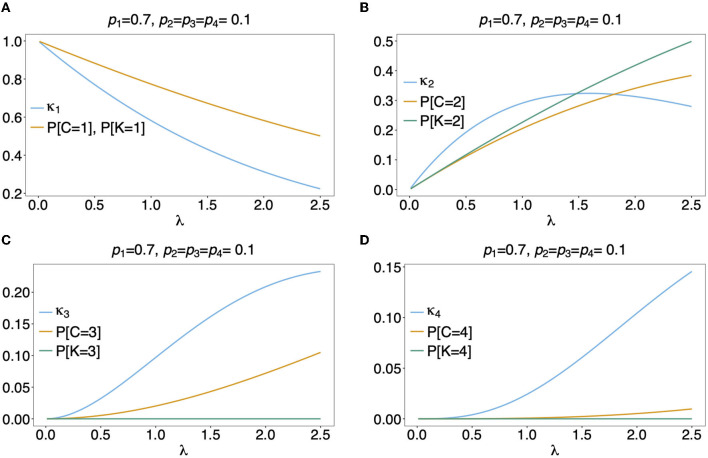
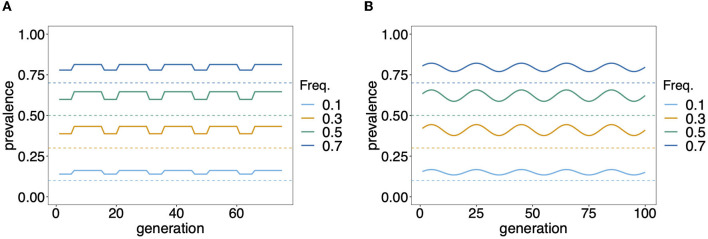
The presence of multiple genetically different pathogenic variants within the same individual host is common in infectious diseases. Although this is neglected in some diseases, it is well recognized in others like malaria, where it is typically referred to as multiplicity of infection (MOI) or complexity of infection (COI). In malaria, with the advent of molecular surveillance, data is increasingly being available with enough resolution to capture MOI and integrate it into molecular surveillance strategies. The distribution of MOI on the population level scales with transmission intensities, while MOI on the individual level is a confounding factor when monitoring haplotypes of particular interests, e.g., those associated with drug-resistance. Particularly, in high-transmission areas, MOI leads to a discrepancy between the likelihood of a haplotype being observed in an infection (prevalence) and its abundance in the pathogen population (frequency). Despite its importance, MOI is not universally defined. Competing definitions vary from verbal ones to those based on concise statistical frameworks. Heuristic approaches to MOI are popular, although they do not mine the full potential of available data and are typically biased, potentially leading to misinferences. We introduce a formal statistical framework and suggest a concise definition of MOI and its distribution on the host-population level. We show how it relates to alternative definitions such as the number of distinct haplotypes within an infection or the maximum number of alleles detectable across a set of genetic markers. It is shown how alternatives can be derived from the general framework. Different statistical methods to estimate the distribution of MOI and pathogenic variants at the population level are discussed. The estimates can be used as plug-ins to reconstruct the most probable MOI of an infection and set of infecting haplotypes in individual infections. Furthermore, the relation between prevalence of pathogenic variants and their frequency (relative abundance) in the pathogen population in the context of MOI is clarified, with particular regard to seasonality in transmission intensities. The framework introduced here helps to guide the correct interpretation of results emerging from different definitions of MOI. Especially, it excels comparisons between studies based on different analytical methods.

Keywords: MOI; co-infection; complexity of infection (COI); haplotype phasing; mixed-species infection; prevalence; super-infection; transmission intensities.


Conflict of interest statement

The authors declare that the research was conducted in the absence of any commercial or financial relationships that could be construed as a potential conflict of interest.

Figures

Figure 1
Figure 1
Super- and co-infections: Illustrated is the difference between super- and co-infections in the case of vector-borne diseases. (A) Shows 4 super-infections (MOI = 4) with pathogenic variants, i.e., four independent infective events. At each infective event one pathogenic variant is transmitted. Pathogenic variants are characterized genetically by their allelic expressions (colors) at three positions (shapes) in the genome, which is illustrated by the horizontal lines. Note that MOI = 4 although only three distinct haplotypes are transmitted, because two vectors transmit the same pathogenic variant. (B) Illustrates a co-infection with three pathogenic variants, i.e., a single infective event at which three pathogenic variants are transmitted. (C) Illustrates a super-infection with two different pathogens, illustrated by different shapes, transmitted by different vector species.
Figure 2
Figure 2
MOI, maximum, and average numbers of alleles: Illustrated are the alternative definitions of MOI for three hypothetical infections with pathogenic variants. (A) Shows four super-infections (cf. Figure 1A), i.e., MOI = 4, with three different haplotypes, i.e., C = 3. At each locus, two different alleles are observed, hence the maximum number of alleles per locus equals two, i.e., K = 2, and the average number of alleles also equals two, i.e., K¯=6/3=2. (B) Shows three super-infections (MOI = 3) with three different haplotypes (C = 3). At the first and second locus, two different alleles are observed, while three different alleles are observed at the third locus, hence the maximum number of alleles equals three (K = 3), while the average number of alleles equals K¯=7/3=2.33. (C) Illustrates two super-infections (MOI = 2) with two different pathogenic variants (C = 2). The two variants differ at the first and third locus but not at the second locus. Hence, the maximum number of different alleles is K = 2, while the average number is K¯=5/3=1.67.
Figure 3
Figure 3
From infections to observations: Illustrated are three infections with a mosquito-borne disease and the corresponding observations assuming that pathogenic variants are characterized by a single marker. Infections correspond to sampling pathogenic variants with replacement according to their frequency distribution in the pathogen population (mosquito pool). Infections are shown in the middle row, while their corresponding observations are shown in the bottom row. The first infection has MOI = 2 and contains two different pathogenic variants. In this case both variants are detectable in a clinical sample. The second infection has MOI = 3, but only two different pathogenic variants are transmitted, because one variant is transmitted twice. The number of times each variant is infecting cannot be reconstructed from a clinical sample, i.e., infections are in general unobservable. Only the absence/presence of variants is observable. The third sample has MOI = 4 and contains three different pathogenic variants.
Figure 4
Figure 4
Infections and observations: Illustrated are three different infections with pathogenic variants of a mosquito-borne disease (cf. Figures 2, 3). Pathogenic variants are characterized by alleles (colors) at three different genetic markers (shapes). The variants circulating in the pathogen population are illustrated at the top (mosquito pool). The second row illustrates the three infections of Figure 2, which is unobservable in practice. The first loss of information is the number of times each variant was transmitted. Resulting only in the presence of distinct haplotypes present in the infections. Typically, molecular information is unphased. If phasing information is removed, the observations illustrated in the fourth row emerge. However, information on how many haplotypes carry which allele is also lost. Only the absence/presence of alleles in a clinical specimen is typically possible as illustrated in the fifth row. Due to imperfect molecular methods, some alleles at some loci might fail to be identified, as illustrated in the sixth row (failure to amplify). Illustrated in row seven (assay errors) are errors in molecular assays that can result in wrong identification of alleles at each marker.
Figure 5
Figure 5
Mean MOI: Shown are the expectations of the different definitions of MOI, i.e., the mean numbers of super-infections (ψ), different haplotypes (E[C]), the maximum number of alleles across loci (E[K]), and of the average number of alleles per locus (E[K¯]). The same genetic architecture as in Figures 6, 7 are assumed. The haplotype frequency distributions used in (A,B) are show at the top of the panels.
Figure 6
Figure 6
Distributions of MOI-derived quantities: Illustrated are the probability mass function of the different definitions of MOI, i.e., the number of super-infections (κm), the number of different haplotypes (C), maximum number of alleles across loci (K), assuming that the number of super-infections is conditionally Poisson distributed and a genetic architecture of two biallelic loci, resulting in 4 possible haplotypes. The haplotype frequency distribution (shown on top of the panels) is assumed to be balanced. Figures (A–D) Show the probabilities of MOI (in the respective definition) to be equal 1, 2, 3, and 4, respectively, as a function of the Poisson parameter λ. With the underlying genetic architecture C ≤ 4 and K ≤ 2.
Figure 7
Figure 7
(A–D) Distributions of MOI-derived quantities: See Figure 6 but for an unbalanced haplotype frequency distribution.
Figure 8
Figure 8
Prevalence: Shown is the change in prevalence (solid lines) of pathogenic variants corresponding to different frequencies (dashed lines) over time and assuming that MOI follows a conditional Poisson distribution with changing MOI parameter. Time is measured in units of transmission cycles. (A) Corresponds to seasonal transmission with a dry season having MOI parameter λ = 0.8 that lasts for five transmission cycles and a rainy season with higher transmission (λ = 1.2) which lasts for 10 transmission cycles. (B) Assumes seasonally fluctuating transmission, where the MOI parameter λ fluctuates in a sine wave that lasts 20 transmission cycles by 30% around a seasonal average of λ¯=1.
Figure 9
Figure 9
Distribution of MOI conditioned on an observation: Assuming a genetic architecture of two biallelic loci (resulting in 4 possible haplotypes), the distribution of MOI (assuming a conditional Poisson distribution) given the observation x = ({1}, {1, 2}) is shown as a function of the Poisson parameter λ for MOI = 1, …, 6. This observation can only contain haplotypes h1 having allelic configuration (1, 1) and h2 having allelic configurations (1, 2). The probabilities of MOI given x is independent of the haplotype frequencies p3 and p4. The frequencies p1 and p2 used in (A,B) are shown on top of the panels. Note that P[C = 2|x] = 1 for x = ({1}, {1, 2}).
Figure 10
Figure 10
Distribution of MOI and the number of haplotypes conditioned on an observation: Assuming a conditional Poisson distribution for MOI and a genetic architecture of two biallelic loci (resulting in 4 possible haplotypes), the distribution of MOI (A,C) and the number of haplotypes C (B,D) given the observation x = ({1, 2}, {1, 2}) are shown as functions of the Poisson parameter λ for MOI = 1, …, 6 and C = 1, …, 4, respectively. The haplotype frequency distributions used are shown at the top of the panels.

Similar articles

Cited by

References

    1. Fairchild G, Tasseff B, Khalsa H, Generous N, Daughton AR, Velappan N, et al. . Epidemiological data challenges: planning for a more robust future through data standards. Front Public Health. (2018) 6:336. 10.3389/fpubh.2018.00336 - DOI - PMC - PubMed
    1. Wood SN, Wit EC, Fasiolo M, Green PJ. COVID-19 and the difficulty of inferring epidemiological parameters from clinical data. Lancet Infect Dis. (2021) 21:27–8. 10.1016/S1473-3099(20)30437-0 - DOI - PMC - PubMed
    1. Murray CJ, Lopez, AD, Mathers, CD,. The Global Epidemiology of Infectious Diseases. Geneva: WHO (2004). Available online at: https://apps.who.int/iris/handle/10665/43048
    1. Bousema T, Okell L, Felger I, Drakeley C. Asymptomatic malaria infections: detectability, transmissibility and public health relevance. Nat Rev Microbiol. (2014) 12:833–40. 10.1038/nrmicro3364 - DOI - PubMed
    1. Shears P. Poverty and infection in the developing world: healthcare-related infections and infection control in the tropics. J Hosp Infect. (2007) 67:217–24. 10.1016/j.jhin.2007.08.016 - DOI - PMC - PubMed

LinkOut - more resources