

A maximum-likelihood method to estimate haplotype frequencies and prevalence alongside multiplicity of infection from SNP data
- PMID: 38455338
- PMCID: PMC10911023
- DOI: 10.3389/fepid.2022.943625
A maximum-likelihood method to estimate haplotype frequencies and prevalence alongside multiplicity of infection from SNP data
Abstract
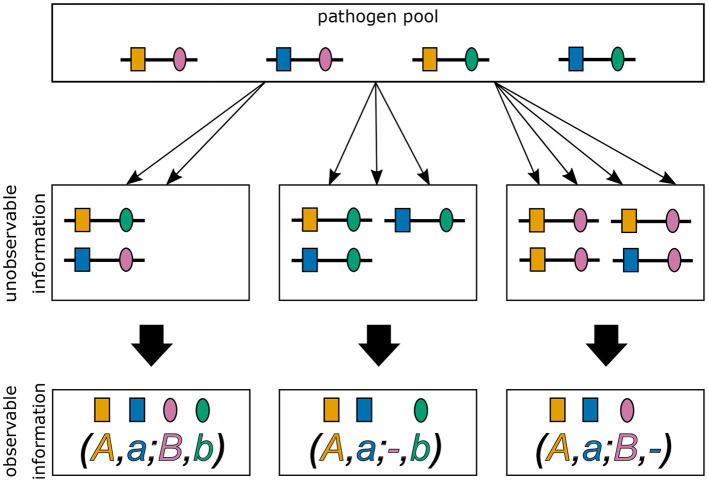
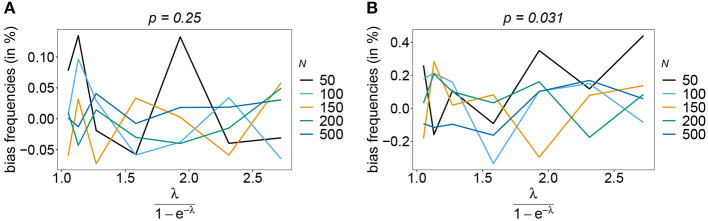
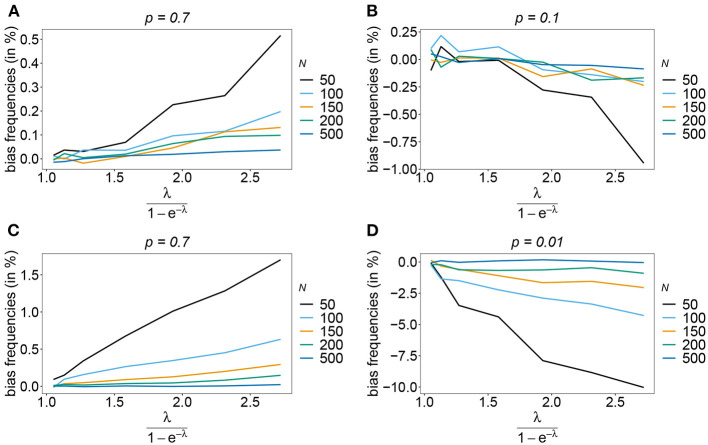
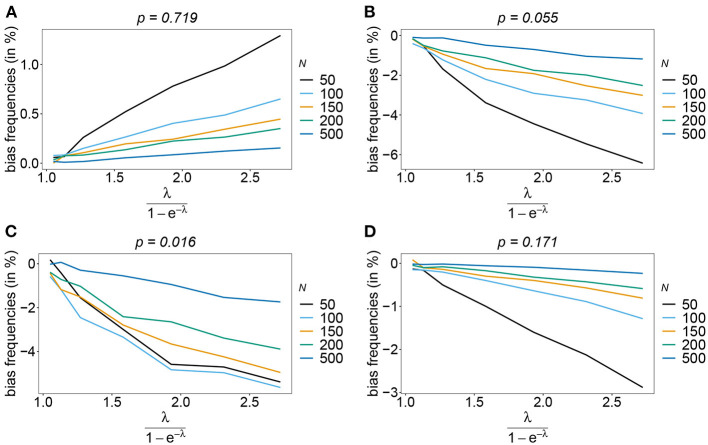
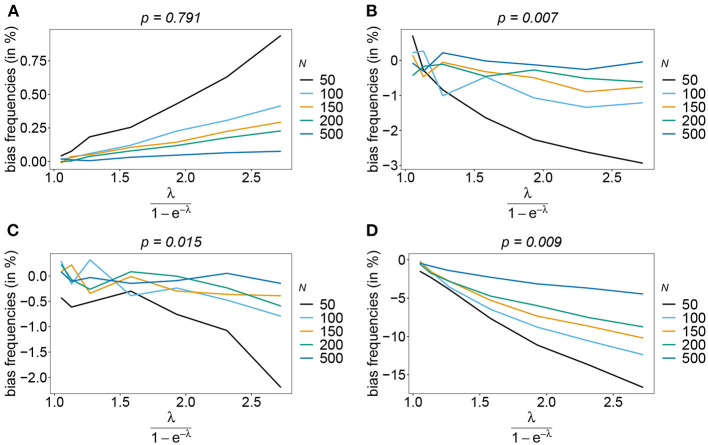
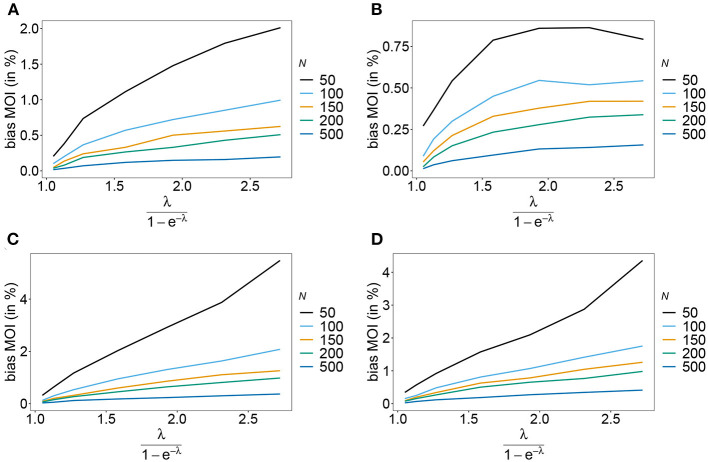
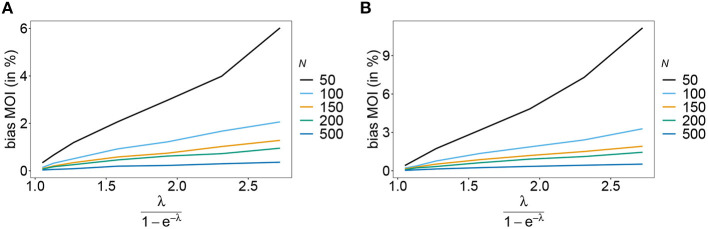
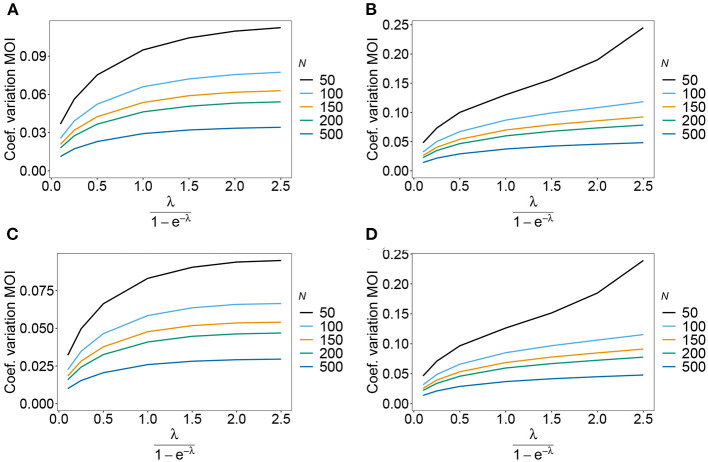
The introduction of genomic methods facilitated standardized molecular disease surveillance. For instance, SNP barcodes in Plasmodium vivax and Plasmodium falciparum malaria allows the characterization of haplotypes, their frequencies and prevalence to reveal temporal and spatial transmission patterns. A confounding factor is the presence of multiple genetically distinct pathogen variants within the same infection, known as multiplicity of infection (MOI). Disregarding ambiguous information, as usually done in ad-hoc approaches, leads to less confident and biased estimates. We introduce a statistical framework to obtain maximum-likelihood estimates (MLE) of haplotype frequencies and prevalence alongside MOI from malaria SNP data, i.e., multiple biallelic marker loci. The number of model parameters increases geometrically with the number of genetic markers considered and no closed-form solution exists for the MLE. Therefore, the MLE needs to be derived numerically. We use the Expectation-Maximization (EM) algorithm to derive the maximum-likelihood estimates, an efficient and easy-to-implement algorithm that yields a numerically stable solution. We also derive expressions for haplotype prevalence based on either all or just the unambiguous genetic information and compare both approaches. The latter corresponds to a biased ad-hoc estimate of prevalence. We assess the performance of our estimator by systematic numerical simulations assuming realistic sample sizes and various scenarios of transmission intensity. For reasonable sample sizes, and number of loci, the method has little bias. As an example, we apply the method to a dataset from Cameroon on sulfadoxine-pyrimethamine resistance in P. falciparum malaria. The method is not confined to malaria and can be applied to any infectious disease with similar transmission behavior. An easy-to-use implementation of the method as an R-script is provided.
Keywords: EM-algorithm; complexity of infection (COI); drug resistance; haplotype phasing; malaria; multiplicity of infection (MOI); resistance markers; sulfadoxine-pyrimethamine (SP).
Copyright © 2022 Tsoungui Obama and Schneider.
Conflict of interest statement
The authors declare that the research was conducted in the absence of any commercial or financial relationships that could be construed as a potential conflict of interest.
Figures
Similar articles
-
Estimating multiplicity of infection, haplotype frequencies, and linkage disequilibria from multi-allelic markers for molecular disease surveillance.PLoS One. 2025 May 27;20(5):e0321723. doi: 10.1371/journal.pone.0321723. eCollection 2025. PLoS One. 2025. PMID: 40424286 Free PMC article.
-
Review of MrsFreqPhase methods: methods designed to estimate statistically malaria parasite multiplicity of infection, relatedness, frequency and phase.Malar J. 2024 Oct 15;23(1):308. doi: 10.1186/s12936-024-05119-2. Malar J. 2024. PMID: 39407242 Free PMC article. Review.
-
The many definitions of multiplicity of infection.Front Epidemiol. 2022 Oct 5;2:961593. doi: 10.3389/fepid.2022.961593. eCollection 2022. Front Epidemiol. 2022. PMID: 38455332 Free PMC article.
-
Estimating multiplicity of infection, allele frequencies, and prevalences accounting for incomplete data.PLoS One. 2024 Mar 21;19(3):e0287161. doi: 10.1371/journal.pone.0287161. eCollection 2024. PLoS One. 2024. PMID: 38512826 Free PMC article.
-
Molecular approaches to determine the multiplicity of Plasmodium infections.Malar J. 2018 Apr 23;17(1):172. doi: 10.1186/s12936-018-2322-5. Malar J. 2018. PMID: 29685152 Free PMC article. Review.
Cited by
-
Haplotype based testing for a better understanding of the selective architecture.BMC Bioinformatics. 2023 Aug 26;24(1):322. doi: 10.1186/s12859-023-05437-3. BMC Bioinformatics. 2023. PMID: 37633901 Free PMC article.
-
Estimating multiplicity of infection, haplotype frequencies, and linkage disequilibria from multi-allelic markers for molecular disease surveillance.PLoS One. 2025 May 27;20(5):e0321723. doi: 10.1371/journal.pone.0321723. eCollection 2025. PLoS One. 2025. PMID: 40424286 Free PMC article.
-
Review of MrsFreqPhase methods: methods designed to estimate statistically malaria parasite multiplicity of infection, relatedness, frequency and phase.Malar J. 2024 Oct 15;23(1):308. doi: 10.1186/s12936-024-05119-2. Malar J. 2024. PMID: 39407242 Free PMC article. Review.
-
The many definitions of multiplicity of infection.Front Epidemiol. 2022 Oct 5;2:961593. doi: 10.3389/fepid.2022.961593. eCollection 2022. Front Epidemiol. 2022. PMID: 38455332 Free PMC article.
-
SNP-slice resolves mixed infections: simultaneously unveiling strain haplotypes and linking them to hosts.Bioinformatics. 2024 Jun 3;40(6):btae344. doi: 10.1093/bioinformatics/btae344. Bioinformatics. 2024. PMID: 38885409 Free PMC article.
References
LinkOut - more resources
Full Text Sources
Research Materials