

Identification of tumor heterogeneity associated with KRAS/TP53 co-mutation status in lung adenocarcinoma based on single-cell RNA sequencing
- PMID: 38455404
- PMCID: PMC10915312
- DOI: 10.62347/NXAJ9418
Identification of tumor heterogeneity associated with KRAS/TP53 co-mutation status in lung adenocarcinoma based on single-cell RNA sequencing
Abstract
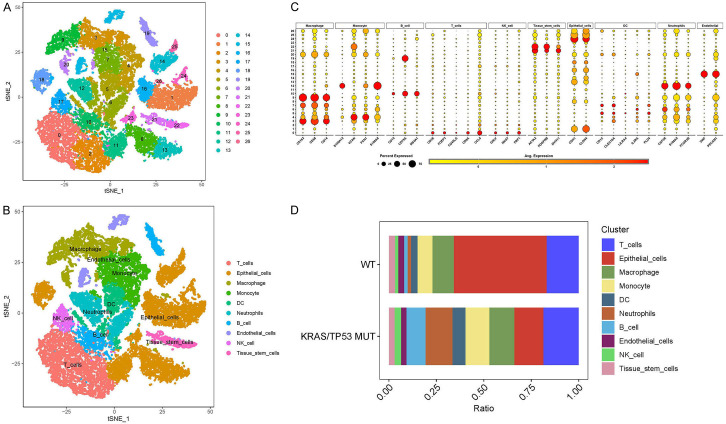
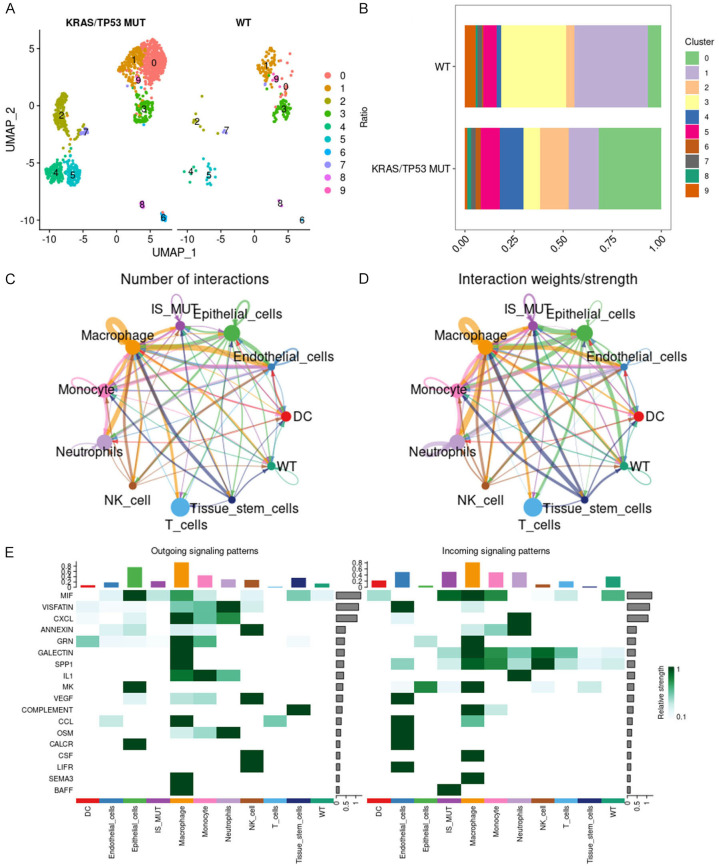
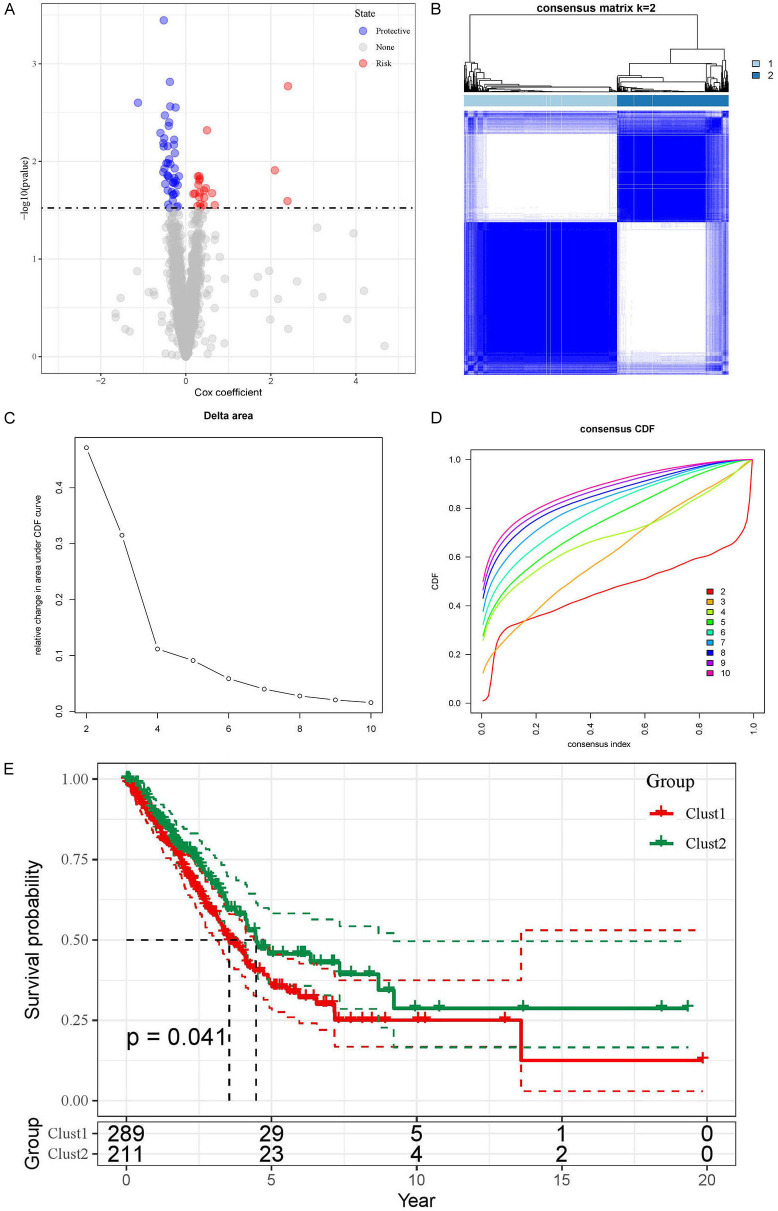
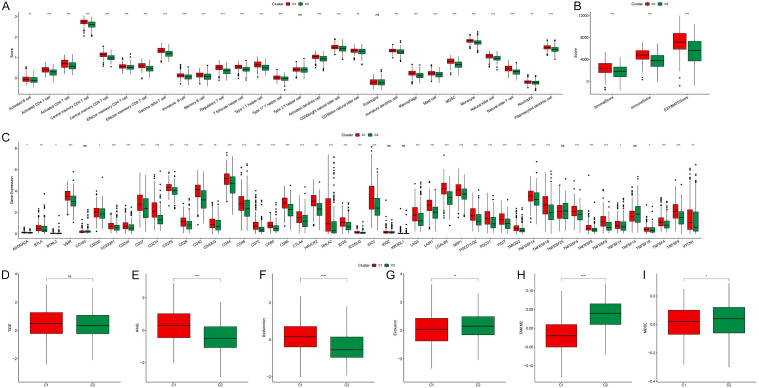
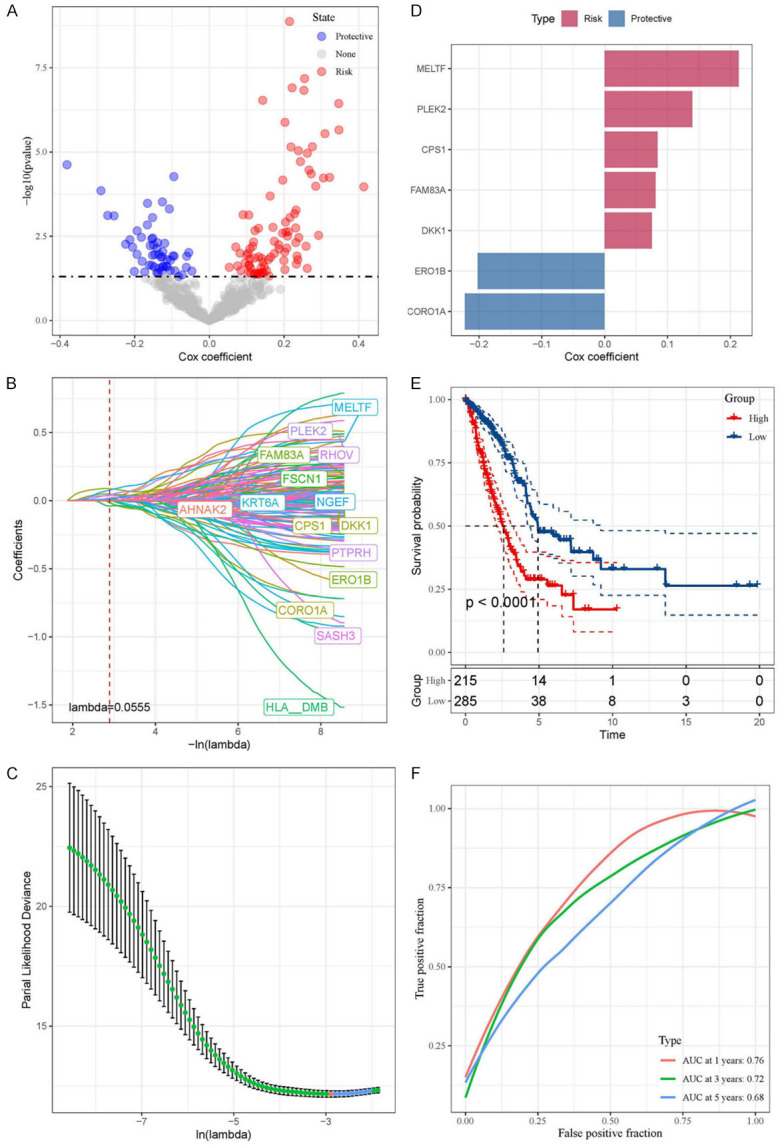
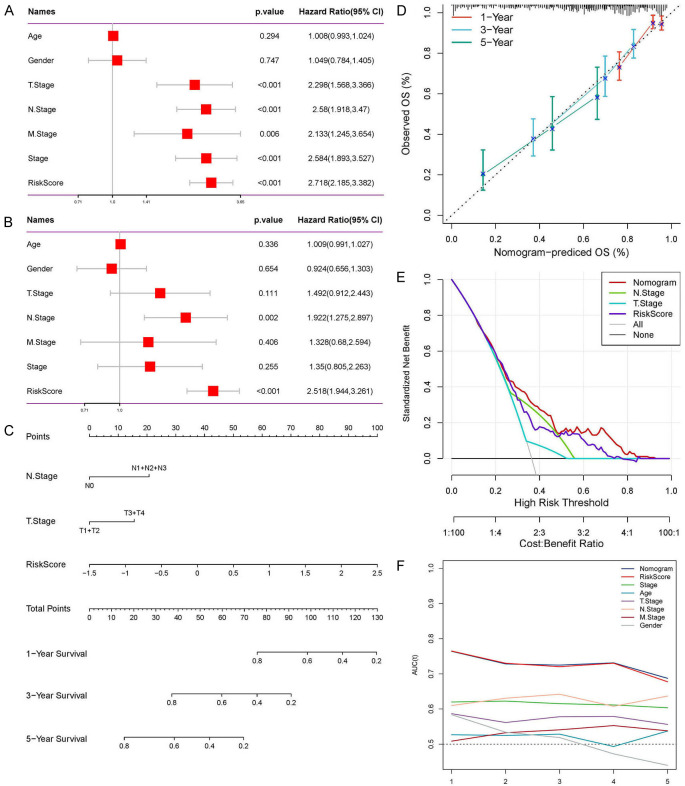
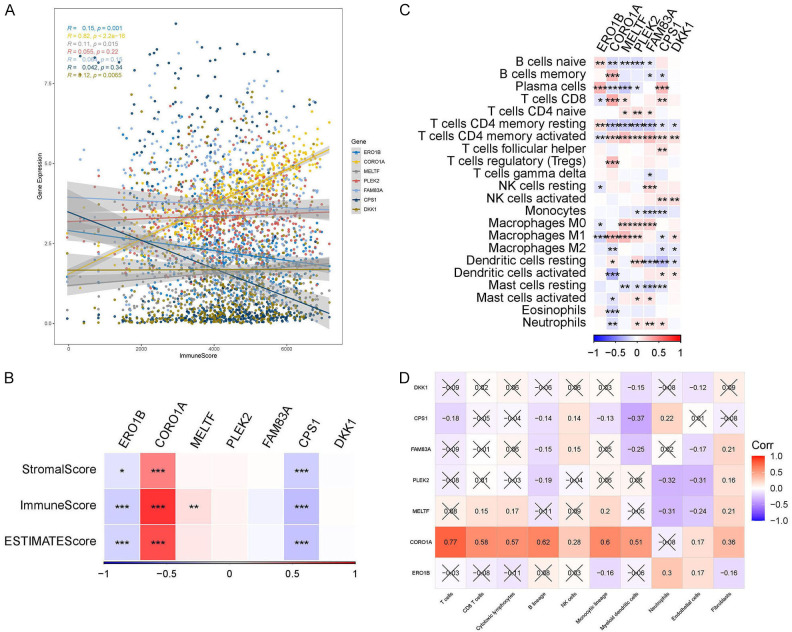
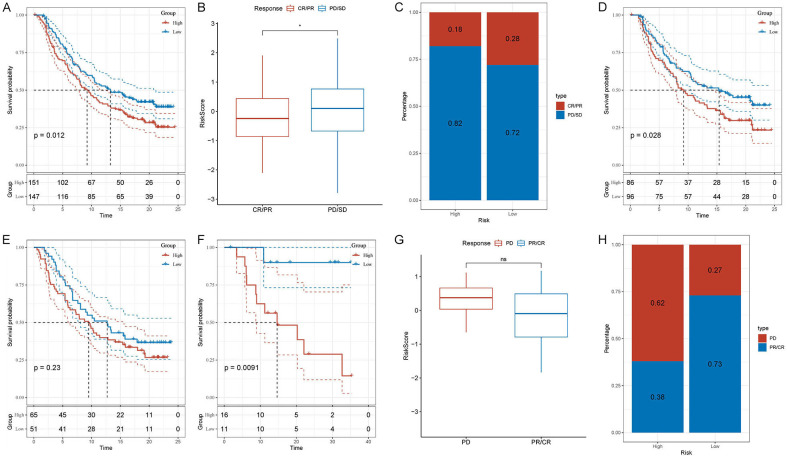
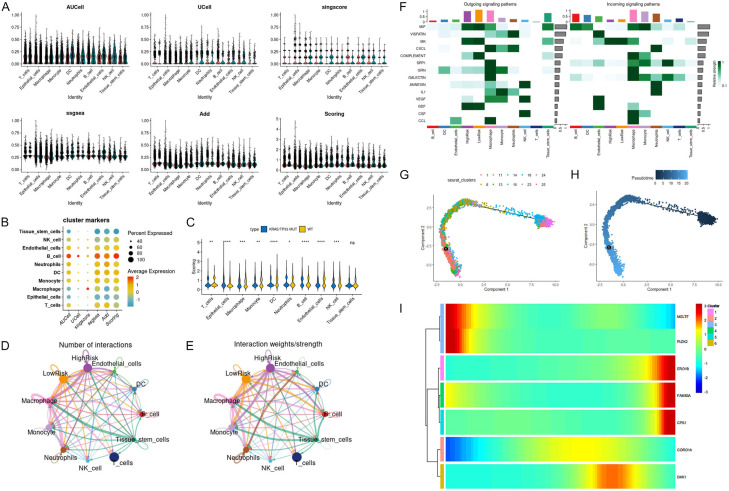
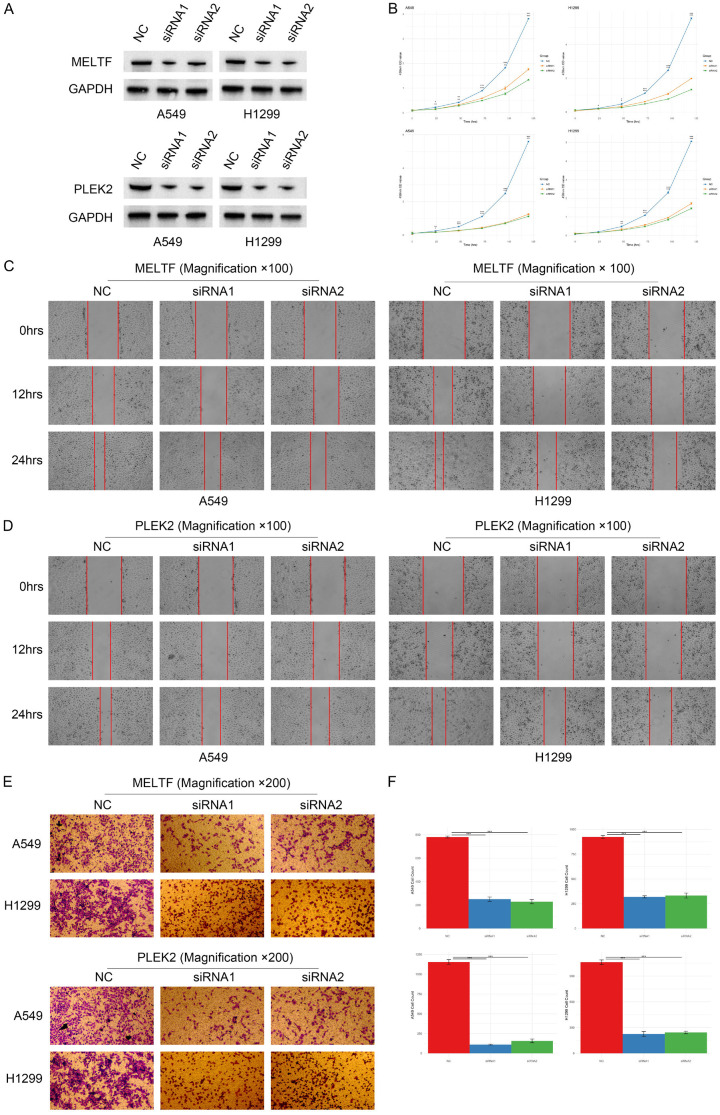
Lung cancer stands as the predominant cause of cancer-related mortality globally. Lung adenocarcinoma (LUAD), being the most prevalent subtype, garners extensive attention due to its notable heterogeneity, which significantly influences tumor development and treatment approaches. This research leverages single-cell RNA sequencing (scRNA-seq) datasets to delve into the impact of KRAS/TP53 co-mutation status on LUAD. Moreover, utilizing the TCGA-LUAD dataset, we formulated a novel predictive risk model, comprising seven prognostic genes, through LASSO regression, and subjected it to both internal and external validation sets. The study underscores the profound impact of KRAS/TP53 co-mutational status on the tumor microenvironment (TME) of LUAD. Crucially, KRAS/TP53 co-mutation markedly influences the extent of B cell infiltration and various immune-related pathways within the TME. The newly developed predictive risk model exhibited robust performance across both internal and external validation sets, establishing itself as a viable independent prognostic factor. Additionally, in vitro experiments indicate that MELTF and PLEK2 can modulate the invasion and proliferation of human non-small cell lung cancer cells. In conclusion, we elucidated that KRAS/TP53 co-mutations may modulate TME and patient prognosis by orchestrating B cells and affiliated pathways. Furthermore, we spotlight that MELTF and PLEK2 not only function as prognostic indicators for LUAD, but also lay the foundation for the exploration of innovative therapeutic approaches.
Keywords: B cell; KRAS; Lung adenocarcinoma; TP53; mutation; prognosis; single-cell RNA sequenceing.
AJCR Copyright © 2024.
Conflict of interest statement
All authors declare that the research was conducted in the absence of any circumstances that could be construed as a potential conflict of interest.
Figures
Similar articles
-
Elaboration and validation of a prognostic signature associated with disulfidoptosis in lung adenocarcinoma, consolidated with integration of single-cell RNA sequencing and bulk RNA sequencing techniques.Front Immunol. 2023 Oct 27;14:1278496. doi: 10.3389/fimmu.2023.1278496. eCollection 2023. Front Immunol. 2023. PMID: 37965333 Free PMC article.
-
KRAS G12D mutation predicts lower TMB and drives immune suppression in lung adenocarcinoma.Lung Cancer. 2020 Nov;149:41-45. doi: 10.1016/j.lungcan.2020.09.004. Epub 2020 Sep 10. Lung Cancer. 2020. PMID: 32956987
-
Identification of LGR4 as a prognostic biomarker in KRAS-mutant lung adenocarcinoma: Evidence from integrated bioinformatics analysis.Medicine (Baltimore). 2023 Nov 17;102(46):e36084. doi: 10.1097/MD.0000000000036084. Medicine (Baltimore). 2023. PMID: 37986325 Free PMC article.
-
YTHDF1 Promotes Cyclin B1 Translation through m6A Modulation and Contributes to the Poor Prognosis of Lung Adenocarcinoma with KRAS/TP53 Co-Mutation.Cells. 2021 Jul 2;10(7):1669. doi: 10.3390/cells10071669. Cells. 2021. PMID: 34359836 Free PMC article.
-
Immune landscape and a promising immune prognostic model associated with TP53 in early-stage lung adenocarcinoma.Cancer Med. 2021 Feb;10(3):806-823. doi: 10.1002/cam4.3655. Epub 2020 Dec 12. Cancer Med. 2021. PMID: 33314730 Free PMC article.
Cited by
-
The latest advances in liquid biopsy for lung cancer-a narrative review.Transl Lung Cancer Res. 2024 Nov 30;13(11):3241-3251. doi: 10.21037/tlcr-24-828. Epub 2024 Nov 27. Transl Lung Cancer Res. 2024. PMID: 39669995 Free PMC article. Review.
-
Revisiting variation in the somatic mutation landscape of non-small cell lung cancer.HGG Adv. 2025 Apr 10;6(2):100420. doi: 10.1016/j.xhgg.2025.100420. Epub 2025 Feb 24. HGG Adv. 2025. PMID: 40007122 Free PMC article.
-
Clinical characteristics of KRAS mutation subtypes in non-small cell lung cancer population in Xinjiang, China, and their impact on the prognosis of immunotherapy.J Cancer Res Clin Oncol. 2024 Sep 7;150(9):413. doi: 10.1007/s00432-024-05932-x. J Cancer Res Clin Oncol. 2024. PMID: 39244518 Free PMC article.
References
-
- Thai AA, Solomon BJ, Sequist LV, Gainor JF, Heist RS. Lung cancer. Lancet. 2021;398:535–554. - PubMed
-
- Nicholson AG, Tsao MS, Beasley MB, Borczuk AC, Brambilla E, Cooper WA, Dacic S, Jain D, Kerr KM, Lantuejoul S, Noguchi M, Papotti M, Rekhtman N, Scagliotti G, van Schil P, Sholl L, Yatabe Y, Yoshida A, Travis WD. The 2021 WHO classification of lung tumors: impact of advances since 2015. J Thorac Oncol. 2022;17:362–387. - PubMed
LinkOut - more resources
Full Text Sources
Research Materials
Miscellaneous